1.ELK theory
01.ELK introduction
Generally, we need to perform log analysis scenarios: directly in the log file grep,awk You can get the information you want. However, in large-scale scenarios, this method is inefficient and faces problems, including how to archive if the log volume is too large, what to do if the text search is too slow, and how to query in multiple dimensions. Centralized log management is required to collect and summarize logs on all servers. The common solution is to establish a centralized log collection system to collect, manage and access the logs on all nodes.
Generally, a large-scale system is a distributed deployment architecture. Different service modules are deployed on different servers. When a problem occurs, it is necessary to locate the specific server and service module according to the key information exposed by the problem, and build a centralized log system, which can improve the efficiency of locating the problem.
ELK The platform is a complete set of centralized log processing solutions ElasticSearch,Logstash and Kiabana The three open source tools are used together to meet more powerful user requirements for log query, sorting and statistics.
ElasticSearch:Is based on Lucene (Architecture of a full text retrieval engine)The developed distributed storage retrieval engine is used to store all kinds of logs.
Elasticsearch Yes Java Developed through RESTful Web Interface, so that users can communicate with users through the browser Elasticsearch signal communication.
Elasticsearch It is a distributed search and analysis engine. Its advantage is that it can store, search and analyze large amounts of data in near real time.
Logstash:As a data collection engine. It supports dynamic data collection from various data sources, filtering, analyzing, enriching and unifying the data, and then storing it to the location specified by the user,Usually sent to Elasticsearch.
Logstash from JRuby Language, running in Java virtual machine(JVM) It is a powerful data processing tool, which can realize data transmission, format processing and formatted output. Logstash It has powerful plug-in function and is often used for log processing.
Kiabana:Is based on Node.js The developed display tool can be Logstash and ElasticSearch Provide graphical log analysis Web Interface display, which can summarize, analyze and search important data logs.
Filebeat:Lightweight open source log file data collector. It is usually installed on the client that needs to collect data Filebeat,And specify the directory and log format, Filebeat Can quickly collect data and send it to logstash Parse or send directly to
Elasticsearch Storage, performance compared to running JVM.Upper logstash It has obvious advantages and is a substitute for it.
02.ELK's advantages
Logs mainly include system logs, application logs and security logs. System operation and maintenance personnel and developers can understand the software and hardware information of the server through the log, check the errors in the configuration process and the causes of the errors. Regular analysis of logs can understand the load, performance and security of the server, so as to take timely measures to correct errors.
Often we use the log of a single machine grep,awk Such tools can basically realize simple analysis, but when logs are scattered and stored on different devices. If you manage dozens or hundreds of servers, you are still using the traditional method of logging in to each machine in turn. Does this feel cumbersome and inefficient. It is imperative that we use centralized log management, such as:GPl syslog, Summarize the log collection on all servers. After centralized log management, log statistics and retrieval become a more troublesome thing, which is generally used by us grep,awk and wc etc. Linux Command can realize retrieval and statistics, but it is hard to use this method for higher requirements such as query, sorting and statistics and a large number of machines.
Generally, a large-scale system is a distributed deployment architecture. Different service modules are deployed on different servers. When a problem occurs, it is necessary to locate the specific server and service module according to the key information exposed by the problem, and build a centralized log system, which can improve the efficiency of locating the problem.
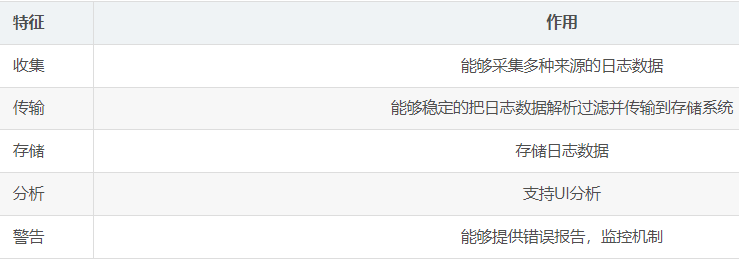
03. Basic features of complete log system
2.ELK working principle
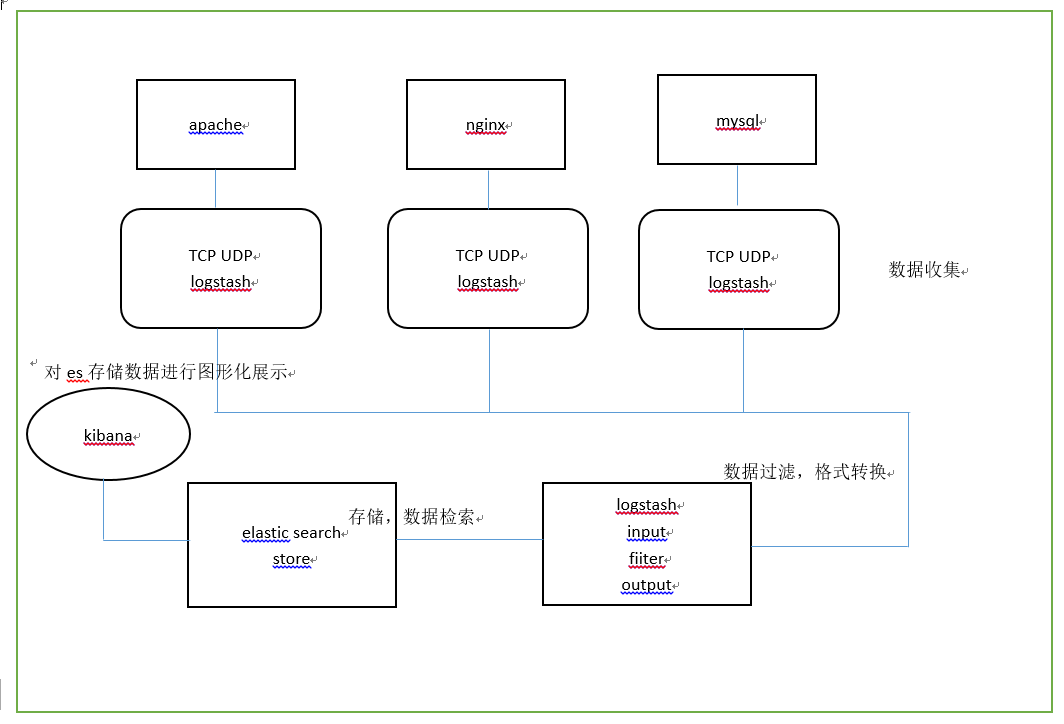
01. Function introduction
(1) Deploy Logstash on all servers that need to collect logs; Or you can centralize the log management on the log server and deploy Logstash on the log server.
(2) Logstash collects logs, formats them and outputs them to the Elasticsearch cluster.
(3) Elasticsearch indexes and stores formatted data.
(4)Kibana queries the data from the ES cluster, generates charts, and displays the front-end data.
Note: Logstash (heavyweight resource) is used to collect logs, and Filebeat (lightweight) can also be used to collect logs
3.ELK installation and deployment
01. Environmental preparation
Close the firewall, close selinux, and install Elasticsearch on three servers db01, db02, db03
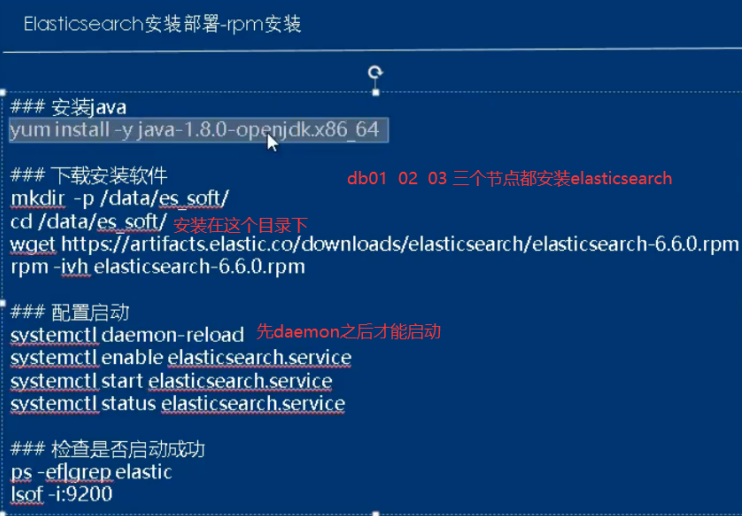
02. Install and configure Elasticsearch software
a. Install Java environment install es software start es software
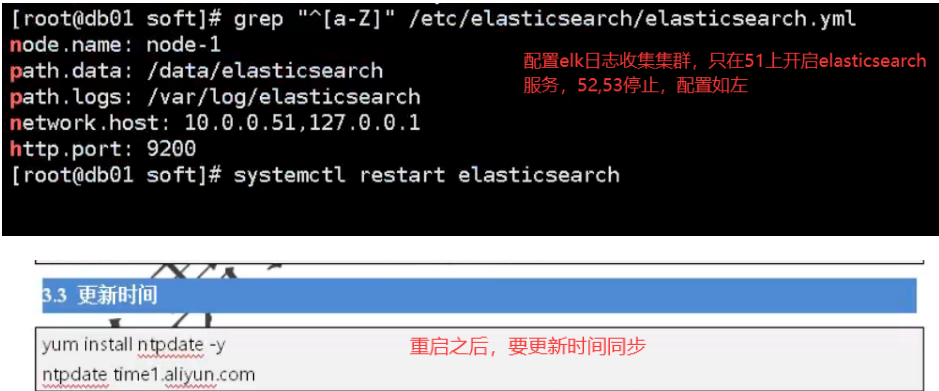
Installation configuration java:
yum install java-1.8.0-openjdk.x86_64 -y
java -version

Update time:
yum install ntpdate -y
ntpdate time1.aliyun.com

Installation configuration elasticsearch:
[root@elk-175 ~]# mkdir /data/soft/ -p
[root@elk-175 ~]# cd /data/soft/
[root@elk-175 soft]# rz --- upload all the software required by elk system to the specified directory of the server
[root@elk-175 soft]# ll
 Total consumption: 506120
-rw-r--r-- 1 root root 114059630 2 November 25:09 elasticsearch-6.6.0.rpm
-rw-r--r-- 1 root root  36581177 4 December 27:29 elasticsearch-head.tar.gz
-rw-r--r-- 1 root root  11790119 2 November 25:08 filebeat-6.6.0-x86_64.rpm
-rw-r--r-- 1 root root 185123116 2 November 25:11 kibana-6.6.0-x86_64.rpm
-rw-r--r-- 1 root root 170703770 2 November 25:38 logstash-6.6.0.rpm

Locally installed software:
 rpm -ivh elasticsearch-6.6.0.rpm
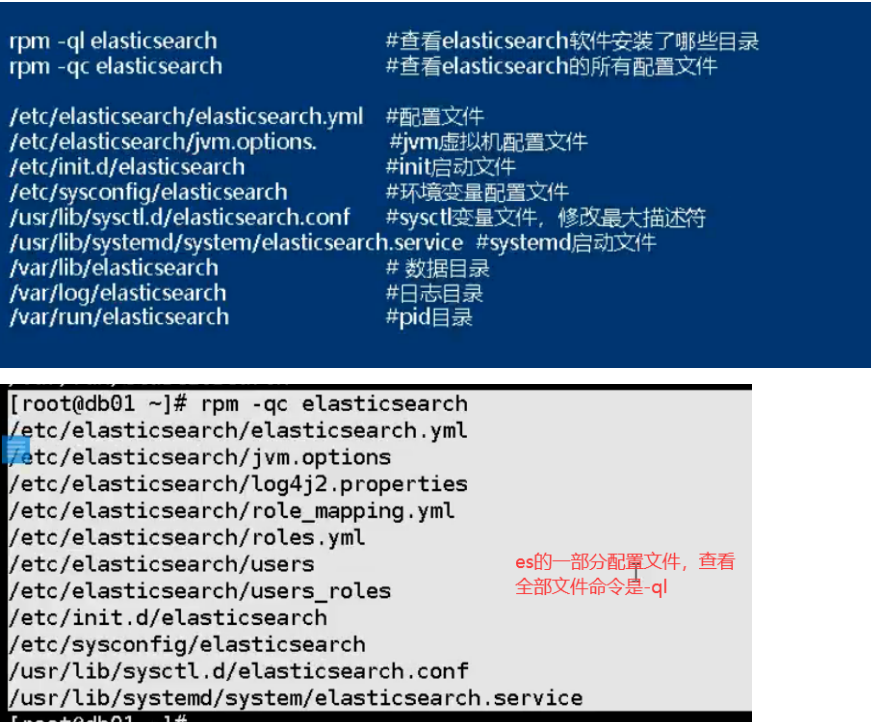
03. Relevant configuration directories and configuration files
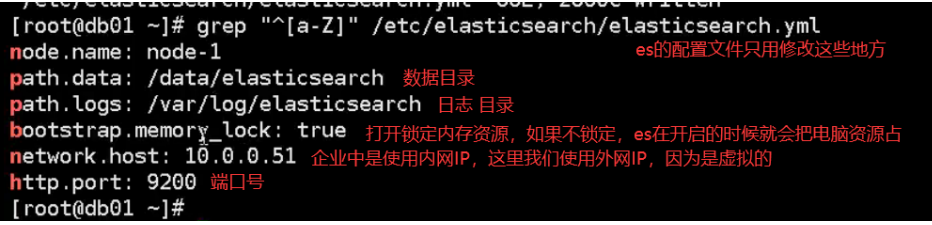
ES configuration file interpretation:
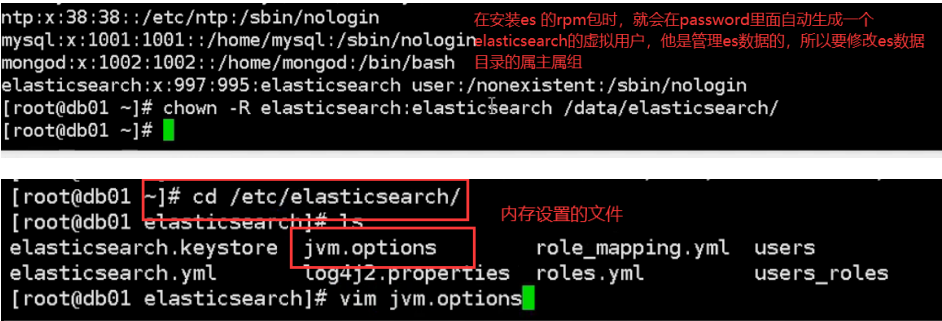
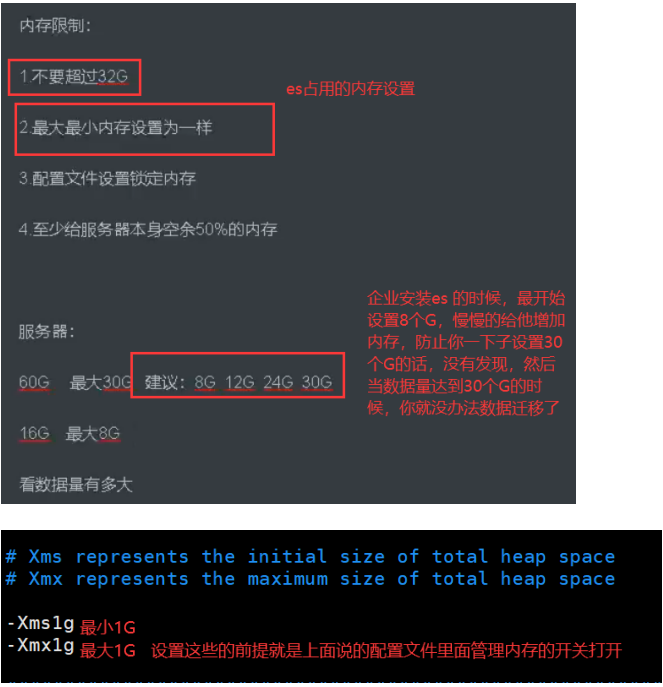
04. Modify the primary group and memory settings
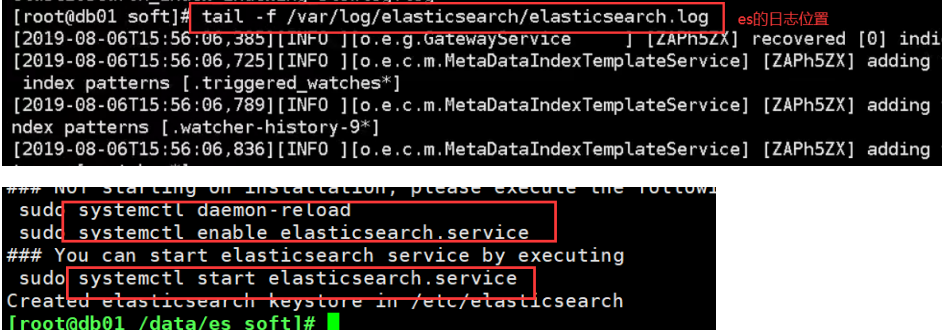
06. Startup failure: an error is reported and memory locking fails. Solution: check whether the startup is successful
a. Startup failure and error
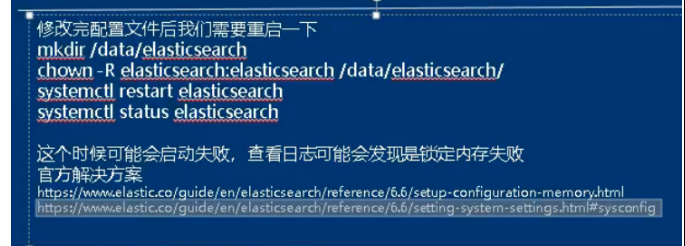
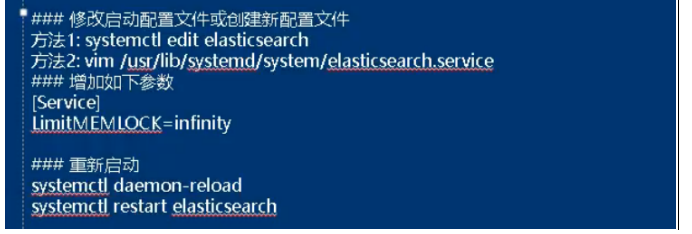
b. Failed to lock memory solution
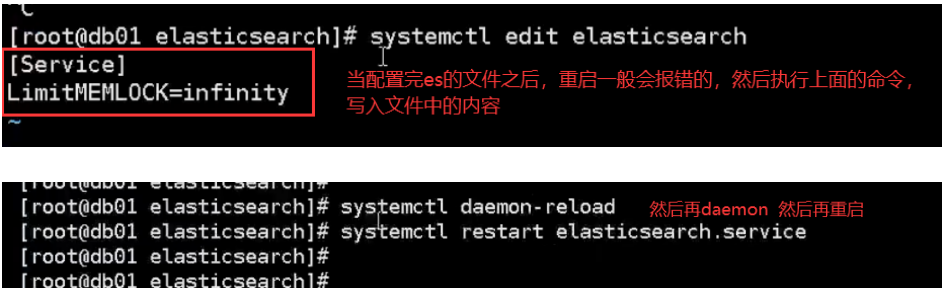
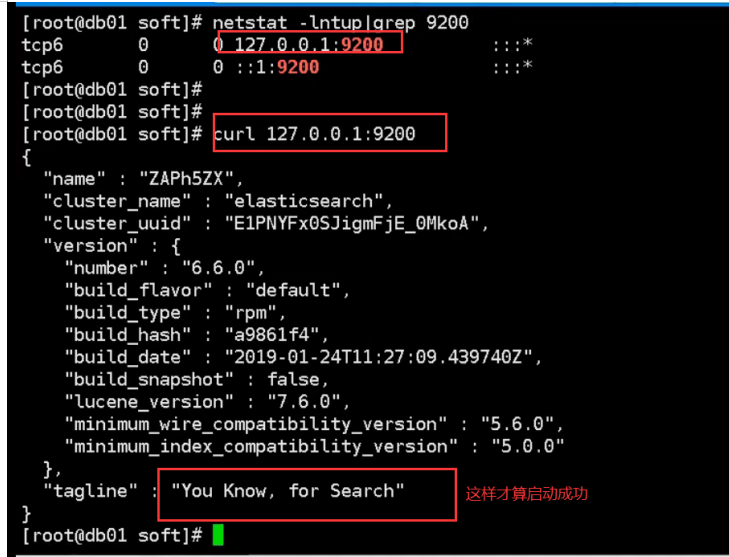
c. Check whether the startup is successful
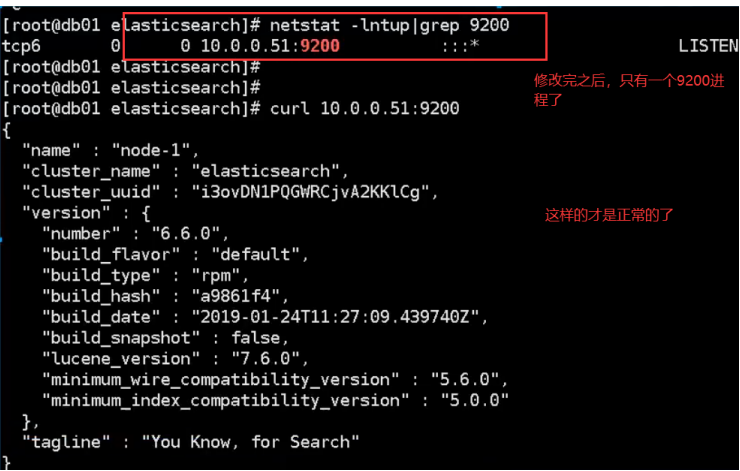
4. Install the ES head plug-in
01. Install and configure es head plug-in in service mode
a. Plug in official address
https://github.com/mobz/elasticsearch-head
b. Deploying elastic search head using docker
docker pull alivv/elasticsearch-head
docker run --name es-head -p 9100:9100 -dit alivv/elasticsearch-head
c. Compile and install using nodejs (not recommended)
Official website address:
https://nodejs.org/en/download/package-manager/
https://nodejs.org/dist/latest-v10.x/
http://npm.taobao.org
 Download and install:
yum install nodejs npm openssl screen -y
node -v
npm  -v
npm install -g cnpm --registry=https://registry.npm.taobao.org
cd /opt/
git clone git://github.com/mobz/elasticsearch-head.git
cd elasticsearch-head/
cnpm install
screen -S es-head
cnpm run start
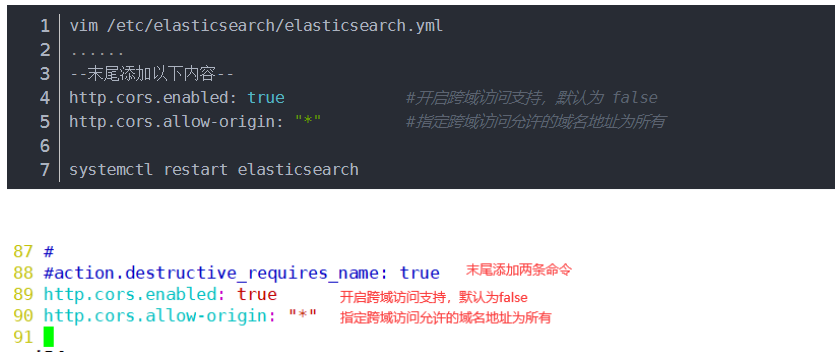
To modify the Elasticsearch main configuration file:
Start elasticsearch head service:
#The service must be started in the extracted elasticsearch head directory, and the process will read the gruntfile JS file, otherwise it may fail to start.
cd /usr/local/src/elasticsearch-head/
npm run start &

> elasticsearch-head@0.0.0 start /usr/local/src/elasticsearch-head
> grunt server

Running "connect:server" (connect) task
Waiting forever...
Started connect web server on http://localhost:9100

#The port monitored by elastic search head is 9100
netstat -natp |grep 9100
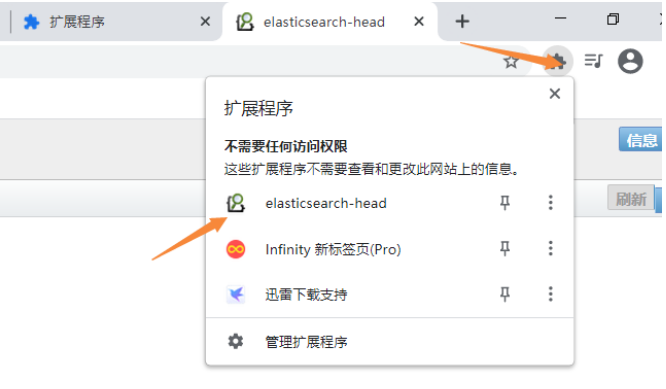
02. Install es head in the form of Google browser plug-in (simple and convenient, recommended)
Install using service mode es-head The plug-in process is cumbersome, and it often gets stuck when the network is bad
 Fortunately, es-head The official plug-in also provides another easier way, which is google chrome Plug in for
 The advantages are as follows;
1.Installation free, download the plug-in directly and install it in the browser
2.It can be used as long as the browser and server can communicate   ---Find the browser plug-in yourself
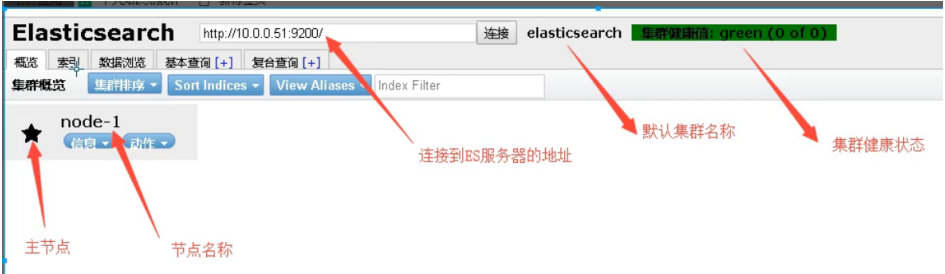
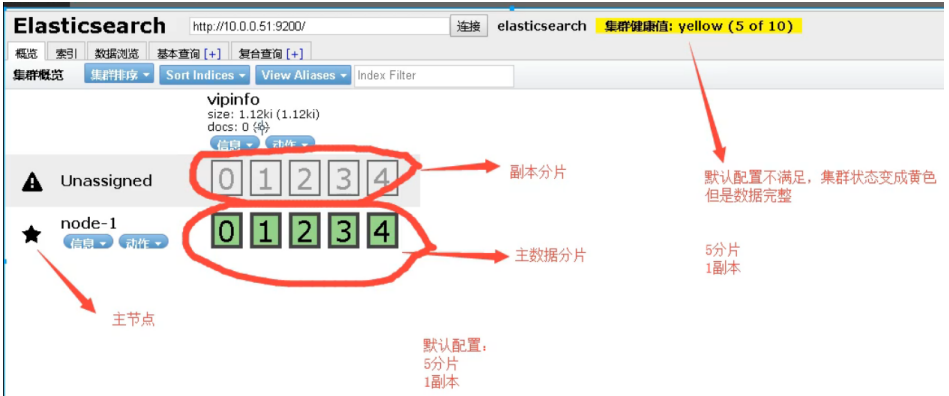
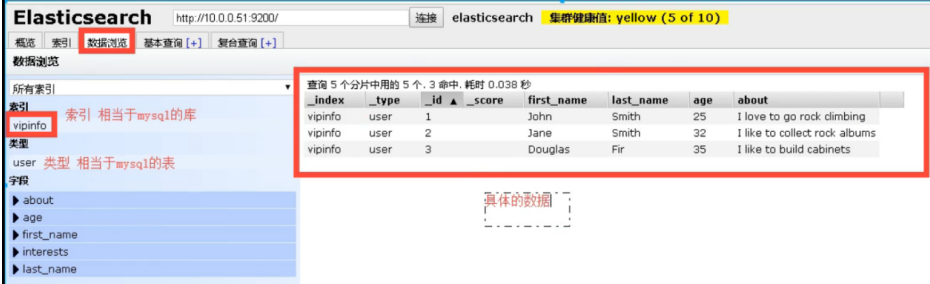
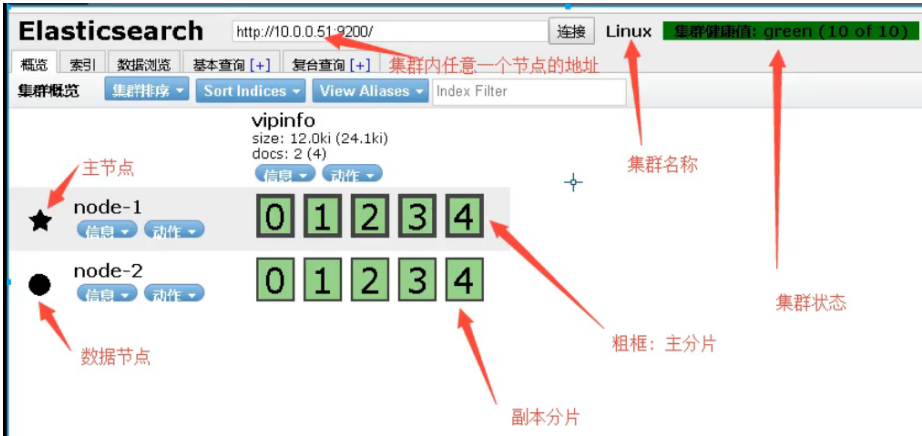
5.es head display
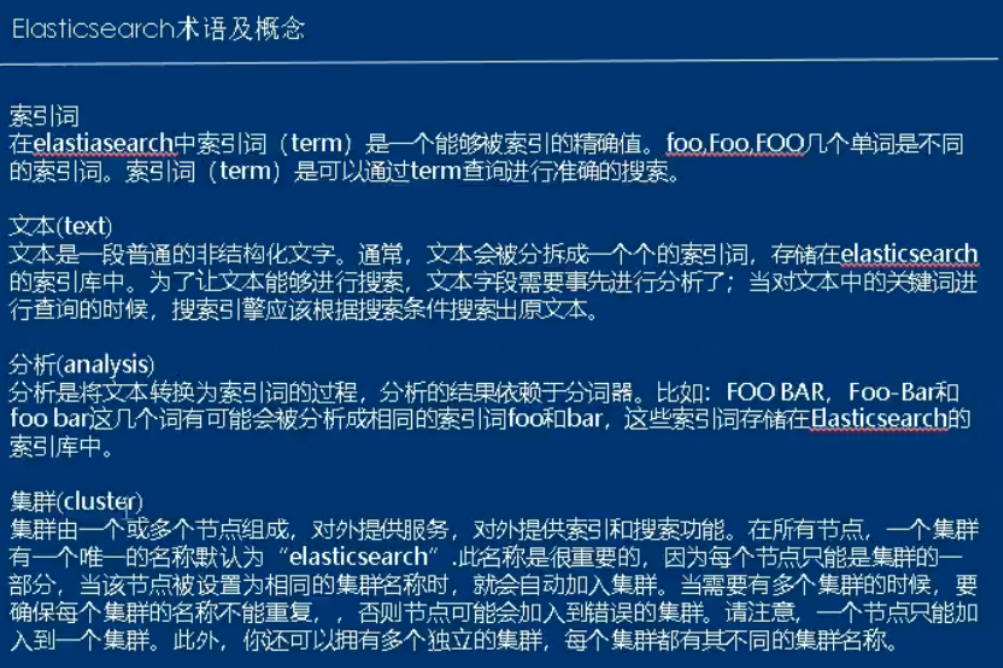
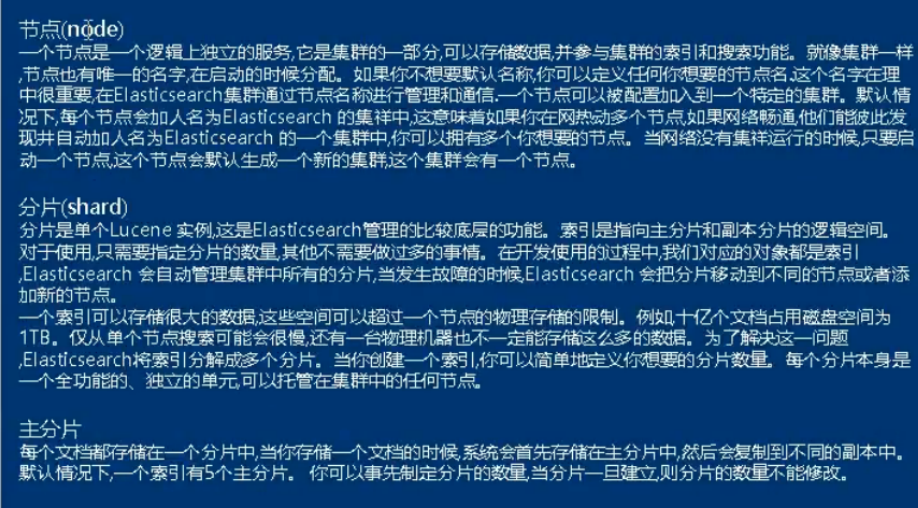
01. Related terms
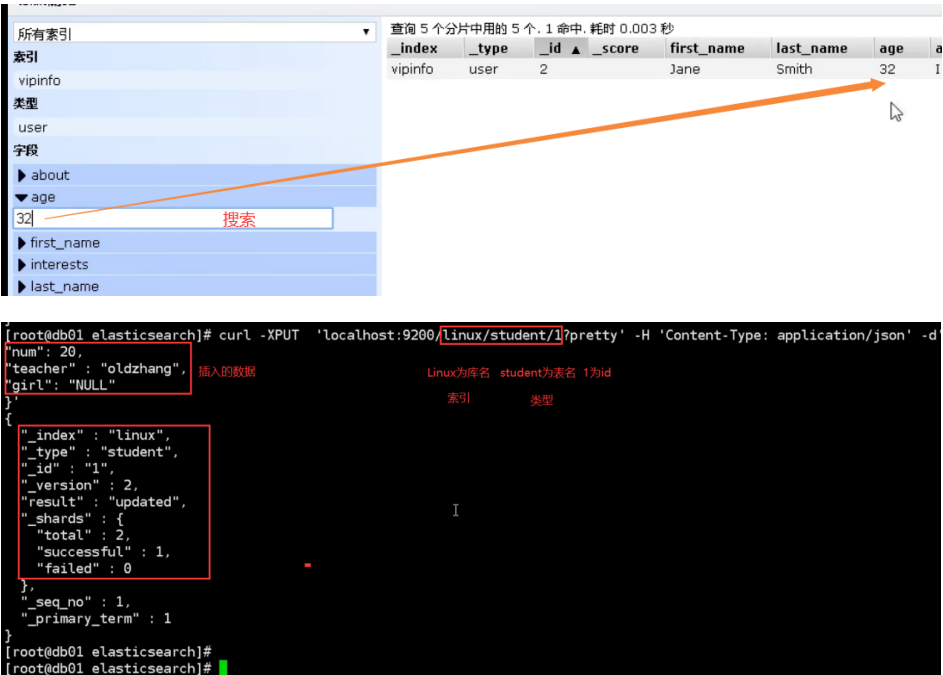
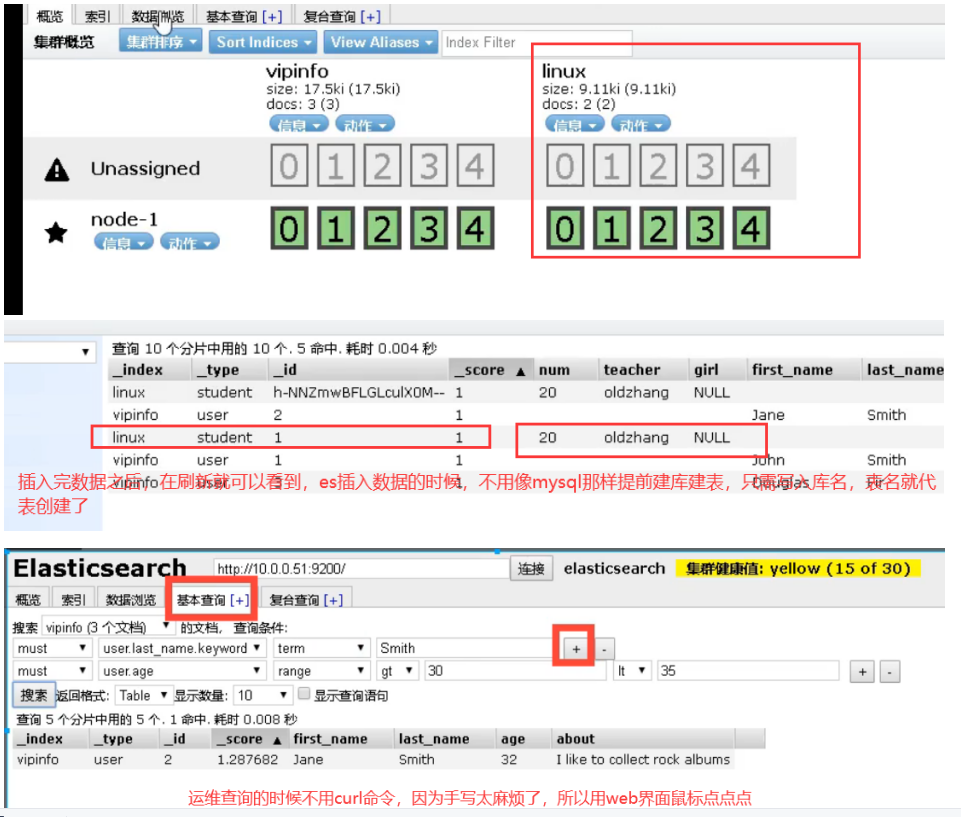
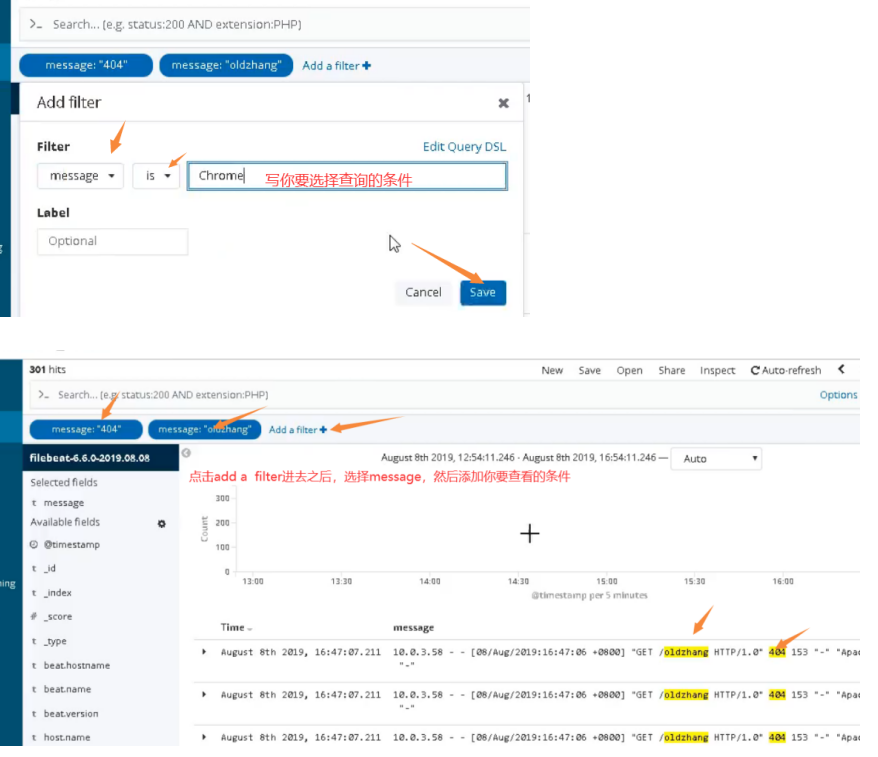
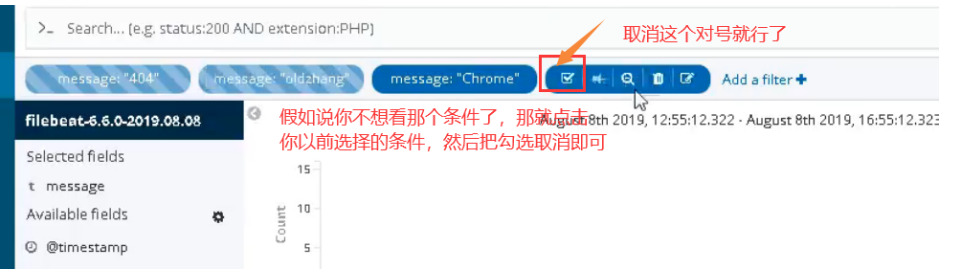
02. Use
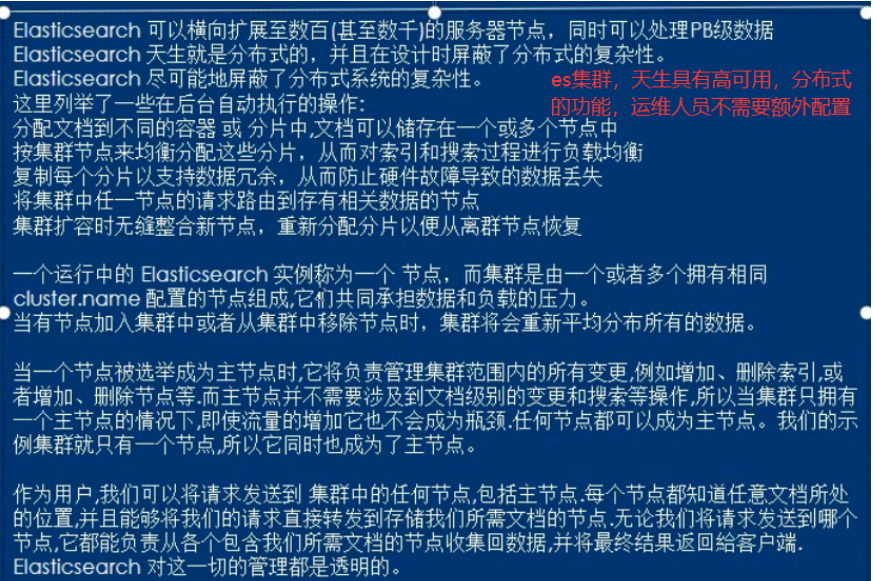
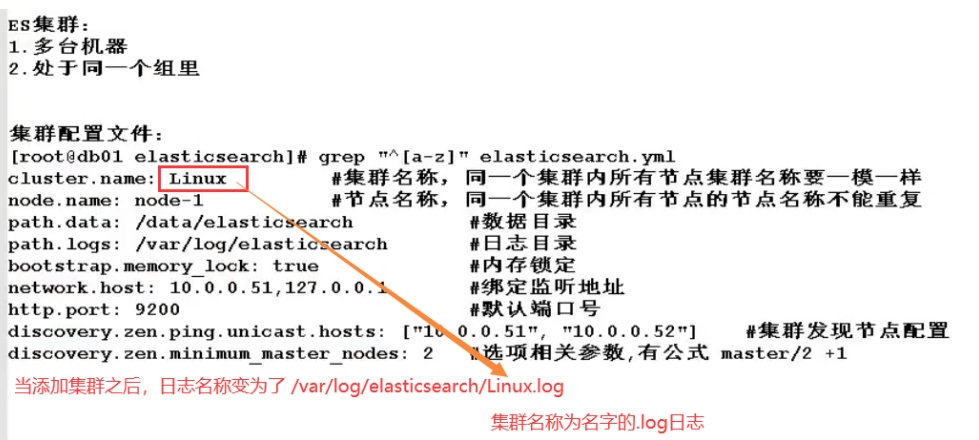
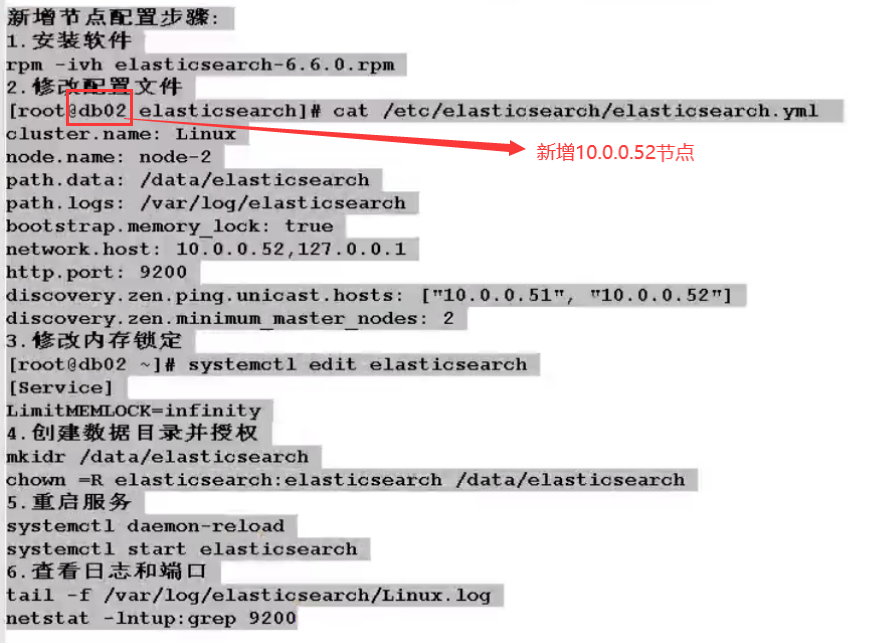
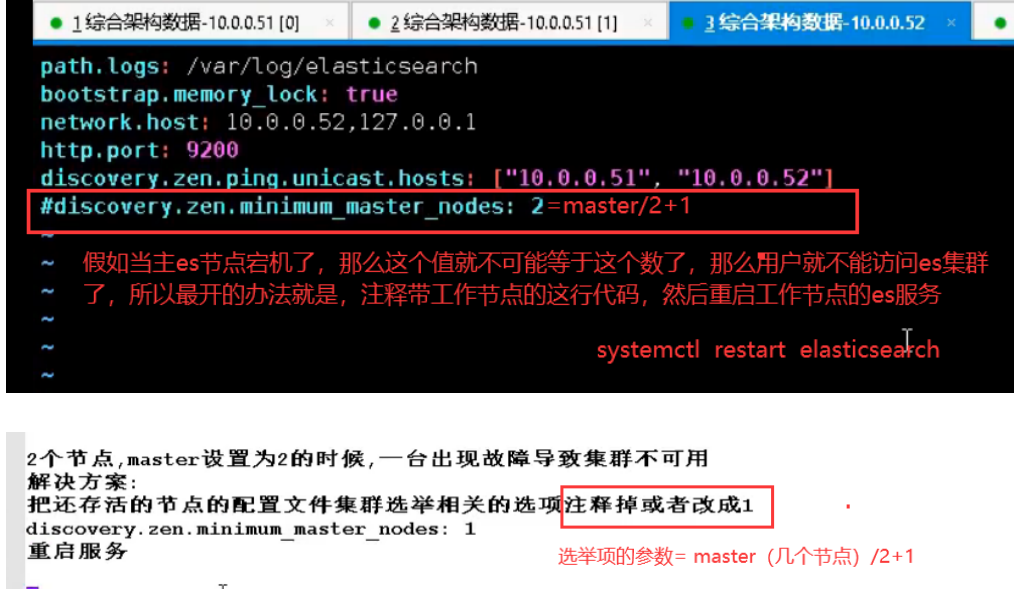
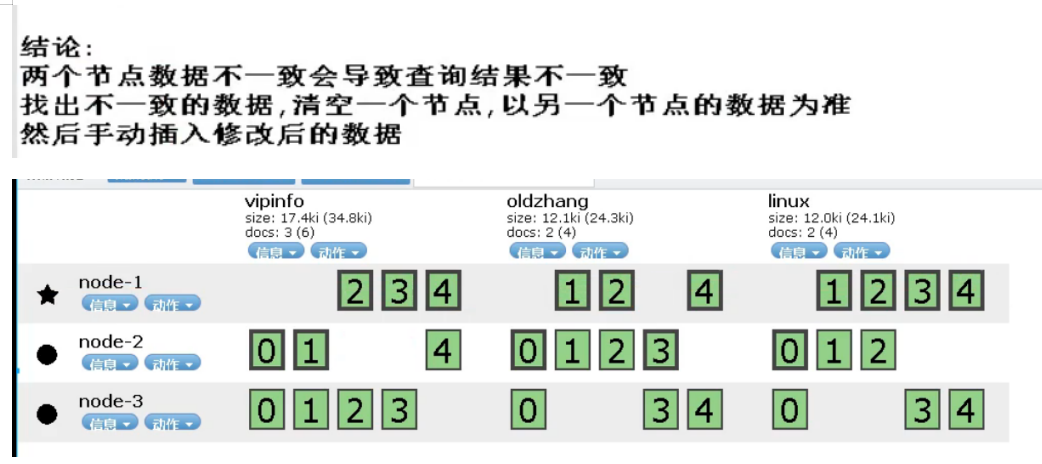
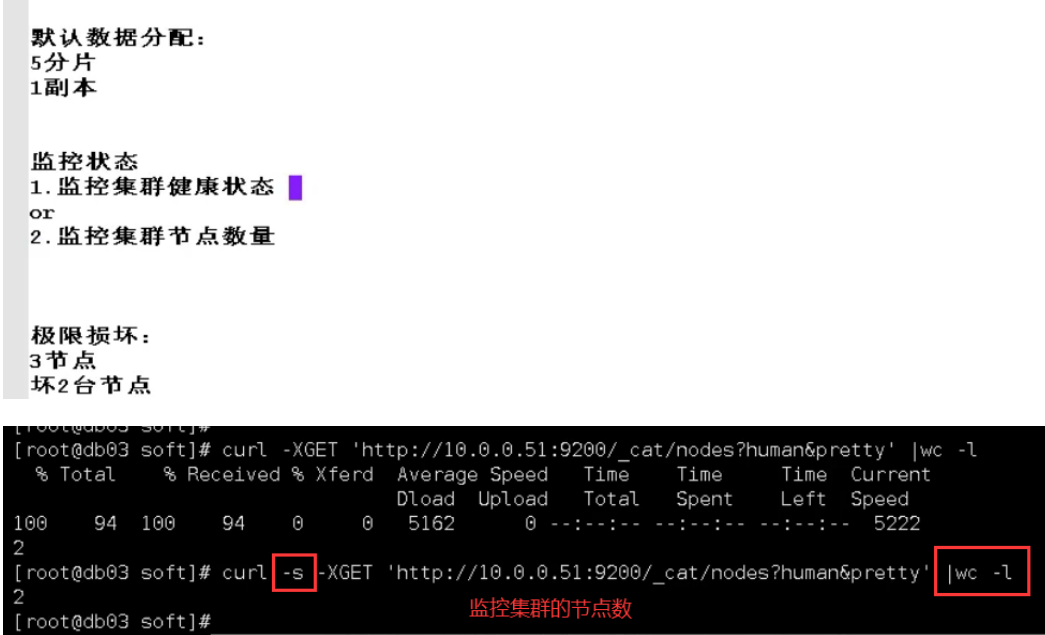
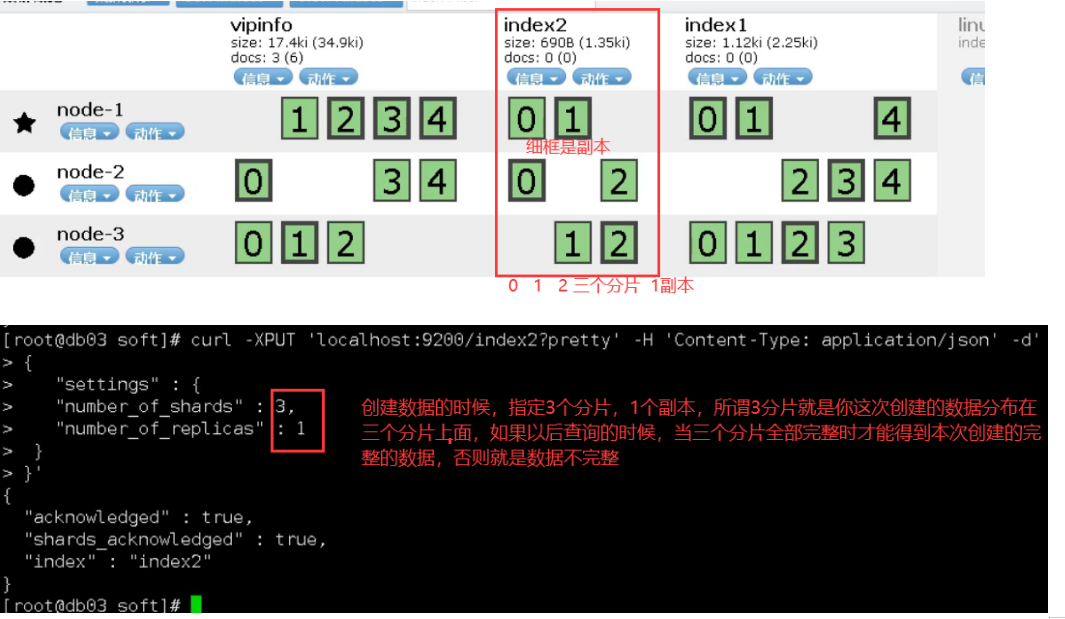
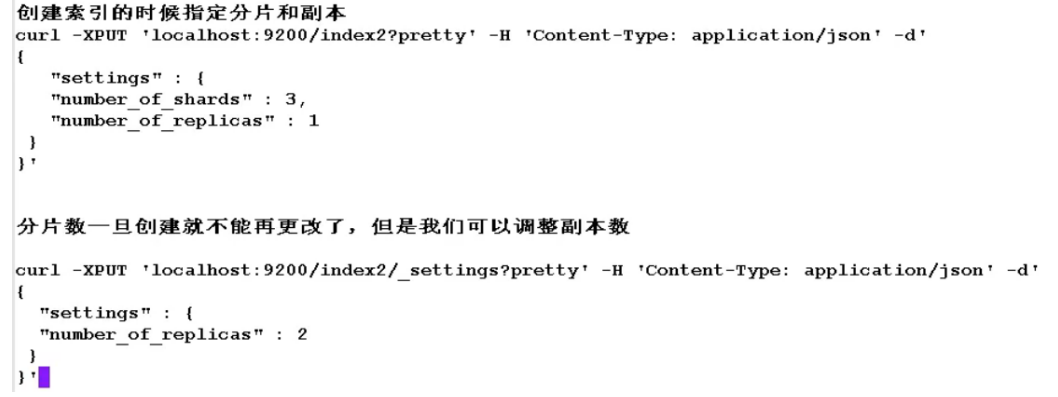
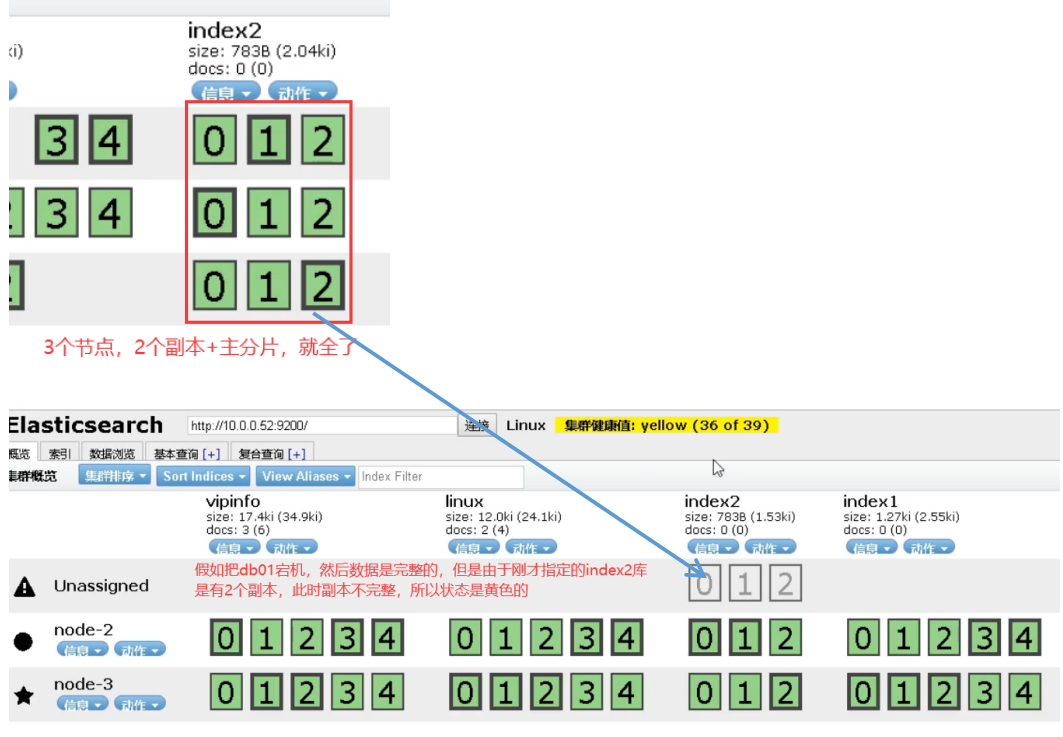
6.es cluster


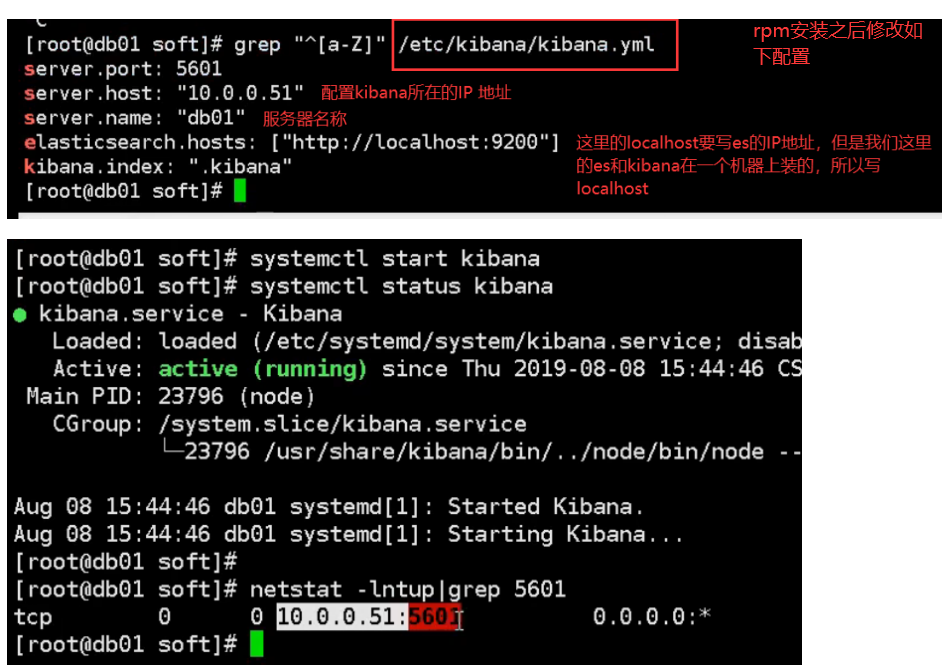
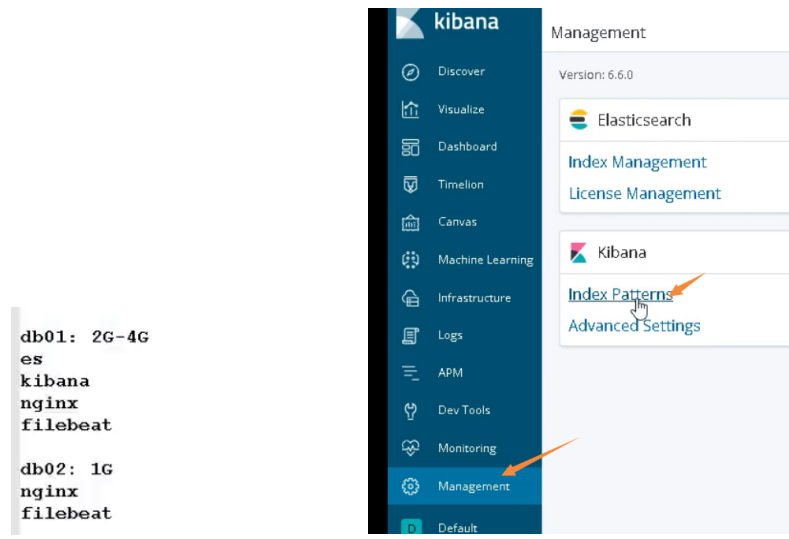
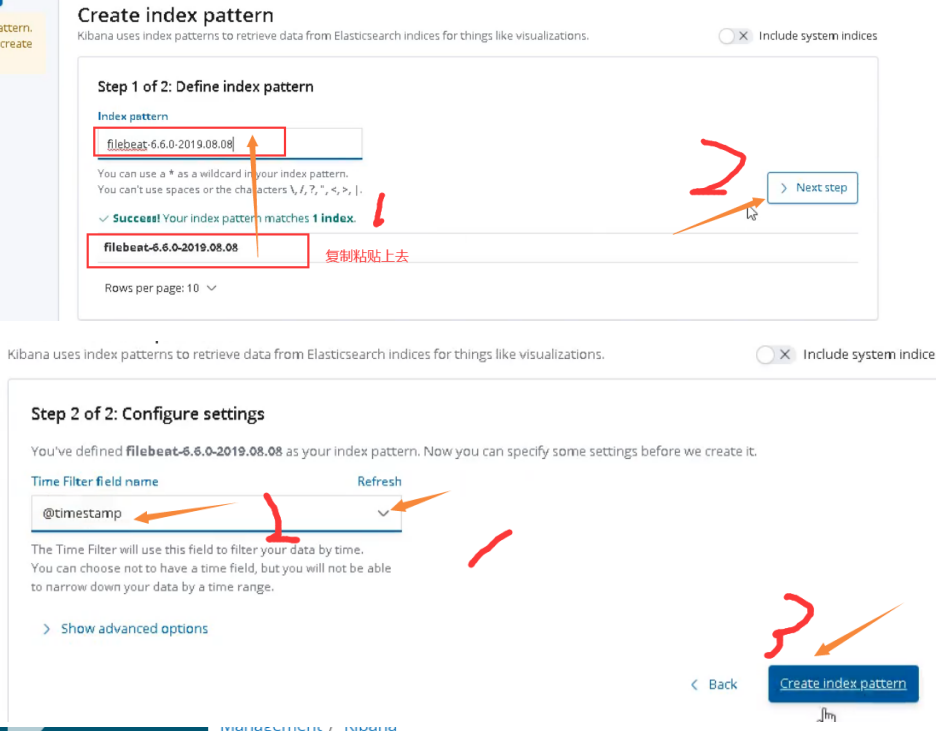
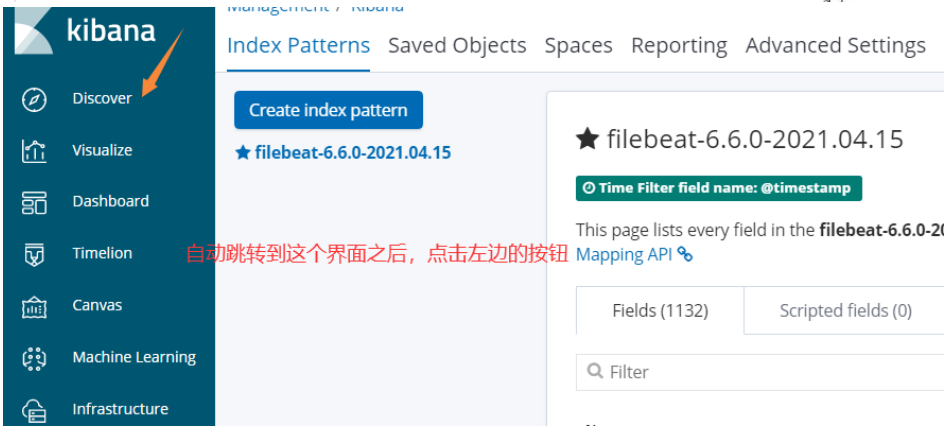
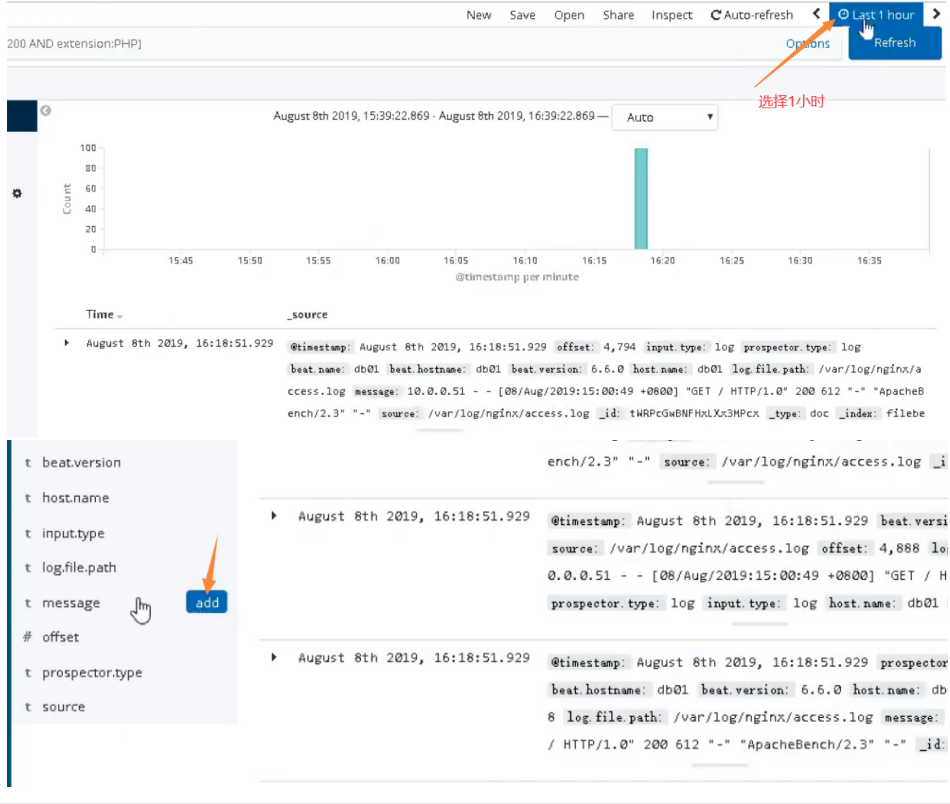
7.kibana installation and deployment
01. Introduction to basic environment
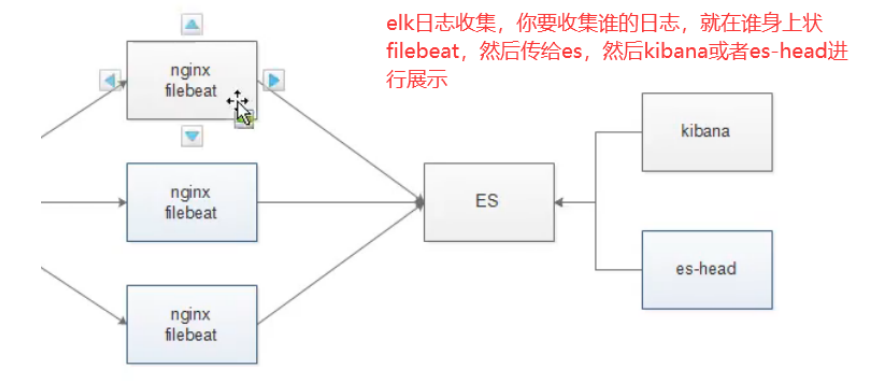
Both filebeat and logstash can collect logs. Here, take filebeat as an example
02. Installation
8. Use filebeat to collect logs
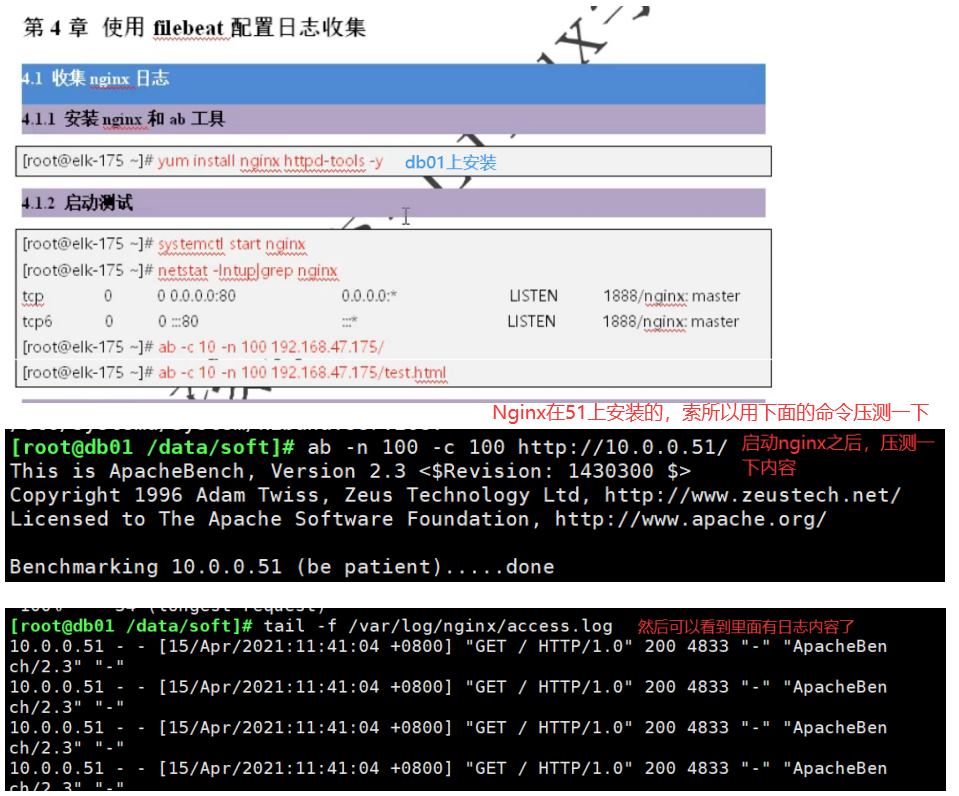
01. Collect Nginx logs (install Nginx)
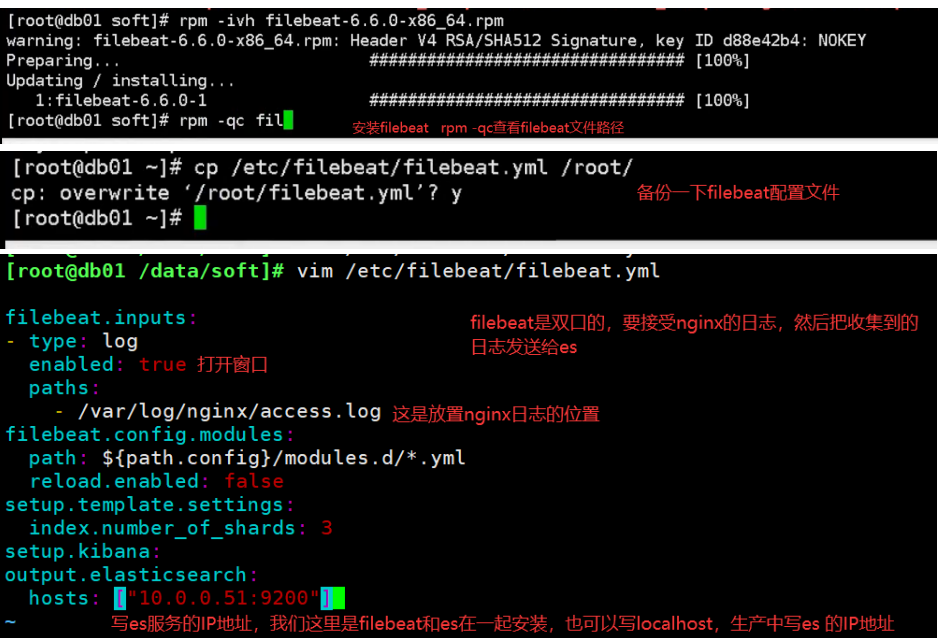
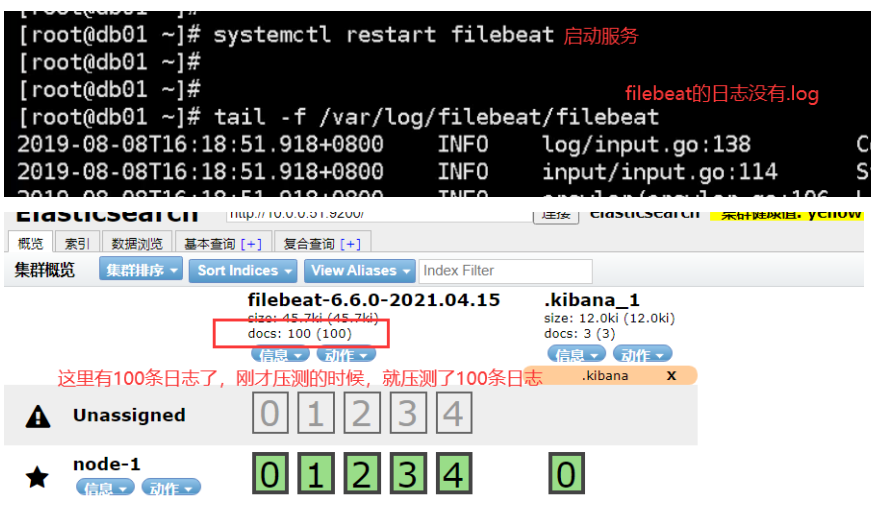
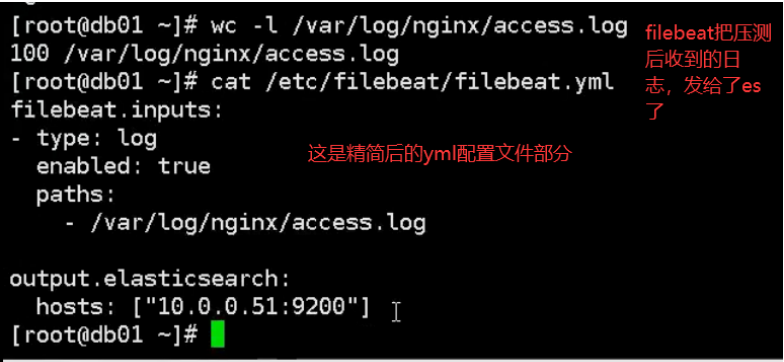
02.filebeat installation and deployment
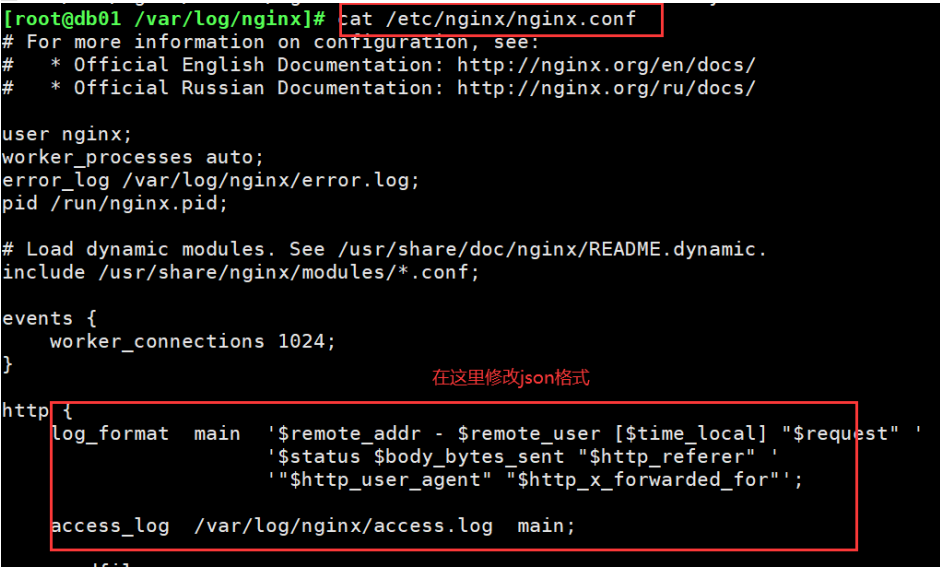
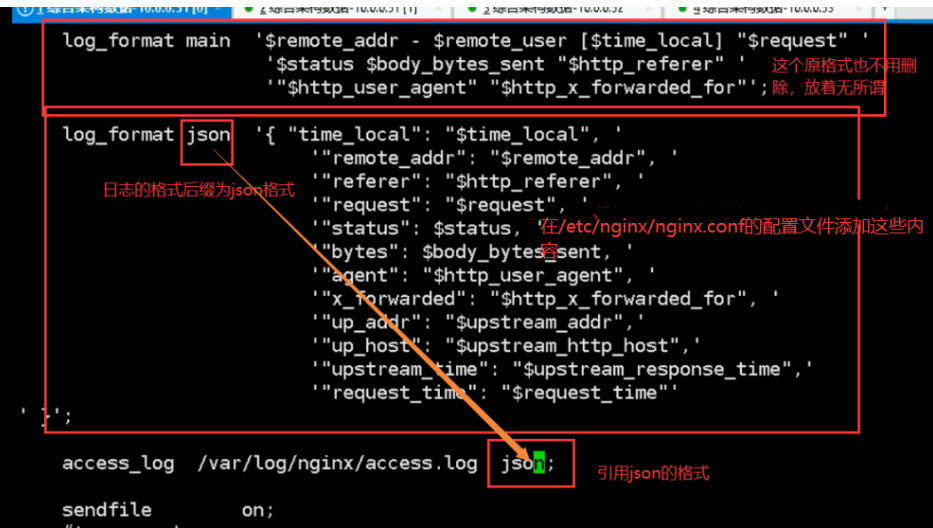
03. Modify nginx log to json format
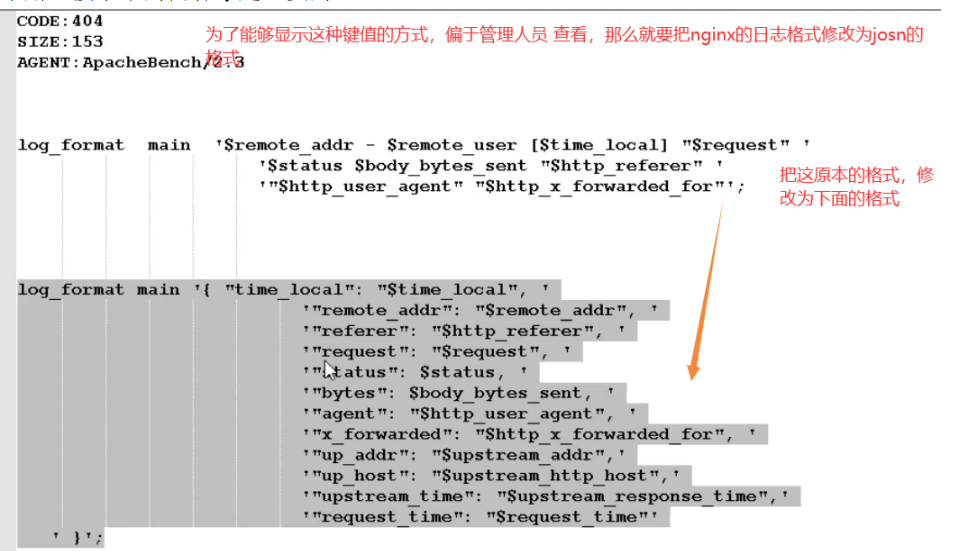
    log_format main '{ "time_local": "$time_local", '
                           '"remote_addr": "$remote_addr", '
                           '"referer": "$http_referer", '
                           '"request": "$request", '
                           '"status": $status, '
                           '"bytes": $body_bytes_sent, '
                           '"agent": "$http_user_agent", '
                           '"x_forwarded": "$http_x_forwarded_for", '
                           '"up_addr": "$upstream_addr",'
                           '"up_host": "$upstream_http_host",'
                           '"upstream_time": "$upstream_response_time",'
                           '"request_time": "$request_time"'
    ' }';
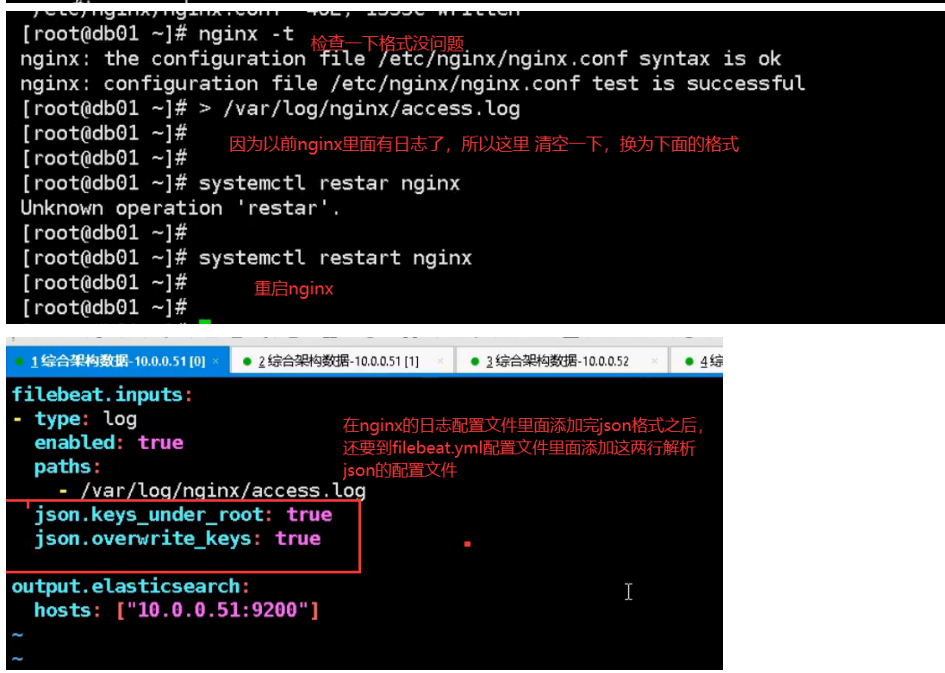
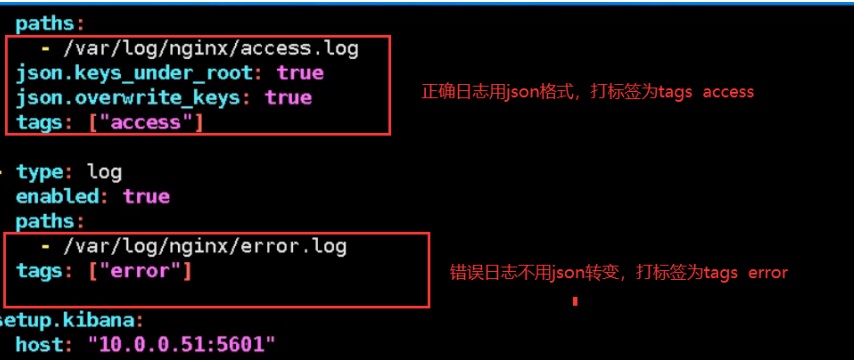
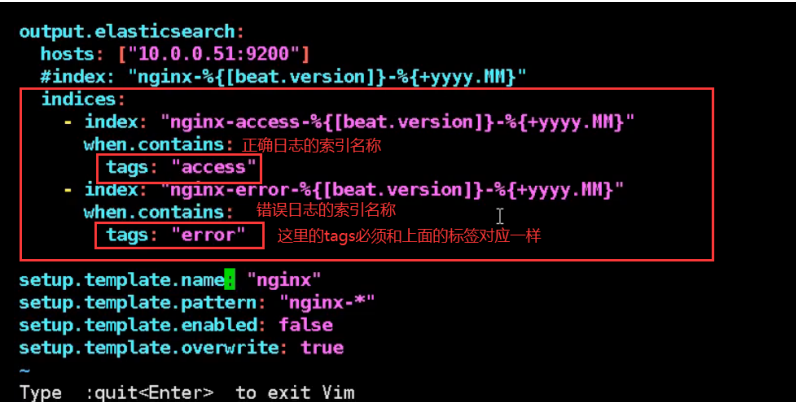
04.filebeat modify configuration file
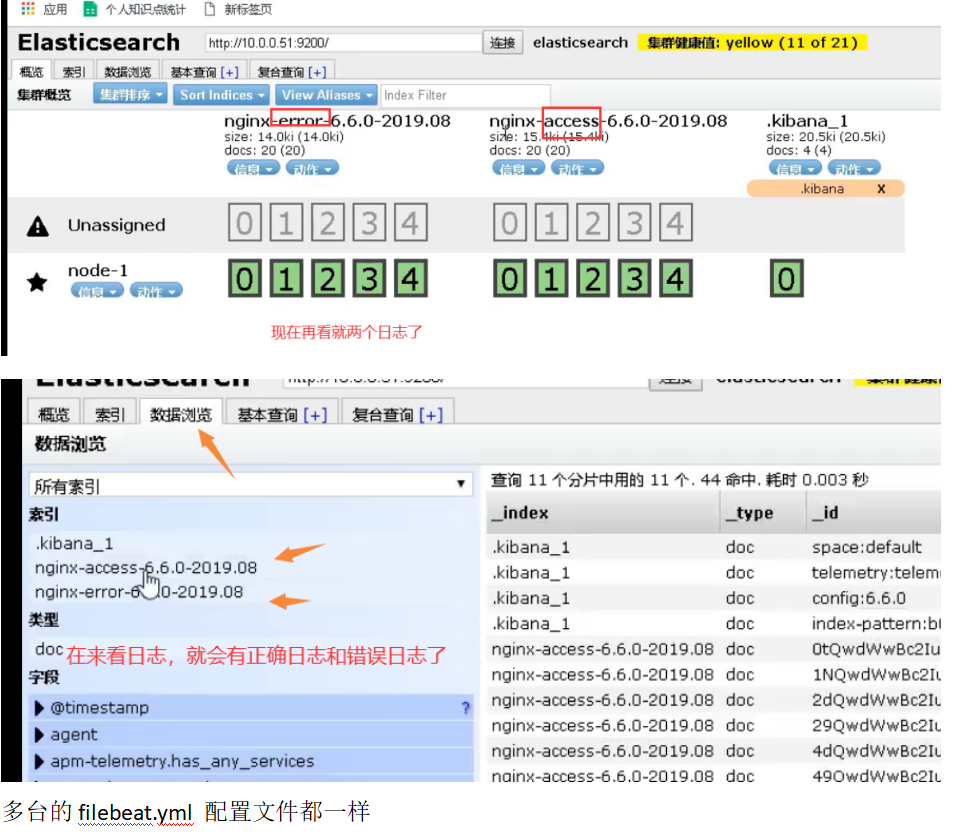
Filebeat Collect data from multiple servers nginx Log, on multiple computers nginx Upper installation filebeat Service, then nginx.conf Configuration and 51 nginx.conf The configuration is the same for each machine filebeat Service configuration file and 51 filebeat.yml The configuration file is the same as the configuration file (later in production) filebeat In the service configuration file IP Address write installed es Server IP Address, because filebeat Will send the collected logs to es (on service)
05. Collect Tomcat logs (install and configure Tomcat)
Step 1: install tomcat:
yum install tomcat tomcat-webapps tomcat-admin-webapps tomcat-docs-webapp tomcat-javadoc -y
Step 2 start Tomcat:
systemctl start tomcat
systemctl status tomcat
lsof -i:8080
06. Configure Tomcat file to json format:
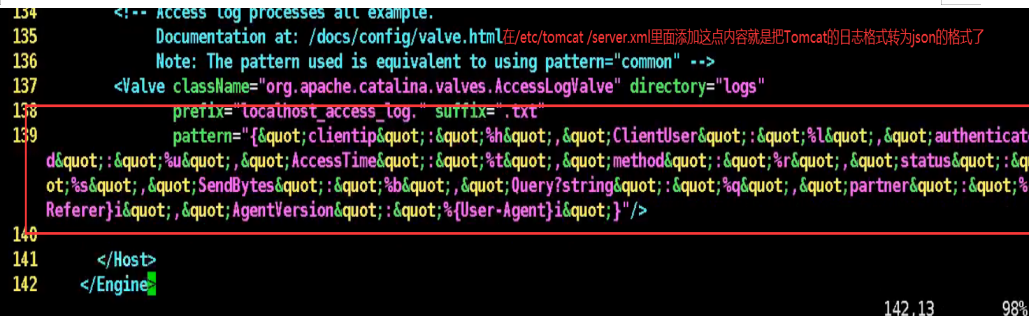
Add these in lines 137 and 138 and 139 of the configuration file
137 <Valve className="org.apache.catalina.valves.AccessLogValve" directory="logs"
138 prefix="localhost_access_log." suffix=".txt"
139 pattern="{"clientip":"%h","ClientUser":"%l","authenticated":"%u","AccessTime":"%t","method":"%r","status":"%s","SendBytes":"%b","Query?string":"%q","partner":"%{Referer}i","AgentVersion":"%{User-Agent}i"}"/>
Step 5: restart to confirm whether the log is in json format
systemctl restart tomcat
tail -f /var/log/tomcat/localhost_access_log.2019-05-13.txt
07.filebeat modify configuration file
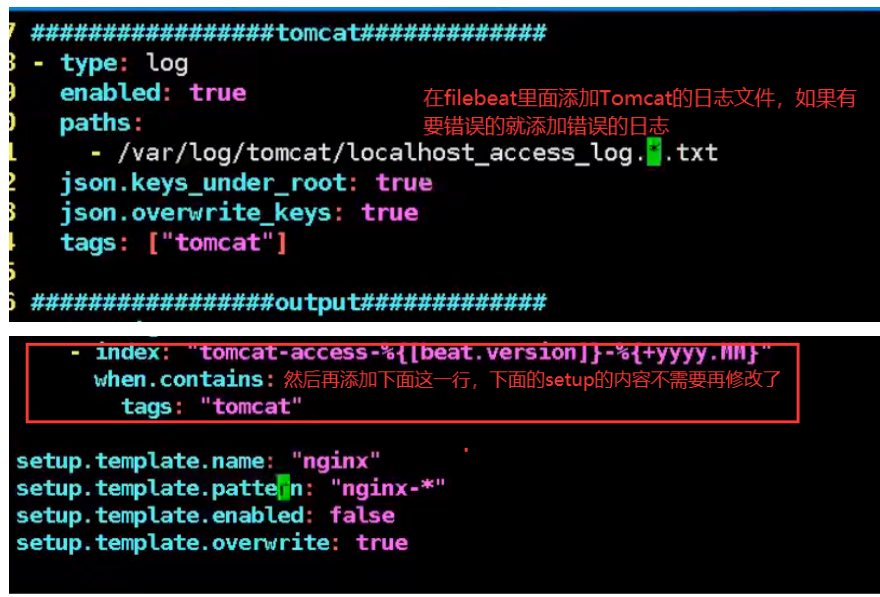
cat /etc/filebeat/filebeat.yml
filebeat.inputs:
- type: log
enabled: true
paths:
- /var/log/tomcat/localhost_access_log*
json.keys_under_root: true
json.overwrite_keys: true
setup.kibana:
host: "10.0.0.51:5601"
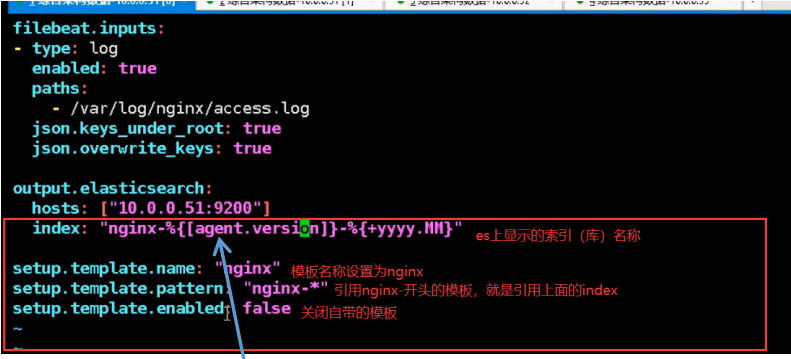
output.elasticsearch:
hosts: ["localhost:9200"]
index: "tomcat-%{[beat.version]}-%{+yyyy.MM.dd}"
setup.template.name: "tomcat"
setup.template.pattern: "tomcatn-*"
setup.template.enabled: false
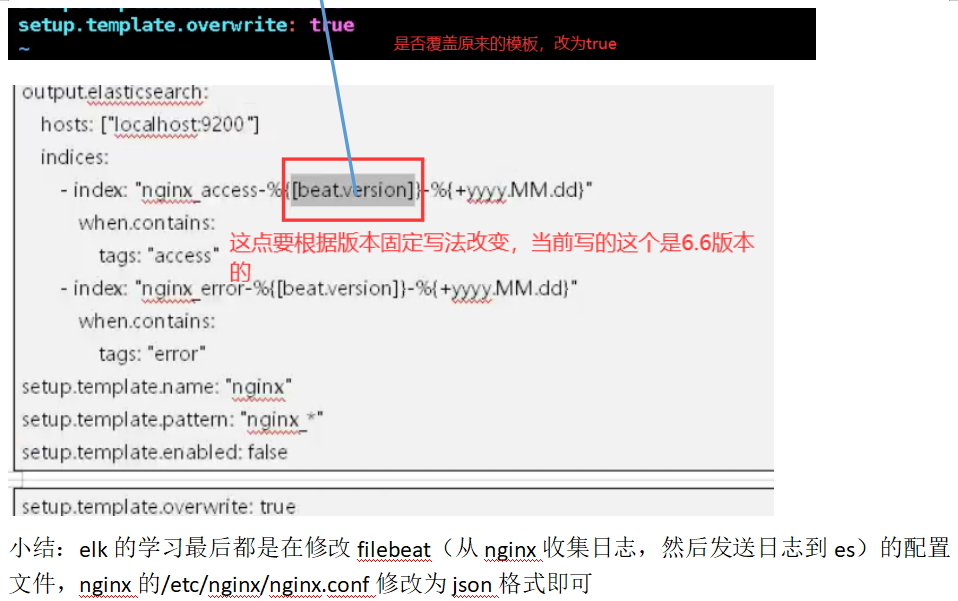
setup.template.overwrite: true
----------Unfinished