Blog: www.jiaopengzi.com
Article directory of jiaoshanzi
Please click to download the attachment
1, Background
A few days ago, a friend was exchanging stock RSI with DAX. Because almost all the algorithms of RSI stock software need all the data from the first day of listing. The influencing factors of the current RSI [close] push forward with time. The earlier the time, the smaller the influencing factors will be (the conclusion will be verified by formula derivation later). Therefore, all the data from the listing to the current period will not be taken when calculating RSI, which will not have an absolute impact on the results.
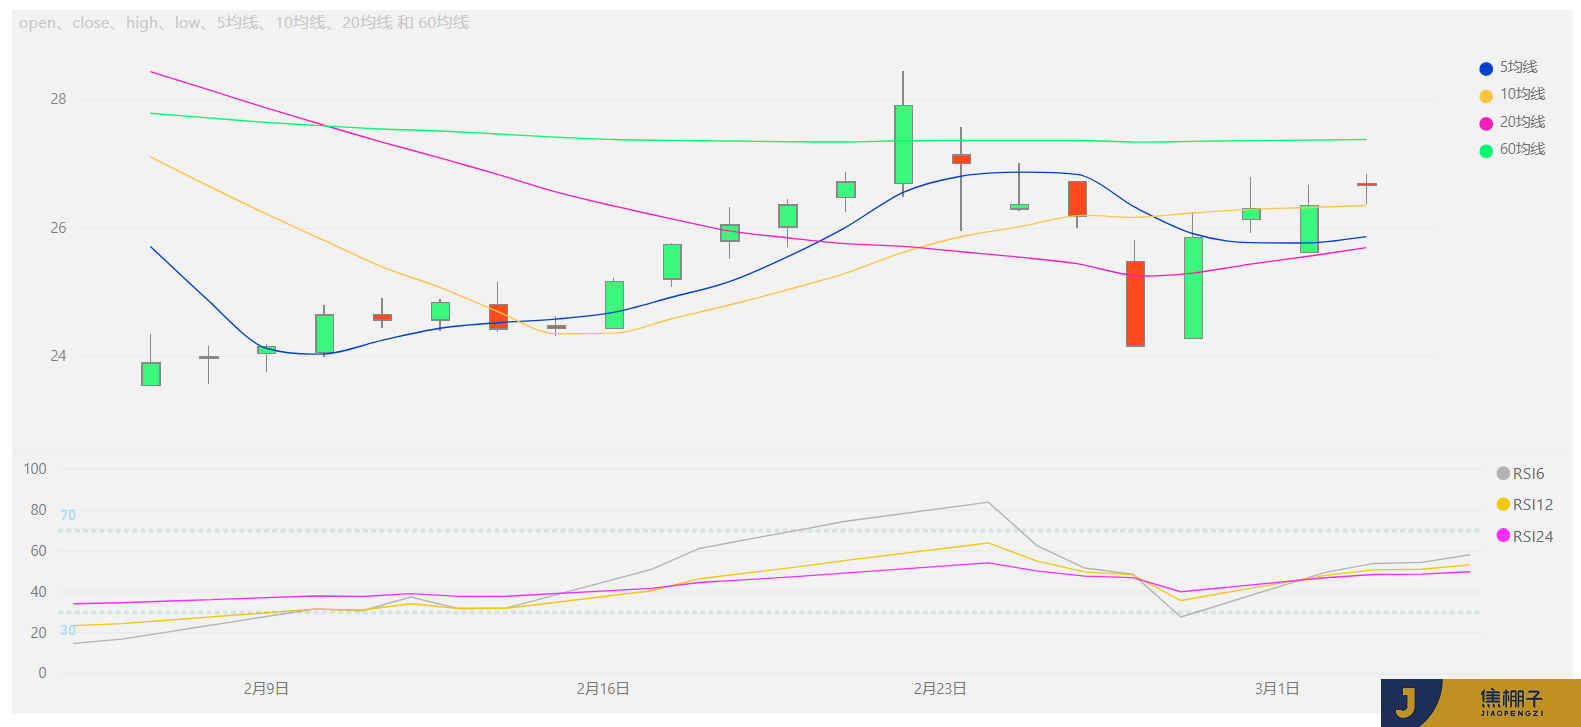
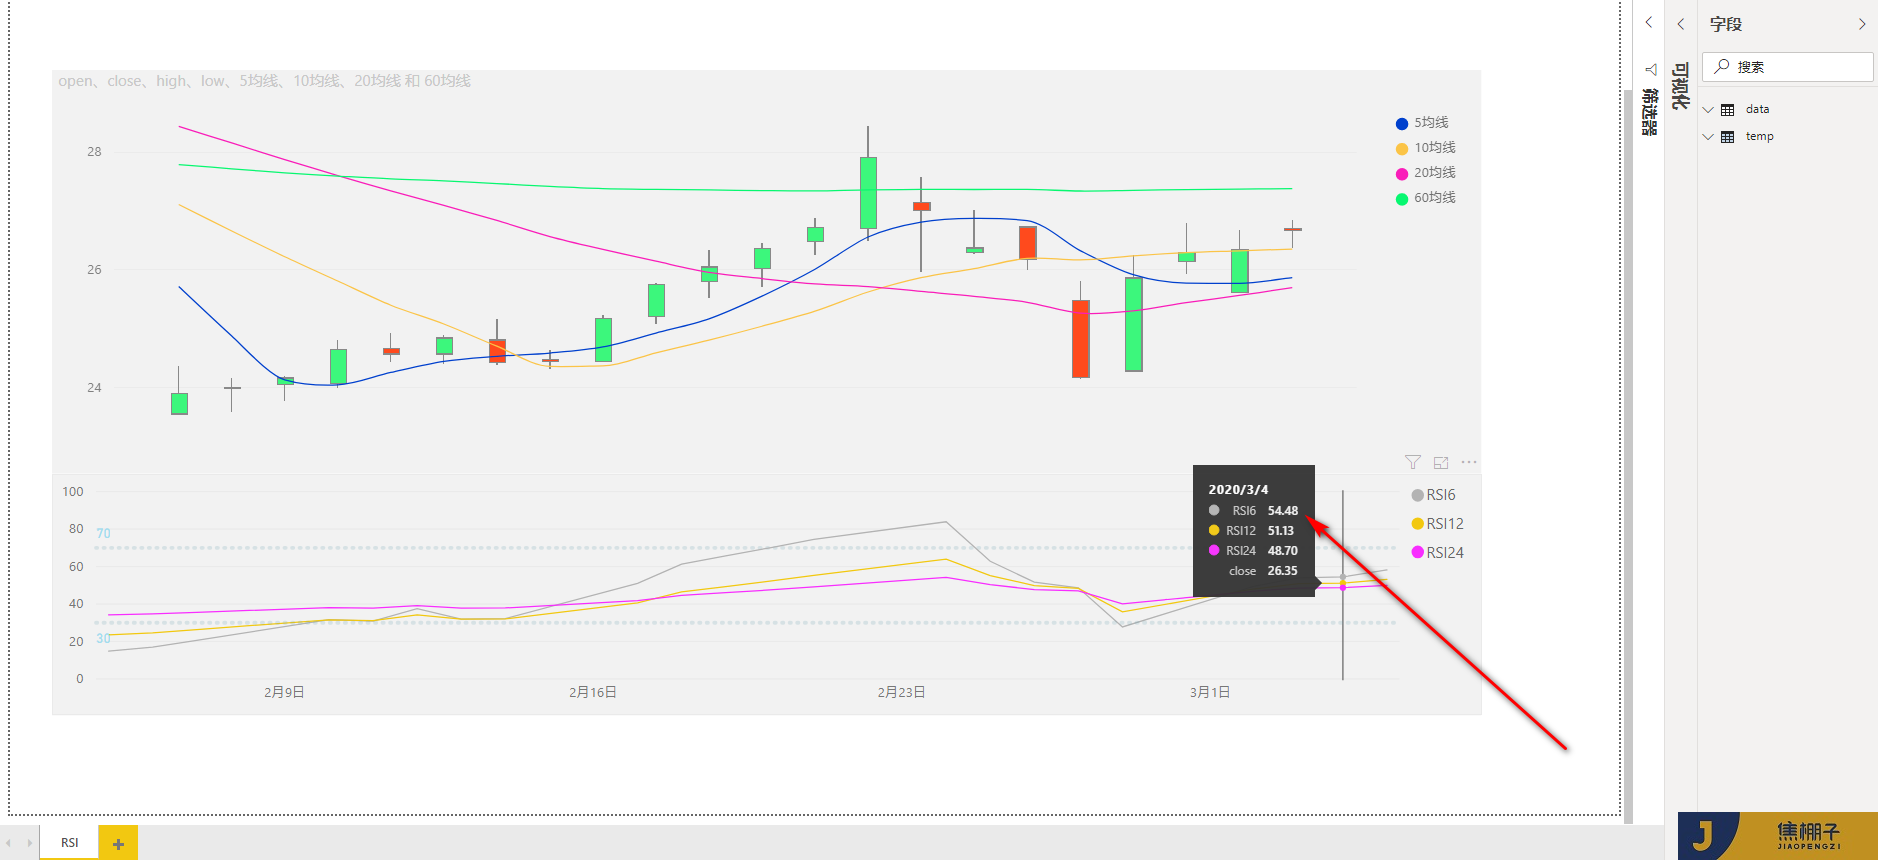
Let's see what the results look like (in fact, it's what stock software looks like)
It should be noted that the author is not a practitioner in the stock industry. The purpose of this case is to share how DAX handles RSI. We do not study how RSI is used.
2, Data source & computing logic
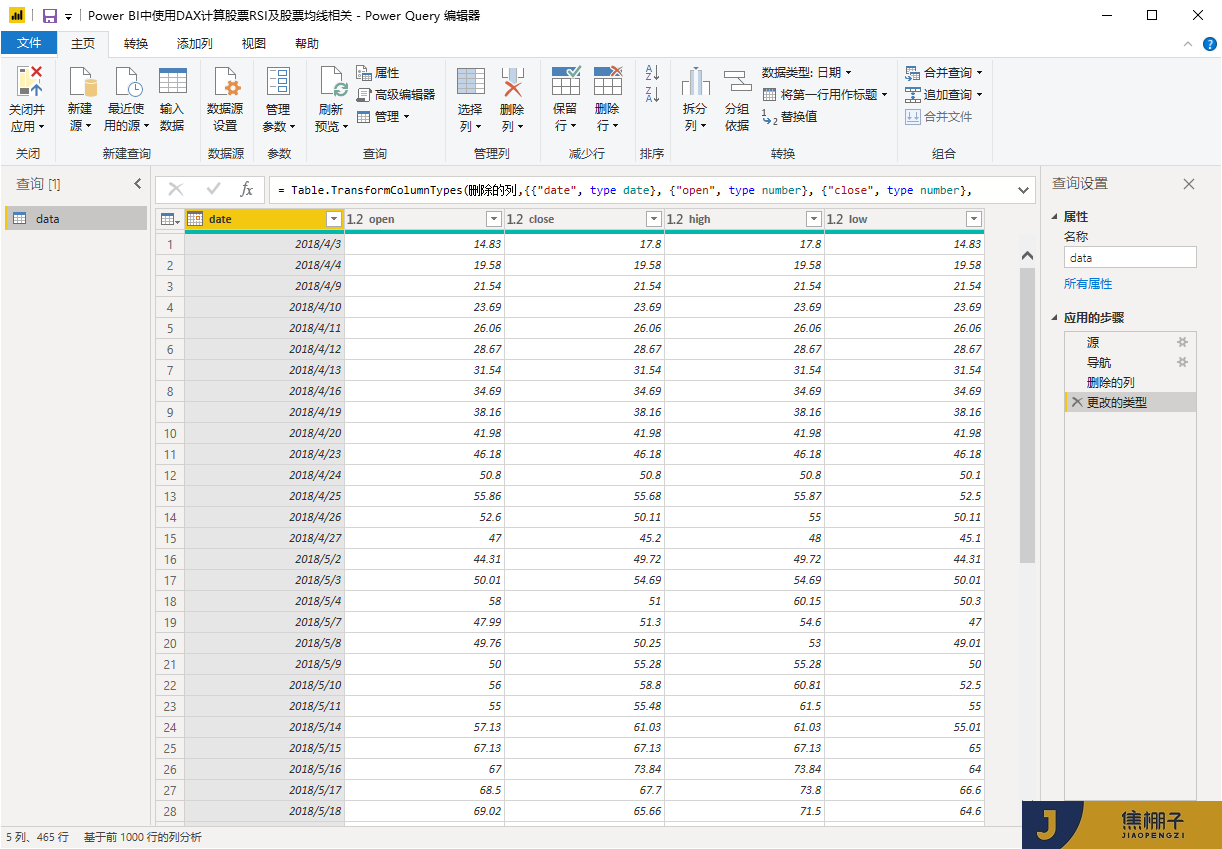
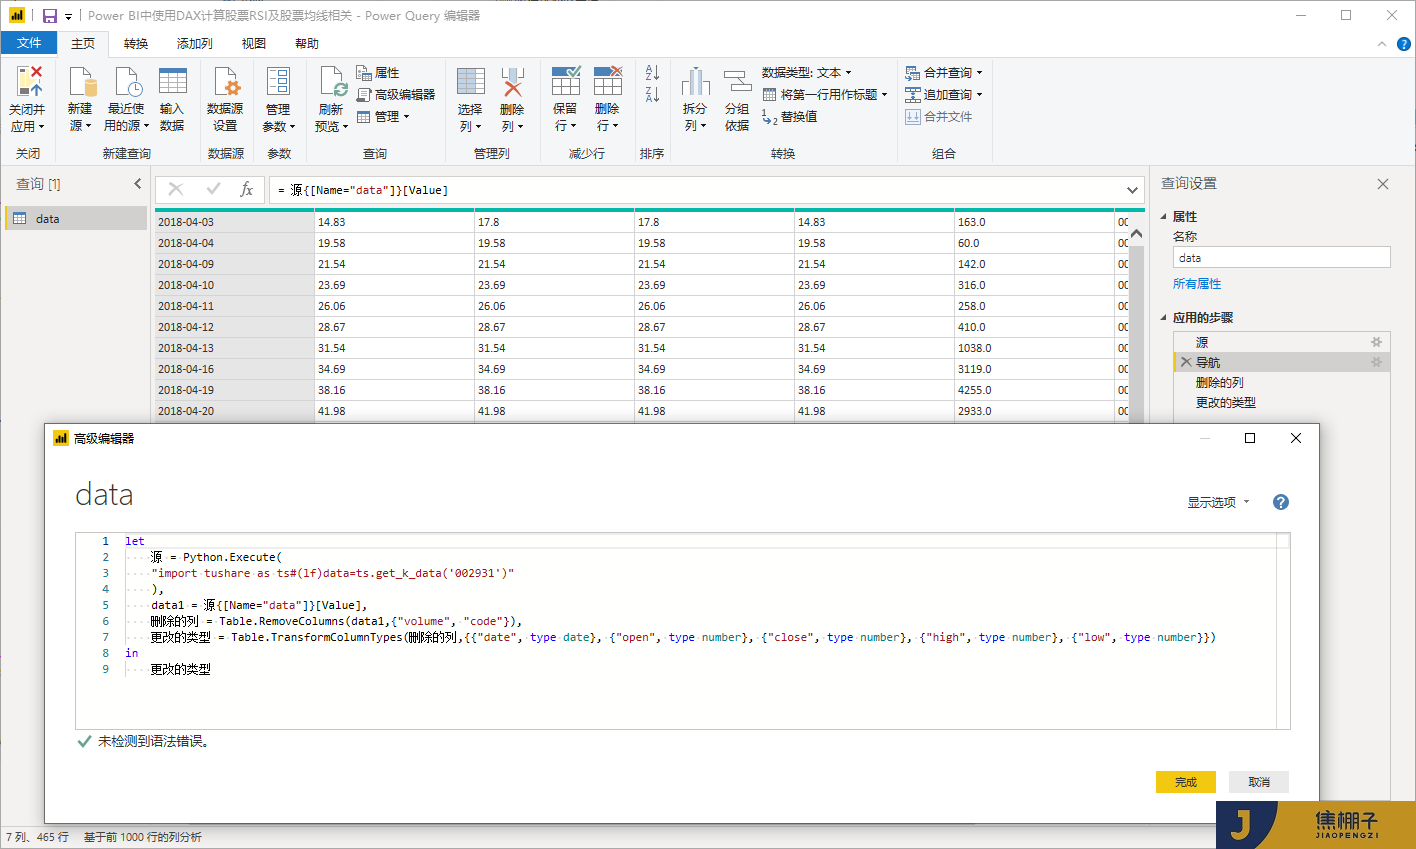
1. Data source
2. RSI calculation formula
reference resources (Wikipedia, if you can't open it, you know):
The deformation is obtained (the author defines the deformation and can understand it, where up means rise, down means fall, ABS means seek absolute value, and all means rise and fall)
3. Computational logic
LC means yesterday [close]
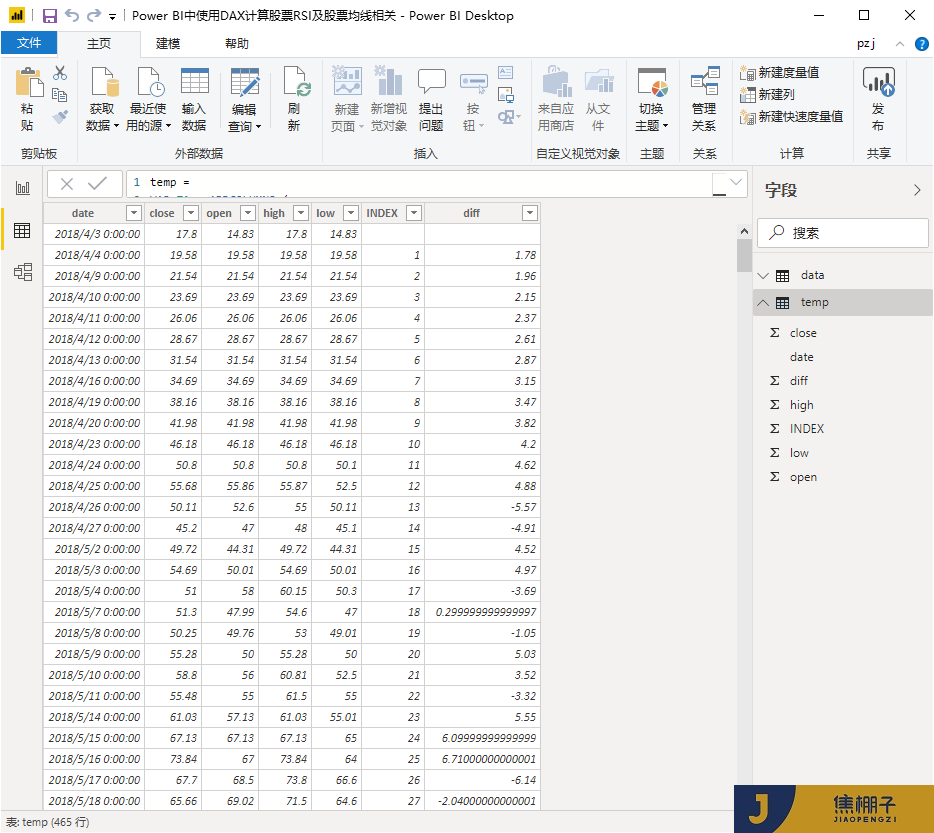
[diff] = close LC in the data source
The 6-day EMA is decomposed and calculated as follows,
1. Y represents the current EMA results,
2. In EMA(up), x = max (close LC, 0),
3. In EMA(down), x = ABS (min (close LC, 0)),
4. In EMA(all), x = ABS (close LC, 0).
temp
The corner mark of X corresponds to [INDEX] in temp table. To calculate EMA results, recursion is needed, but in DAX, the author has not found a way to deal with the problem of recursion.
So we think about it
Bring in the above expressions respectively to obtain: 
Put forward a 1 / 6 and get it
Did you find the law?
Finally, the EMA of k-day index with an average of 6 days is derived
explain
It is not difficult to see that with the increase of k, the earlier the time is  The smaller the value, we bring in k=30,
  =0.00421, which is negligible compared with 5 / 6. Therefore, "the influencing factors [close] of the current RSI will be pushed forward with time, and the earlier the time, the smaller the influencing factors will be (the conclusion will be verified by formula derivation later). Therefore, when calculating RSI, all data from listing to the current period will not be taken, which will not have an absolute impact on the results."
At the same time, we can deduce the n-day exponential average EMA value in k days
The value of EMA can be obtained through the iteration of X, which is easy to handle in DAX.
3, Upper DAX
1. In the above temp table, the intermediate process is easy to observe and is not required in practical application.
temp =
VAR T1 = ADDCOLUMNS (
        ALL ( data ),
        "INDEX",
        VAR DATEAC1 = data[date]
        VAR TP =FILTER ( ALL ( data ), data[date] < DATEAC1 )
        RETURN
            COUNTROWS ( TP )
    )
VAR T2 =ADDCOLUMNS (
        T1,
        "diff",
        VAR I = [INDEX] - 1
        VAR PRE =CALCULATE ( SUM ( data[close] ), FILTER ( T1, [INDEX] = I ) )
        RETURN IF ( PRE = BLANK (), BLANK (), data[close] - PRE )
    )
return
T2
2. RSI6, where N=12 and N=24, RSI12 and RS24 can be obtained.
RSI6 =
VAR N = 6
VAR BN = ( N - 1 ) / N
VAR DATE_SELECT = MAX ( 'data'[date] )
VAR T1 = ADDCOLUMNS (
        ALL ( data ),
        "INDEX",
        VAR DATEAC1 = data[date]
        VAR TP =FILTER ( ALL ( data ), data[date] < DATEAC1 )
        RETURN
            COUNTROWS ( TP )
    )
VAR T2 =ADDCOLUMNS (
        T1,
        "diff",
        VAR I = [INDEX] - 1
        VAR PRE =CALCULATE ( SUM ( data[close] ), FILTER ( T1, [INDEX] = I ) )
        RETURN IF ( PRE = BLANK (), BLANK (), data[close] - PRE )
    )
VAR T3 =FILTER ( T2, [date] <= DATE_SELECT )
VAR K =COUNTROWS ( T3 ) - 1
VAR T4 =ADDCOLUMNS (
        T3,
        "UP",
        VAR X = [diff]
        VAR K1 = [INDEX]
        RETURN
            IF ( X > 0 || X = BLANK (), POWER ( BN, K - K1 ) * X, BLANK () ),
        "ALL",
        VAR X = [diff]
        VAR K1 = [INDEX]
        RETURN
            IF ( X = BLANK (), BLANK (), POWER ( BN, K - K1 ) * ABS ( X ) )
    )
RETURN
    ROUND(DIVIDE ( SUMX ( T4, [UP] ), SUMX ( T4, [ALL] ) ) * 100,2)
3. 5 moving average, where n=10, 20, 60 can get 10 moving average, 20 moving average and 60 moving average.
5 average =
var n=5
var date1=max('data'[date])
var date2=filter(all('data'[date]),'data'[date]<=date1)
var T=topn(n,date2,'data'[date],DESC)
VAR R=CALCULATE(SUM(data[close]),T)
RETURN
DIVIDE( R,COUNTROWS(T))
4, Summary
1. There is basically no difficulty in DAX, that is, iteration;
2. It is mainly that the data formula can be easily solved after derivation;
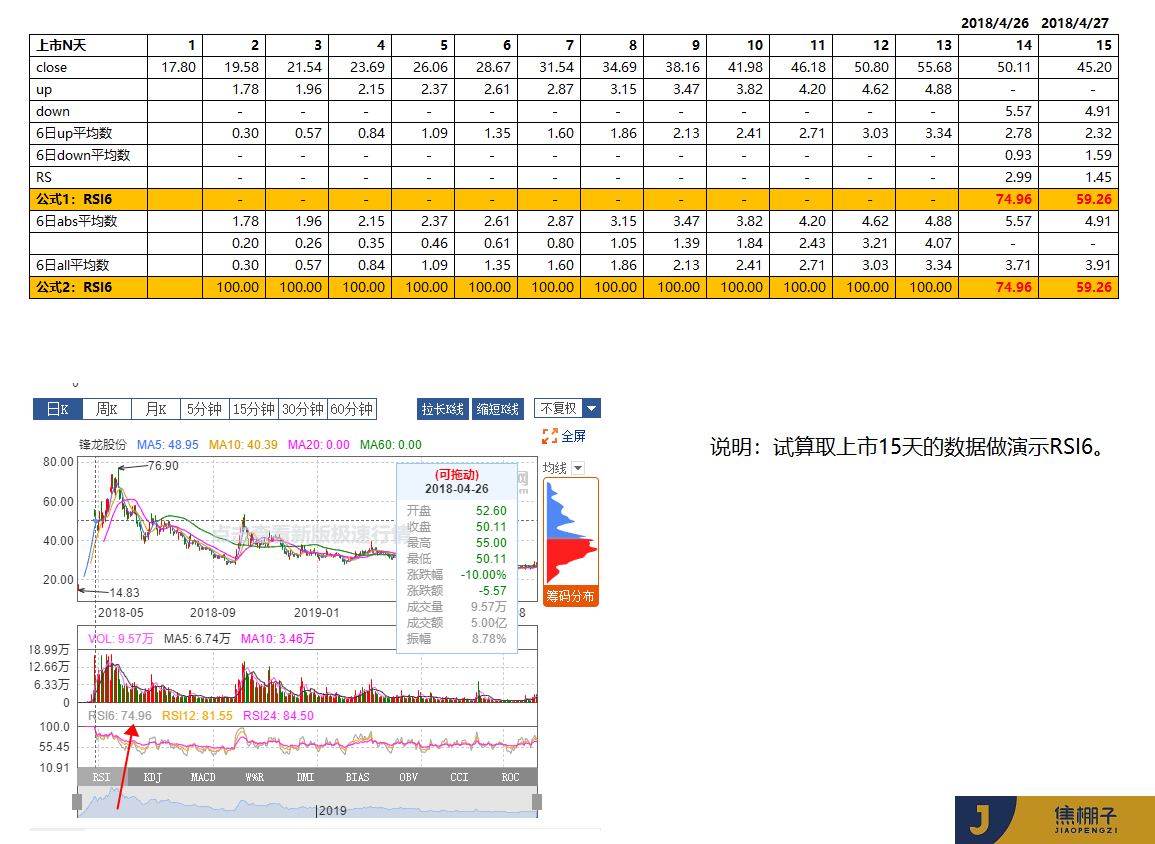
3. In order to better understand, we do a logical decomposition of excel
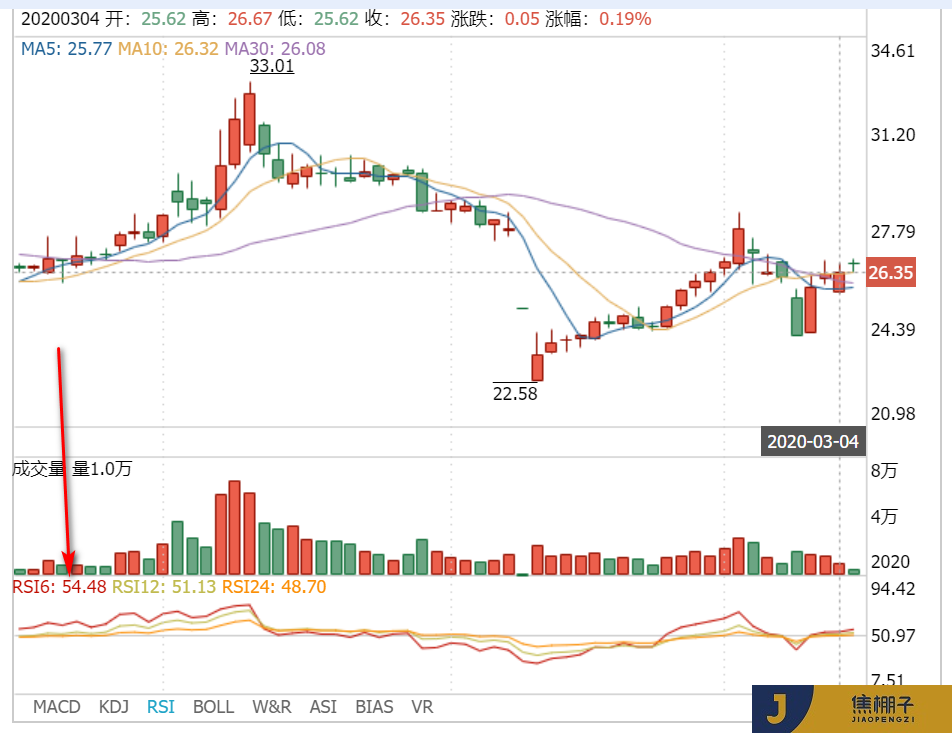
4. Finally, our calculation results are verified
RSI results calculated by DAX
Stock software results (there is a little difference in RSI24, mainly due to the software start days or decimal retention, which does not affect the use.)
5. The data source is obtained through the tushare package of python, and the pbix file can be used as a query tool.
by coke shed
