The last issue of the 21 day good habit activity is over. Although the activity is over, I will continue to share my learning success and problems solved in learning. Today, I review the knowledge of HTML. In fact, I didn't learn much about graphic drawing before, and the teacher didn't talk about it. I felt very interesting, so I went to the library to borrow a front-end book
HTML5 drawing graphics
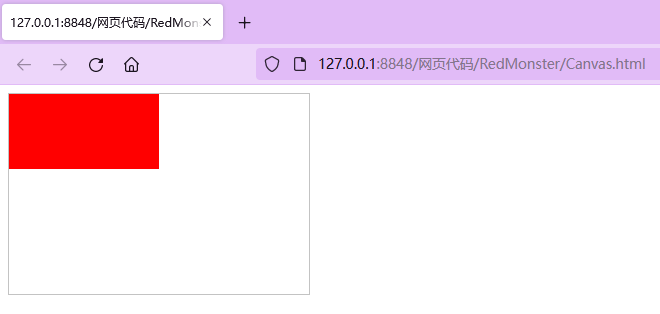
1 add Cavans element
<body>
		<!-- Canvas Common forms in web pages -->
		<canvas id="myCanvas" width="300" height="200" style="border: 1px solid #c3c3c3;">
			Your browser does not support the canvas element.
		</canvas>
		<script type="text/javascript">
			var c=document.getElementById("myCanvas"); //Get canvas element with id
			var cxt=c.getContext("2d");  //Create context object
			/* Draw the graph. The following two lines of code draw a red rectangle */
			cxt.fillStyle="#Ff0000 "; / / the fillStyle function colors it red
			cxt.fillRect(0,0,150,75);  //The fillRect function specifies the shape, position, and size

		</script>
	</body>
Run in browser
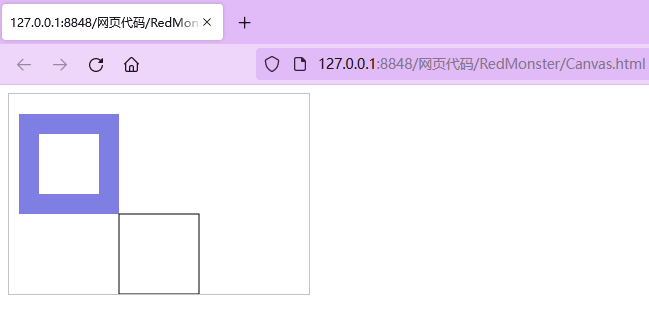
2. Draw rectangle
| function | function |
| fillRect | Draw a rectangle with no border and only fill color. There are 4 parameters. The first two represent the coordinate position of the upper left corner, the third parameter is length and the fourth parameter is height |
| strockRect | Draw a rectangle with borders. The four parameters are the same as above |
| clearRect | Clear a rectangular area without any lines. The four parameters are explained above |
<body>
		<!-- Canvas Common forms in web pages -->
		<canvas id="myCanvas" width="300" height="200" style="border: 1px solid #c3c3c3;">
			Your browser does not support the canvas element.
		</canvas>
		<script type="text/javascript">
			var c=document.getElementById("myCanvas"); //Get canvas element with id
			var cxt=c.getContext("2d");  //To create a context object, it is mandatory to support 2D
			/* Draw the graph. The following two lines of code draw a red rectangle */
			cxt.fillStyle="rgb(0,0,200,0.5)";  //The fillStyle function dyes it blue with a transparency of 50%
			cxt.fillRect(10,20,100,100);  //The fillRect function specifies the shape, position, and size

			cxt.strokeRect(110,120,80,80)
			cxt.clearRect(30,40,60,60)
		</script>
</body>
Run in browser
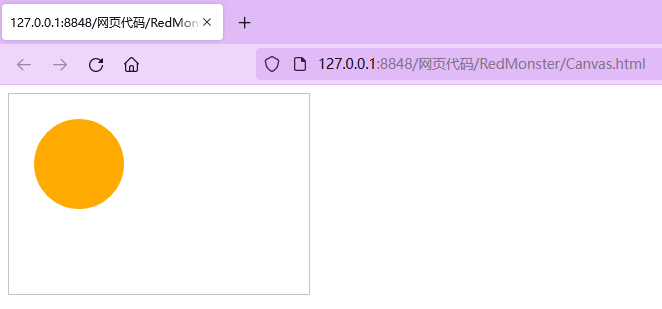
3. Draw a circle
| function | function |
| beginPath() | Start drawing path |
| arc(x,y,radious,startAngle, endAngle,anticlockwise) | (x,y) defines the origin of the circle, the radial radius startAngle,endAngle is radian, and anticlockwise defines the direction of drawing the circle. The value is true or false |
| closePath() | End path drawing |
| fill() | Fill |
| strock | Method to draw a border |
<body>
		<!-- Canvas Common forms in web pages -->
		<canvas id="myCanvas" width="300" height="200" style="border: 1px solid #c3c3c3;">
			Your browser does not support the canvas element.
		</canvas>
		<script type="text/javascript">
			var c=document.getElementById("myCanvas"); //Get canvas element with id
			var cxt=c.getContext("2d");  //To create a context object, it is mandatory to support 2D
			/* Draw the graph. The following two lines of code draw a red rectangle */
			cxt.fillStyle="#FFaa00";
			cxt.beginPath();  //Turn on drawing path
			cxt.arc(70,70,45,0,Math.PI*2,true)  //Draw circle
			cxt.closePath();   //Turn off drawing path
			cxt.fill();  //fill
		</script>
	</body>
Run in browser
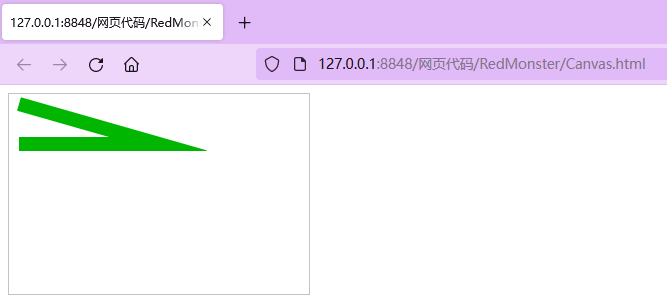
4. Draw a straight line
| function | function |
| moveTo(x,y) | Do not draw, just move the current position to the new coordinates (x,y) as the starting point of the line |
| lineTo(x,y) | Draw a line to the specified target coordinates (x,y) and draw a straight line between the two coordinates. At present, the graph is not drawn because strockStyle and fill are not called |
| strockeStyle | Specifies the line color |
| lineWidth | Set line thickness |
<body>
		<!-- Canvas Common forms in web pages -->
		<canvas id="myCanvas" width="300" height="200" style="border: 1px solid #c3c3c3;">
			Your browser does not support the canvas element.
		</canvas>
		<script type="text/javascript">
			var c=document.getElementById("myCanvas"); //Get canvas element with id
			var cxt=c.getContext("2d");  //To create a context object, it is mandatory to support 2D
			/* Draw the graph. The following two lines of code draw a red rectangle */

			cxt.beginPath();  //Turn on drawing path
			cxt.strokeStyle="rgb(0,182,0)";
			cxt.moveTo(10,10);
			cxt.lineTo(150,50);
			cxt.lineTo(10,50);
			cxt.lineWidth=14;
			cxt.stroke();
			cxt.closePath();   //Turn off drawing path

		</script>
	</body>
Run in browser
5. Use bezierCurveTo to draw Bezier curve
Method bezierCurveTo specific format
bezierCurveTo( cpX1 , cpY1 , cpX2 , cpY2 , x , y )
cpX1,cpY1: coordinates of the control point associated with the starting point (current position) of the curve
cpX2,cpY2: coordinates of control points associated with curve end points
x. Y: coordinates of curve end point
<!DOCTYPE html>
<html>
	<head>
		<meta charset="utf-8">
		<title></title>
		<script type="text/javascript">
			function draw(id)
			{
				var canvas=document.getElementById(id); //Get canvas element with id
				if(canvas==null)
				return false;
				var context=canvas.getContext('2d');
				context.fillStyle="#eeeeff";
				context.fillRect(0,0,400,300);  //Draw a rectangle

				var n=0;
				var dx=150;
				var dy=150;
				var s=100;

				context.beginPath();
				context.globalCompositeOperation='and';
				context.fillStyle='rgb(100,255,100)';
				context.strokeStyle="rgb(0,0,100)";
				var x=Math.sin(0);
				var y=Math.cos(0);
				var dig=Math.PI/15*11;
				for(var i=0,i<30;i++)
				{
					var x=Math.sin(i*dig);
					var y=Math.cos(i*dig);

					context.bezierCurveTo(dx+x*s,dy+y*s-100,dx+x*s+100,dy+y*s,dx+x*s,dy+y*s);
				}
				context.closePath();
				context.fill();
				context.stroke();
			}
		</script>
	</head>
	<body onload="draw('canvas');">
		<canvas id="canvas" width="400" height="300" />
	</body>
</html>
There was a problem: running in the browser had no effect
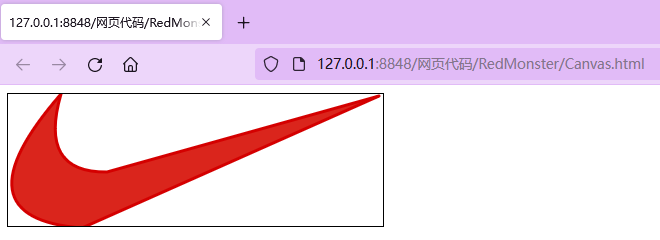
Comprehensive example 1 - drawing trademarks
<!DOCTYPE html>
<html>
	<head>
		<meta charset="utf-8">
		<title></title>
		<script type="text/javascript">
			function drawAdidas()
			{   //Gets the canvas element and its drawing context
				var canvas=document.getElementById('adidas');
				var context=canvas.getContext('2d');
				//Save current drawing state
				context.save();
				//Start drawing the checked outline
				context.beginPath();
				context.moveTo(53,0);
				//Draw the upper part of the curve. The first group of coordinates is the control point to determine the curvature of the curve, and the second group of coordinates is the end point
				context.quadraticCurveTo(30,79,99,78);
				context.lineTo(371,2);
				context.lineTo(74,134);
				context.quadraticCurveTo(-55,124,53,0);
				//Red fill
				context.fillStyle="#da251c";
				context.fill();
				//3 pixel stroke
				context.lineWidth=3;
				//Smooth joints
				context.lineJoin='round';
				context.strokeStyle="#d40000";
				context.stroke();
				//Restore the original drawing state
				context.restore();
			}
			window.addEventListener("load",drawAdidas,true);
		</script>
	</head>
	<body >
		<canvas id="adidas" width="375px" height="132px" style="border: 1px solid #000;">
			</canvas>
	</body>
</html>
Run in browser
Comprehensive example 2 - drawing clock
<!DOCTYPE html>
<html>
	<head>
		<meta charset="utf-8">
		<title></title>
	</head>
	<body>
		<canvas id="canvas" width="200" height="200" style="border: 1px solid #000;">
			Your browser does not support Canvas
		</canvas>

		<script type="text/javascript" language="JavaScript" charset="UTF-8">
			var canvas = document.getElementById('canvas');
			var ctx = canvas.getContext('2d');

			if (ctx) {
				var timerId;
				var frameRate = 60;

				function canvObject() {
					this.x = 0;
					this.y = 0;
					this.rotation = 0;
					this.broderWidth = 2;
					this.borderColor = '#000000';
					this.fill = false;
					this.fillColor = '#ff0000';
					this.update = function() {
						if (!this.ctx)
							throw new Error('You did not specify ctx object');
						var ctx = this.ctx;
						ctx.save();
						ctx.lineWidth = this.broderWidth;
						ctx.strokeStyle = this.borderColor;
						ctx.fillStyle = this.fillColor;
						ctx.translate(this.x, this.y);
						if (this.rotation)
							ctx.rotate(this.rotation * Math.PI / 180);
						if (this.draw) this.draw(ctx);
						if (this.fill) ctx.fill();
						ctx.stroke();
						ctx.restore();
					}
				};

				function Line() {};
				Line.prototype = new canvObject();
				Line.prototype.fill = false;
				Line.prototype.start = [0, 0];
				Line.prototype.end = [5, 5];
				Line.prototype.draw = function(ctx) {
					ctx.beginPath();
					ctx.moveTo.apply(ctx, this.start);
					ctx.lineTo.apply(ctx, this.end);
					ctx.closePath();
				};

				function Circle() {};
				Circle.prototype = new canvObject();
				Circle.prototype.draw = function(ctx) {
					ctx.beginPath();
					ctx.arc(0, 0, this.radius, 0, 2 * Math.PI, true);
					ctx.closePath();
				};

				var circle = new Circle();
				circle.ctx = ctx;
				circle.x = 100;
				circle.y = 100;
				circle.radius = 90;
				circle.fill = true;
				circle.borderWidth = 6;
				circle.fillColor = '#fff';

				var hour = new Line();
				hour.ctx = ctx;
				hour.x = 100;
				hour.y = 100;
				hour.borderColor = '#ffff00';
				hour.borderWidth = 10;
				hour.rotation = 0;
				hour.start = [0, 20];
				hour.end = [0, -50];

				var minute = new Line();
				minute.ctx = ctx;
				minute.x = 100;
				minute.y = 100;
				minute.borderColor = '#ff557f';
				minute.borderWidth = 7;
				minute.rotation = 0;
				minute.start = [0, 20];
				minute.end = [0, -70];

				var seconds = new Line();
				seconds.ctx = ctx;
				seconds.x = 100;
				seconds.y = 100;
				seconds.borderColor = '#55aaff';
				seconds.borderWidth = 4;
				seconds.rotation = 0;
				seconds.start = [0, 20];
				seconds.end = [0, -80];

				var center = new Circle();
				center.ctx = ctx;
				center.x = 100;
				center.y = 100;
				center.radius = 5;
				center.fill = true;
				center.fillColor = '#ffff00';

				for (var i = 0, ls = [], cache; i < 12; i++){
					cache = ls[i] = new Line();
				cache.ctx = ctx;
				cache.x = 100;
				cache.y = 100;
				cache.borderColor = '#ffff00';
				cache.borderWidth = 2;
				cache.rotation = i * 30;
				cache.start = [0, -70];
				cache.end = [0, -80];
			}

			timerId = setInterval(function()) {
			ctx.clearColor(0, 0, 200, 200);

			ctx.fillStyle = 'green';
			ctx.fillRect(0, 0, 200, 200)

			//Disk table
			circle.update();
			//scale
			for (var i = 0; cache = ls[i++];) cache.update();

			hour.rotation = (new Date()).getHours() * 30;
			hour.update();

			minute.rotation = (new Date()).getMinutes() * 6;
			minute.update();

			seconds.rotation = (new Date()).getSeconds() * 6;
			seconds.update();

			center.update();
			}, (1000 / frameRate) | 0);
			}
			else {
				alert('Your browser does not support Canvas No hair preview clock!');
			}
		</script>
	</body>
</html>
No dynamic clock during operation?