logistic regression
What is logical regression
Logical regression is used to deal with different classification problems. The purpose here is to predict which group the currently observed objects belong to. It will give you a discrete binary output. A simple example is to judge whether a person will vote in the upcoming election.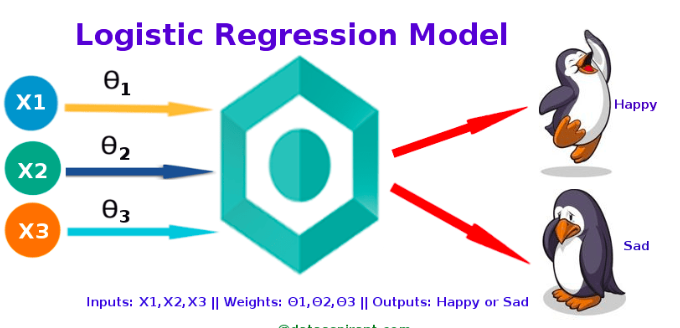
How to work
Logistic regression uses the basis function (Sigmoid function) to measure the relationship between the dependent variable (the label we want to predict) and one or more independent variables by estimating the probability.
Make predictions
These probability values must be converted to binary numbers for prediction in practice. This is the task of a logical function, also known as the sigmoid function. Then a threshold classifier is used to convert the values of the (0,1) range into values of 0 and 1 to represent the results.
Logistic regression vs linear regression
Logic review gives discrete output results, while linear regression gives continuous output results.
Sigmoid function
Sigmoid function is an S-shaped curve, which can map any real value to a value in the range of 0-1, but it is never limited to these limitations.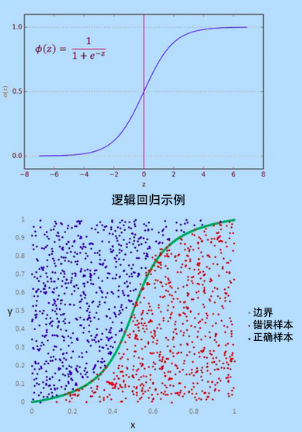
type
1. Binary Logistic regression:
The classification response has only two possible results.
Example: whether it is spam.
2. Multiple logistic regression:
Three or more categories, no need to order.
Example: predict which foods are more popular (vegetables, non vegetables, vegetarians).
3. Orderly logistic regression:
With three or more categories ordered.
Example: movie ratings range from 1 to 5.
Project background
Try to predict which users will buy the new SUV.
The model is based on two variables, age and expected salary. So our characteristic matrix will be these two columns. We try to find a correlation between the age of the user and the estimated salary, as well as his decision to buy an SUV.
Step 1: Data Preprocessing
#Import related libraries
import numpy as np
import pandas as pd
import matplotlib.pyplot as plt
#Import dataset
dateset = pd.read_csv('Social_Network_Ads.csv')
X = dataset.iloc[:, [2, 3]].values
Y = dataset.iloc[:,4].values
#Divide data set into training set and test set
from sklearn.model_selection import train_test_split
X_train, X_test, y_train, y_test = train_test_split(X, Y, test_size = 0.2, random_state = 0)
#Feature scaling
from sklearn.preprocessing import StandardSclar
sc = StandardScaler()
X_train = sc.fit_transform(X_train)
X_test = sc.transform(X_test)
Step 2: apply the logistic regression model to the dataset
from sklearn.linear_model import LogisticRegression
classifier = LogisticRegression()
classifier.fit(X_train, y_train)
Step 3: Forecast
y_pred = classifier.predict(X_test)
Step 4: evaluate the forecast
We predicted the test set. Now we will evaluate whether the logical model is correctly learned and understood. So this confusion matrix will contain the correct and wrong predictions of our model.
#Generate confusion matrix
from sklearn.metrics import confusion_matrix
cm = confusion_matrix(y_test, y_pred)
#visualization
from matplotlib.colors import ListedColormap
X_set, y_set = X_train, y_train
X1,X2=np. meshgrid(np. arange(start=X_set[:,0].min()-1, stop=X_set[:, 0].max()+1, step=0.01),
                   np. arange(start=X_set[:,1].min()-1, stop=X_set[:,1].max()+1, step=0.01))
plt.contourf(X1, X2, classifier.predict(np.array([X1.ravel(),X2.ravel()]).T).reshape(X1.shape),
             alpha = 0.75, cmap = ListedColormap(('red', 'green')))
plt.xlim(X1.min(), X1.max())
plt.ylim(X2.min(), X2.max())
for i, j in enumerate(np.unique(y_set)):
	plt.scatter(X_set[y_set==j,0],X_set[y_set==j,1],
                c = ListedColormap(('red', 'green'))(i), label=j)
plt.title('LOGISTIC(Training set)')
plt.xlabel('Age')
plt.ylabel('Estimated Salary')
plt.legend()
plt.show()

X_set,y_set=X_test,y_test
X1,X2=np. meshgrid(np. arange(start=X_set[:,0].min()-1, stop=X_set[:, 0].max()+1, step=0.01),
                   np. arange(start=X_set[:,1].min()-1, stop=X_set[:,1].max()+1, step=0.01))

plt.contourf(X1, X2, classifier.predict(np.array([X1.ravel(),X2.ravel()]).T).reshape(X1.shape),
             alpha = 0.75, cmap = ListedColormap(('red', 'green')))
plt.xlim(X1.min(),X1.max())
plt.ylim(X2.min(),X2.max())
for i,j in enumerate(np. unique(y_set)):
    plt.scatter(X_set[y_set==j,0],X_set[y_set==j,1],
                c = ListedColormap(('red', 'green'))(i), label=j)

plt. title(' LOGISTIC(Test set)')
plt. xlabel(' Age')
plt. ylabel(' Estimated Salary')
plt. legend()
plt. show()
Other resources: https://github.com/ssaishruthi/logistregression'vectorized'implementation/blob/master/logistic'renewal.ipynb

