scene
C # Form Application uses ZedGraph Curve Plug-in to draw graphs:
https://blog.csdn.net/BADAO_LIUMANG_QIZHI/article/details/99716066
After the basic graph has been realized above, the effect is as follows:
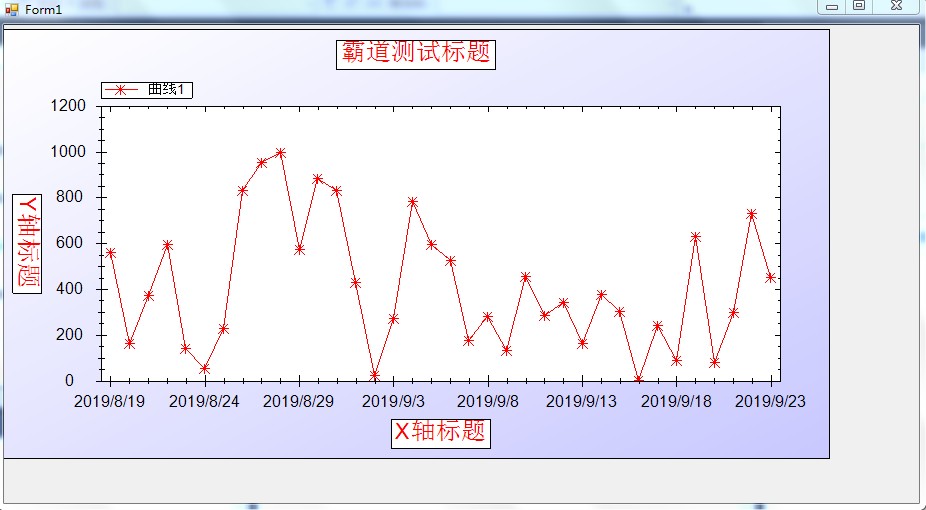
Of course, this is not our effect, but also to set its properties.
But after all, its attributes and methods are all in English, so some common properties and methods are sorted out.
Effect after adjustment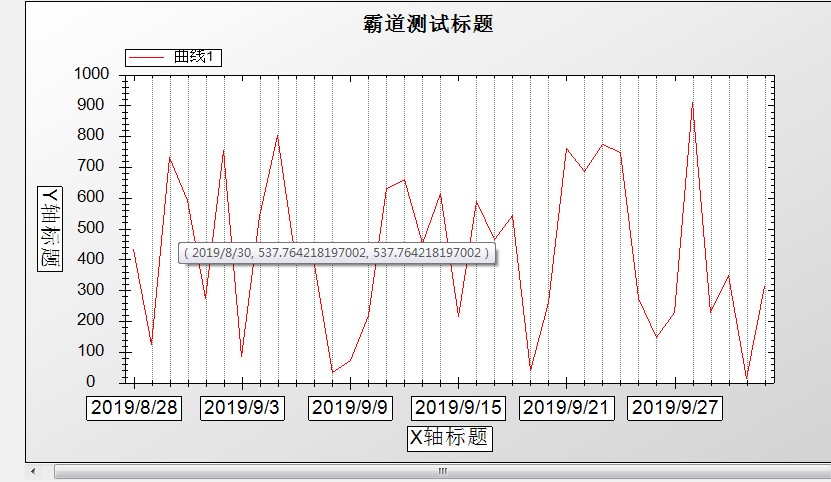
Control Download
https://download.csdn.net/download/badao_liumang_qizhi/11578445
English manual download
https://download.csdn.net/download/badao_liumang_qizhi/11578491
Realization
Setting of Overall Property of Curve
 //Horizontal scaling is allowed.
            this.zedGraphControl1.IsEnableHZoom = true;
            //Longitudinal scaling is allowed.
            this.zedGraphControl1.IsEnableVZoom = true;
            //Whether scaling is allowed
            this.zedGraphControl1.IsEnableZoom = true;
            //Whether to display the right-click menu
            this.zedGraphControl1.IsShowContextMenu = true;
            //Whether to display prompt information when copying an image
            this.zedGraphControl1.IsShowCopyMessage = true;
            //Whether to display the coordinates corresponding to the mouse point when the mouse moves on the graph defaults to false
            this.zedGraphControl1.IsShowCursorValues = true;
            //Whether to display horizontal scrollbars
            this.zedGraphControl1.IsShowHScrollBar = true;
            //Whether to display vertical scrollbars
            this.zedGraphControl1.IsShowVScrollBar = true;
            //Whether to show the corresponding value of a point on a graph when the mouse passes through it by default is false
            this.zedGraphControl1.IsShowPointValues = true;
            //When using a roller, zoom in with the center of the mouse as the center or zoom in the center of the graph.
            //this.zedGraphControl1.IsZoomOnMouseCenter = true;
Property Settings of Coordinate Axis
//X Shaft type
            myPane.XAxis.Type = AxisType.Text;
            //Show that the small scale is ____________ false And you can't see the effect.
            myPane.XAxis.MinorGrid.IsVisible = true;
            //Line color
            myPane.XAxis.Color = Color.Black;
            //The interval between the midpoint and the point of a point line
            myPane.XAxis.MinorGrid.DashOff = 1f;
            //Length of midpoint of point line
            myPane.XAxis.MinorGrid.DashOn = 1f;
            //stroke width
            myPane.XAxis.MinorGrid.PenWidth = 1f;
Calibration setting on coordinate axis
//X Axis Text Value
            myPane.XAxis.Scale.TextLabels = labels;
            //Where does the first scale begin?
            myPane.XAxis.Scale.BaseTic = 1;
            //Font attributes of scale values
            myPane.XAxis.Scale.FontSpec = myFont;
Chart color settings
//Fill in the chart color
myPane.Fill = new Fill(Color.White, Color.LightGray, 45.0f);
Curve Style Settings
 // use list1 Produce a curve labeled "Curve 1"
            //SymbolType,Enumerating the Styles of Representative Curves
            //Square = 0,
            //Diamond = 1,
            //Triangle = 2,
            //Circle = 3,
            //XCross = 4,
            //Plus = 5,
            //Star = 6,
            //TriangleDown = 7,
            //HDash = 8,
            //VDash = 9,
            //UserDefined = 10,
            //Default = 11,
            //None = 12,
            LineItem myCurve = myPane.AddCurve("Curve 1", list1, Color.Red, SymbolType.None);
Chart Title Settings
//Set the chart title and x y Axis heading
            myPane.Title.Text = "Hegemonic Test Title";

            myPane.XAxis.Title.Text = "X Axis heading";

            myPane.YAxis.Title.Text = "Y Axis heading";

            //Change the font of the title

            FontSpec myFont = new FontSpec("Arial",16,Color.Black,false,false,false);

            myPane.XAxis.Title.FontSpec = myFont;

            myPane.YAxis.Title.FontSpec = myFont;