Recently, a strange problem occurred in a query microservice online. The number of GCs suddenly increased, and the time consumption of GC also increased. It's not always the problem, but it's reported every other time.
View jstat -gcutils 10000: Similar to the following:
S0     S1     E      O      M     CCS    YGC     YGCT    FGC    FGCT     GCT
0.00 100.00 100.00 100.00  44.56  95.10     21    8.678    11  140.498  149.176
0.00 100.00 100.00 100.00  44.56  95.10     31    8.678    11  140.498  169.176
0.00 100.00 100.00 100.00  44.56  95.10     41    8.678    11  140.498  189.176
Looking at jmap, we find that there are many ByteArrayRow that are jdbc data return related objects:
 num     #instances         #bytes  class name (module)
-------------------------------------------------------
   1:       6736991      270490848  [B (java.base@11.0.4)
   2:       2154446       51706704  java.lang.String (java.base@11.0.4)
   3:        184135       30913512  [[B (java.base@11.0.4)
   4:          3720       30535872  [C (java.base@11.0.4)
   5:        102716       20543200  Business database entity POJO class
   6:        543210       17382720  java.sql.Timestamp (java.sql@11.0.4)
   7:        524288       12582912  org.apache.logging.log4j.core.async.AsyncLoggerConfigDisruptor$Log4jEventWrapper
   8:         48220        7123584  [Ljava.lang.Object; (java.base@11.0.4)
   9:         71046        6252048  java.lang.reflect.Method (java.base@11.0.4)
  10:        152288        4873216  java.util.concurrent.ConcurrentHashMap$Node (java.base@11.0.4)
  11:        183671        4408104  com.mysql.jdbc.ByteArrayRow
  12:         14721        4056328  [I (java.base@11.0.4)
  13:          1959        3149560  [J (java.base@11.0.4)
It is speculated that there may be a problem with the writing of a database query statement, which results in the query scope being too large (it should be the query related to the business class above). Through positioning, it is found that a scheduled task triggers a full scan SQL, which causes the JVM GC pressure to rise suddenly and does not OutOfMemory.
For a problem like this, positioning is troublesome. It's better to have a tool. It can close this instance and dump out the memory occupation to locate and solve the problem.
NetFlix is the ancestor of JAVA EE framework. This related tool has long been thought of.
Dead query and JVM kill
NetFlix has a lot of JAVA based storage, such as Cassandra and ElasticSearch. Most of the time it works. But sometimes, a bug or improper design leads to a full query or a large number of queries, which leads to memory exhaustion or continuous GC. In this way, the request speed of this instance will be greatly reduced, which is an unhealthy instance. For this kind of unhealthy instance caused by "dead query", the first step we think about is to kill it in time and save the impact on business performance. JVM kill can be implemented.
JVM kill is an application JVM tools Interface java agent based on ResourceExhausted This hook callback will kill the JVM process when the JVM enters the outofmemoryerror: unable to create new native thread state or outofmemoryerror: java heap space state. This tool can be used with the JVM startup parameter - XX:HeapDumpOnOutOfMemoryError to print the memory snapshot of the heap when OutofMemory is used to locate problems.
As for how to recover, our cluster uses containers. After the discovery process is kill ed, a new pod (instance) will be started
Perfection of scenarios that cannot be solved by jvmkill - jvmquake
However, not all problems can be solved in this way. As we mentioned at the beginning, this problem can not be solved. The problem mentioned at the beginning is just GC, not OutOfMemory. Like this, jvmkill can't solve it.
NetFlix uses Cassandra to give a similar example of reading a full table:
cqlsh> PAGING OFF
Disabled Query paging.
cqlsh> SELECT * FROM large_ks.large_table;
OperationTimedOut: errors={}, last_host=some host
cqlsh> SELECT * FROM large_ks.large_table;
Warning: schema version mismatch detected, which might be caused by DOWN nodes; if this is not the case, check the schema versions of your nodes in system.local and system.peers.
Schema metadata was not refreshed. See log for details.
Use the JVM tool to view the current Cassandra instance status:
$ sudo -u cassandra jstat -gcutil $(pgrep -f Cassandra) 100ms
S0     S1     E      O      M     CCS    YGC     YGCT    FGC    FGCT     GCT
0.00 100.00 100.00 100.00  97.96  95.10     21    8.678    11  140.498  149.176
0.00 100.00 100.00 100.00  97.96  95.10     21    8.678    11  140.498  149.176
0.00 100.00 100.00 100.00  97.96  95.10     21    8.678    11  140.498  149.176
$ grep "stopped" gclog | tail
2019-03-05T02:59:15.111+0000: 1057.680: Total time for which application threads were stopped: 18.0113457 seconds, Stopping threads took: 0.0001798 seconds
2019-03-05T02:59:16.159+0000: 1058.728: Total time for which application threads were stopped: 1.0472826 seconds, Stopping threads took: 0.0001542 seconds
2019-03-05T02:59:40.461+0000: 1083.030: Total time for which application threads were stopped: 24.3016592 seconds, Stopping threads took: 0.0001809 seconds
2019-03-05T03:00:16.263+0000: 1118.832: Total time for which application threads were stopped: 35.8020625 seconds, Stopping threads took: 0.0001307 seconds
2019-03-05T03:00:51.599+0000: 1154.168: Total time for which application threads were stopped: 35.3361231 seconds, Stopping threads took: 0.0001517 seconds
2019-03-05T03:01:09.470+0000: 1172.039: Total time for which application threads were stopped: 17.8703301 seconds, Stopping threads took: 0.0002151 seconds
It can be seen from the GC log that there is a repeated GC time consumption of more than 20 seconds GCViewer For this tool, you can see:
-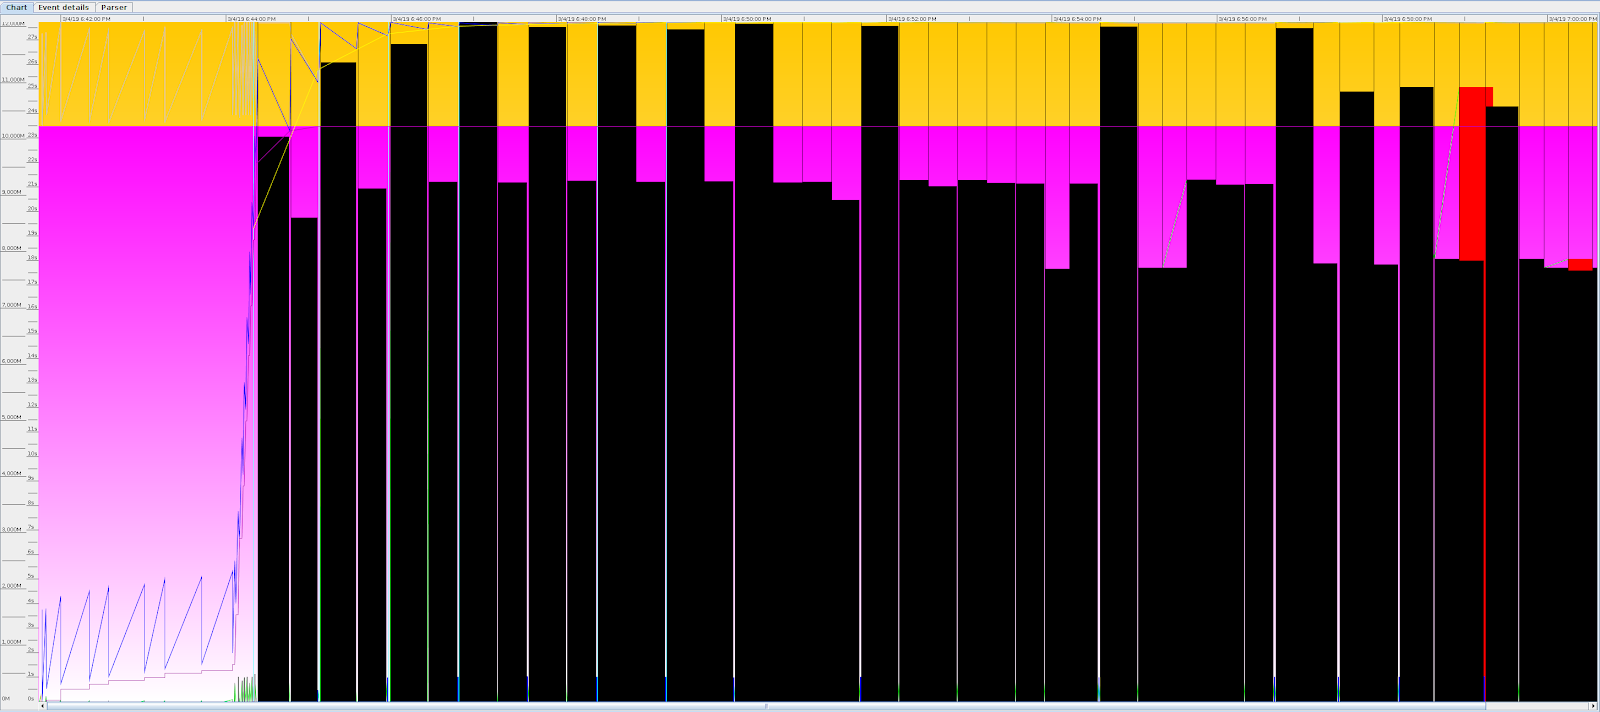
Basically, all the GC time from the dead query is very long, and it can't be recovered. For this problem, it is better to have corresponding monitoring to actively kill the process. However, the existing JVM startup parameters or status bit monitoring cannot be implemented.
The implementation and solution of jvmquake
Netflix engineers believe that no matter how heavy the load, the main time of JVM should be spent on business logic, not GC. If the proportion of business time is very low, the JVM process needs to be kill ed. So they designed a model: GC time pool. When a GC occurs, if it takes 200ms, the GC pool will be + 200ms; if it takes 500ms, the business operation time will be used to deduct the GC time pool. The bottom line is 0, which cannot be negative. Here is 0. In this way, if the ratio of GC time to business time is always greater than 1:1, the GC time pool will grow indefinitely. When a certain limit is reached, the JVM is considered unhealthy. This is the implementation idea of jvmquake.
How is the GC time measured? adopt GarbageCollectionStart and GarbageCollectionFinish These two Java tool interfaces
jvmquake has three parameters:
- GC pool upper limit: as mentioned above,. When a certain limit is reached, the JVM is considered unhealthy, and corresponding operations will be taken.
- Ratio of business time to GC time: the ratio of expected business time to GC time is 1:1 by default, assuming that the expectation is 2:1. Then it is GC pool = + 2GC time - 1 business time. Generally, business time accounts for more than 95% (that is, 19:1).
- Take action: for jvmquake, before sending SIGKILL to the JVM process, you need to do some other operations to keep the scene for later locating the reason.
What action? full dump to core dump
So what are these operations? First of all, we definitely want to keep jmap's full dump. You can create a large array continuously through a thread to cause OOM, thus triggering - XX:HeapDumpOnOutOfMemoryError to print full dump. However, if several kill and restart occur. There is a risk that the hard disk will be full. It is better that the output of this dummp can have a channel interface and be written to IO outside the local disk (for example, S3). Unfortunately, however, the jvm does not. We can turn to core dump.
By sending SIGABRT, linux prints the core dump automatically. The size of the core dump is controlled by the limit of ulimit-c. If you want to be unrestricted, you can use the command:
ulimit -c unlimited
We still want to upload it to S3 storage. Fortunately, we can output the core dump to a specific pipe through kernel.core ﹐ pattern sysctl linux kernel manual (Chapter "Piping core dumps to a program")
coredump_uploader.sh
#!/bin/bash
# Depends on zstd (>1.3.6) and aws-cli
set -o errexit
set -o nounset
set -o pipefail

# Set kernel.core_pattern = | coredump_uploader.sh %P %s %E
PID=$1
shift
SIGNAL=$1
shift
EXECUTABLE=$1
shift

# Set these to appropriate values for your environment
readonly BUCKET=
readonly APP_NAME=
readonly INSTANCE_ID=
readonly COREDUMP_BACKOFF_MINS=60

TARGET_STDERR="/proc/${PID}/fd/2"
if ! exec 2>>"${TARGET_STDERR}" >&2; then
  # Redirect output into the target's stderr, if possible
  exec 2> >(exec 2>&-; logger -t "coredump-uploader-${PID}")
  exec >&2
fi

echo "${0##*/} initiated for PID ${PID}"
mkdir -p /run/coredumps

find /run/coredumps -mmin "+${COREDUMP_BACKOFF_MINS}" -type f -delete
LAST=$(find /run/coredumps -type f -printf "%t\n" | head -n1)
if [ -n "${LAST}" ]; then
   # Back off without creating a file
   echo "Last core dump was at ${LAST}; too soon to upload another."
   exit
fi
mktemp -p /run/coredumps dump.XXXXXXXXXX

MACHINE_DATE=$(date "+%s.%N")
HUMAN_DATE=$(date -d "@${MACHINE_DATE}" '+%Y-%m-%dT%H:%M:%S.%N')
TWO_63=9223372036854775808
REVERSE_DATE=$(($TWO_63 - ${MACHINE_DATE/.})) # overflows in 2230

S3_KEY="s3://${BUCKET}/apps/${APP_NAME}/coredumps/${INSTANCE_ID}/${REVERSE_DATE}_${HUMAN_DATE}"
echo "Uploading to: ${S3_KEY}"

echo "Uploading metadata"
EXE_HASH=$(sha256sum /proc/$PID/exe | cut -d' ' -f1)
(
    cat <<EOF
Date: $HUMAN_DATE
PID: $PID
Signal: $SIGNAL
Command: ${EXECUTABLE//!//}
SHA256(Executable): $EXE_HASH
EOF

  lsof -p $PID -Pn
) | aws s3 cp - "${S3_KEY}/meta"

echo "Uploading tarball"
#XXX: which of these files duplicate data already present in the core dump?
#XXX: also, if any of these files are useful, should we get the same from each
# running thread
tar -C /proc/$PID -c \
  cgroup \
  cmdline \
  cpuset \
  comm \
  environ \
  gid_map \
  io \
  maps \
  mountinfo \
  sched \
  schedstat \
  smaps \
  stack \
  stat \
  status \
  uid_map \
  wchan \
| aws s3 cp - "${S3_KEY}/proc.tar"

echo "Uploading core file"
echo "You may see 'Aborted (Core Dumped)' printed to the terminal before completion"
# If you can't use zstd, consider lz4 instead: it has compression throughput
# suitable for streaming uploads.
zstd --adapt | aws s3 cp - "${S3_KEY}/core.zst"