1, The UI access interface of k8s - dashboard
In dashboard, although we can create, delete and modify resources, we usually regard it as the software of healthy k8s cluster.
As the Web user interface of Kubernetes, users can deploy containerized applications in Kubernetes cluster through Dashboard, handle and manage the application problems, and manage the cluster itself. Through Dashboard, users can view the operation of applications in the cluster, and create or modify Kubernetes resources such as deployment, task, service, etc. based on Dashboard. Through the Deployment Wizard, users can expand and shrink the deployment, perform rolling update, restart Pod and deploy new applications. Of course, you can also view the status of Kubernetes resources through Dashboard.
1. Functions provided by Dashboard
By default, Dashboard displays objects under the default namespace, or you can select another namespace through the namespace selector. Most of the object types of the cluster can be displayed in the Dashboard user interface.
1) Cluster management
The cluster management view is used to manage nodes, namespaces, persistent storage volumes, roles, and storage classes. The node view shows CPU and memory usage, as well as the creation time and running status of this node. The namespace view shows which namespaces exist in the cluster and the running state of those namespaces. The role view shows in a list form which roles exist in the cluster, their types and their namespaces. The persistent storage volume is displayed in the form of a list. You can see the total storage amount, access mode, use status and other information of each persistent storage volume. The administrator can also delete and edit the YAML file of the persistent storage volume.
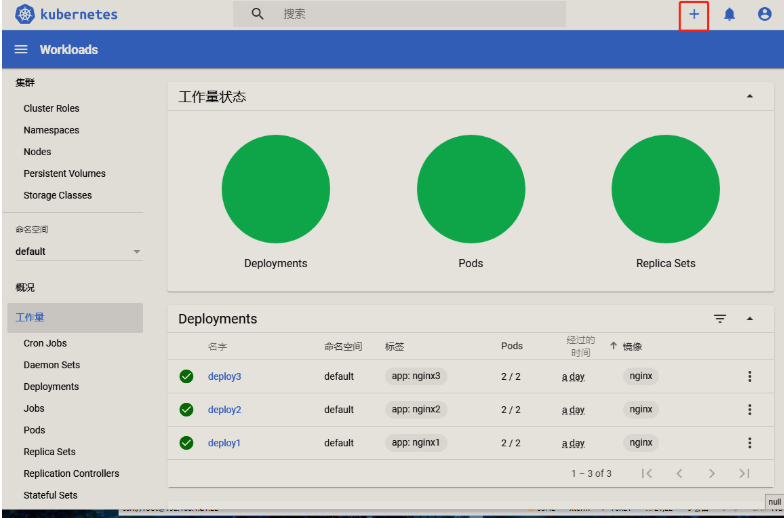
2) Workload
The workload view shows all workload types such as deployment, replica set, stateful replica set, and so on. In this view, the various workloads are organized according to their types. The details view of the workload can display the application details and status information, as well as the relationship between objects.
3) Service discovery and load balancing
Service discovery view can expose the service of cluster content to the application outside the cluster. The application inside and outside the cluster can call the application through the exposed service, the external application uses the external endpoint, and the internal application uses the internal endpoint.
4) storage
The storage view shows the persistent storage volume claim resources that are applied to store data.
5) configuration
The configuration view shows the configuration information used by the application running in the cluster. Kubernetes provides the configuration dictionaries (ConfigMaps) and secret dictionaries. Through the configuration view, you can edit and manage the configuration objects and view the hidden sensitive information.
6) Log view
The Pod list and details page provide a link to view the log view. Through the log view, you can not only view the log information of the Pod, but also view the log information of the Pod container. Through Dashboard, you can create and deploy a containerized application according to the wizard. Of course, you can also enter the specified application information manually, or upload YAML and JSON files to create and not be applied.
2. Download yaml files and images required
[root@master https]# wget https://raw.githubusercontent.com/kubernetes/dashboard/v2.0.0-rc5/aio/deploy/recommended.yaml
[root@master https]# docker pull kubernetesui/dashboard:v2.0.0-rc5
3. Modify recommended.yaml
[root@master https]#vim recommended.yaml
---
kind: Service
apiVersion: v1
metadata:
  labels:
    k8s-app: kubernetes-dashboard
  name: kubernetes-dashboard
  namespace: kubernetes-dashboard
spec:
  type: NodePort            #Add 40
  ports:
    - port: 443
      targetPort: 8443
  selector:
    k8s-app: kubernetes-dashboard
Execute it.
[root@master https]# kubectl apply -f recommended.yaml
Check it out.
[root@master https]# kubectl get svc -n kubernetes-dashboard
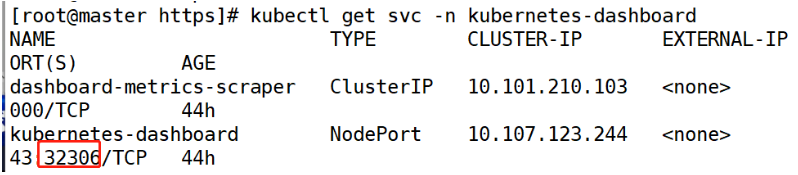
3. Browser: https://192.168.1.21:32306
PS: if you use the old version of dashboard and use Google browser to log in, it may not be successful. You need to change to another browser, such as Firefox.
4. Login to dashboard based on token
<1> Create a dashboard management user
[root@master https]# kubectl create serviceaccount dashboard-admin -n kube-system
<2> Bind user as cluster management user
[root@master https]# kubectl create clusterrolebinding dashboard-cluster-admin --clusterrole=cluster-admin --serviceaccount=kube-system:dashboard-admin
<3> Get Token
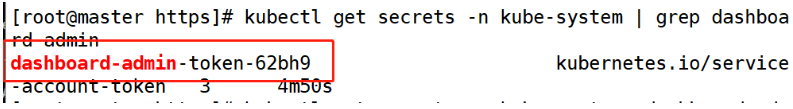
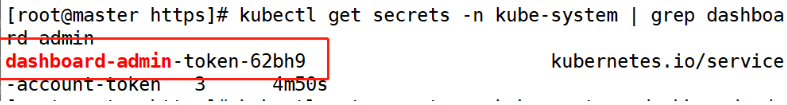
[root@master https]# kubectl get secrets -n kube-system | grep dashboard-admin
//Get the name of Token first
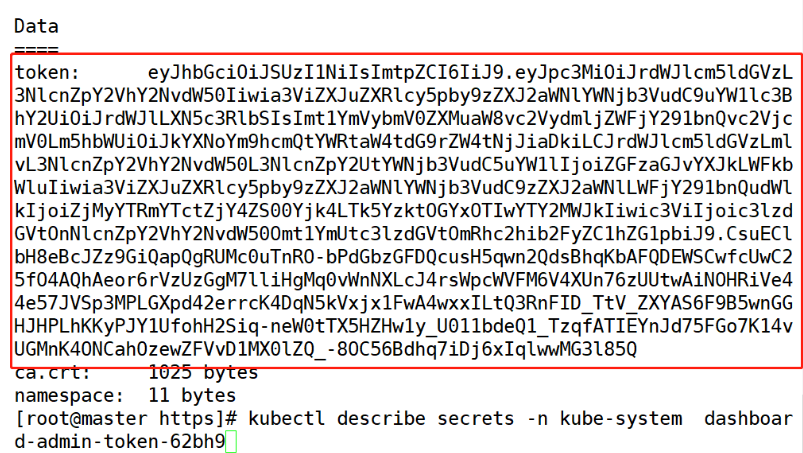
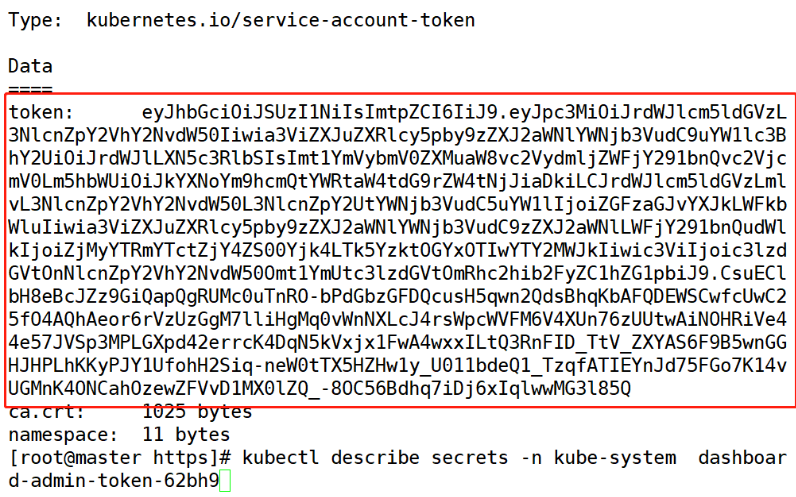
[root@master https]# kubectl describe secrets -n kube-system  dashboard-admin-token-62bh9
//Check the details of the secret resource obtained above, and you will get the token
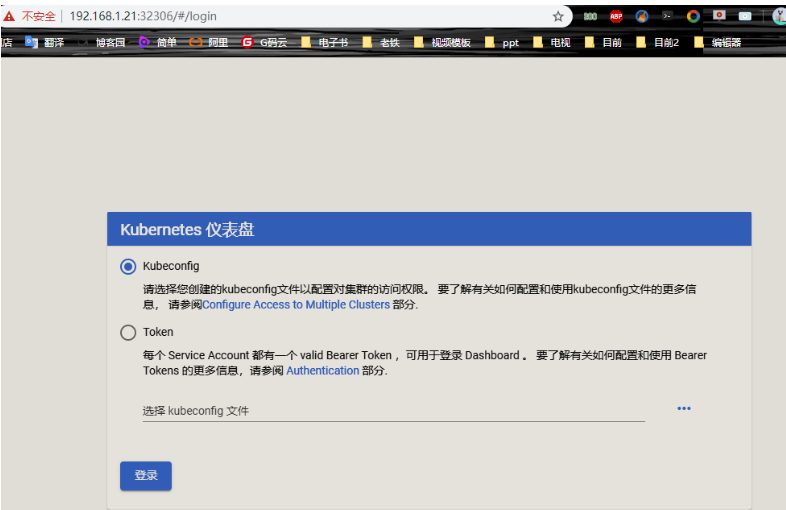
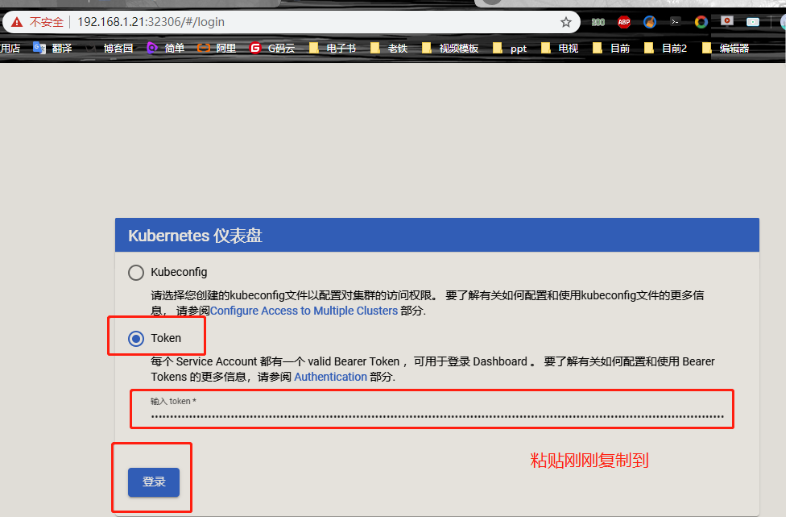
<4> Log in using token on the browser.
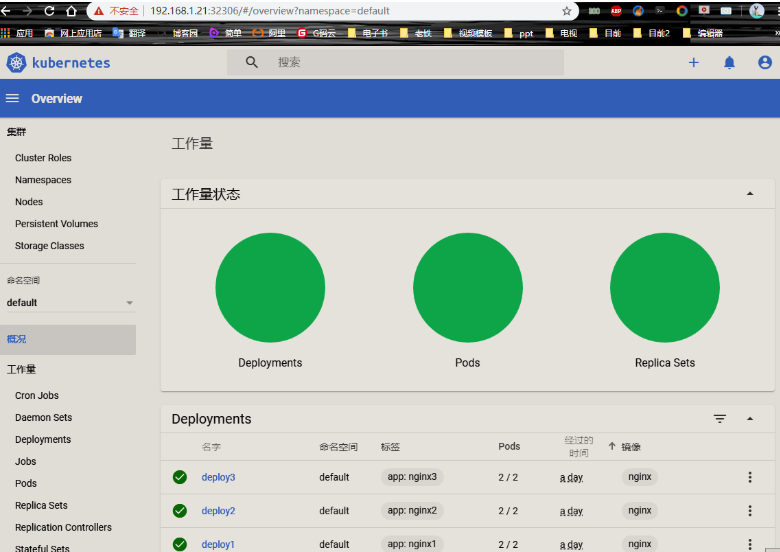
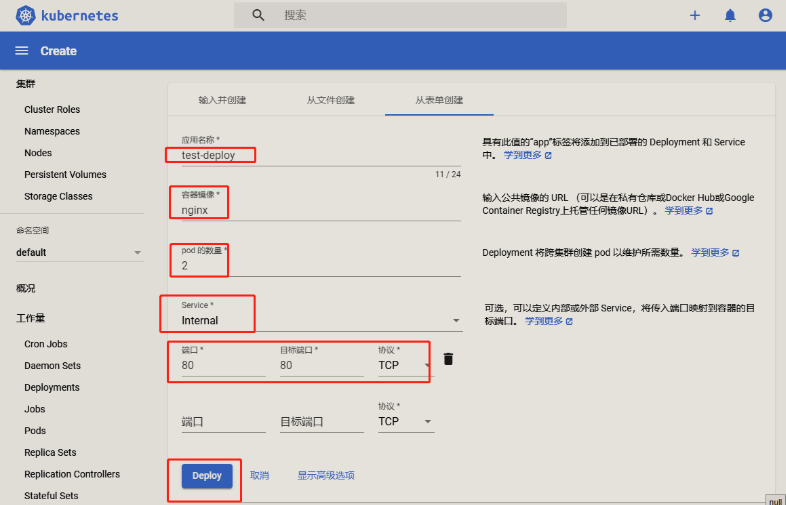
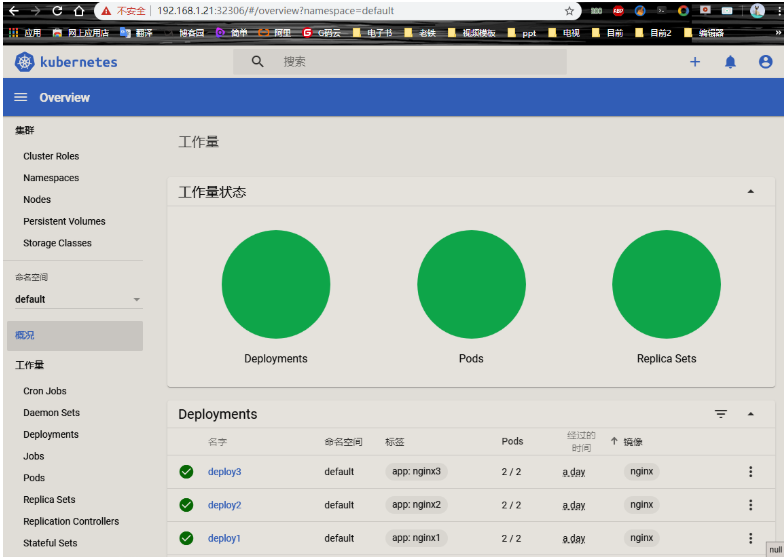
Create a resource
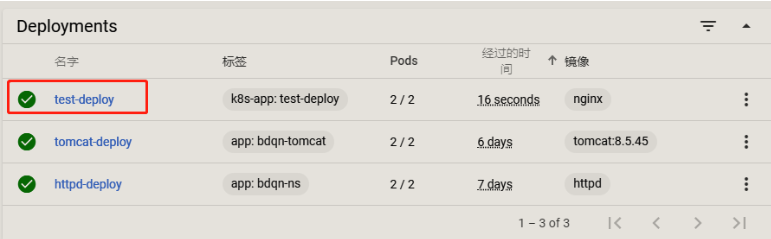
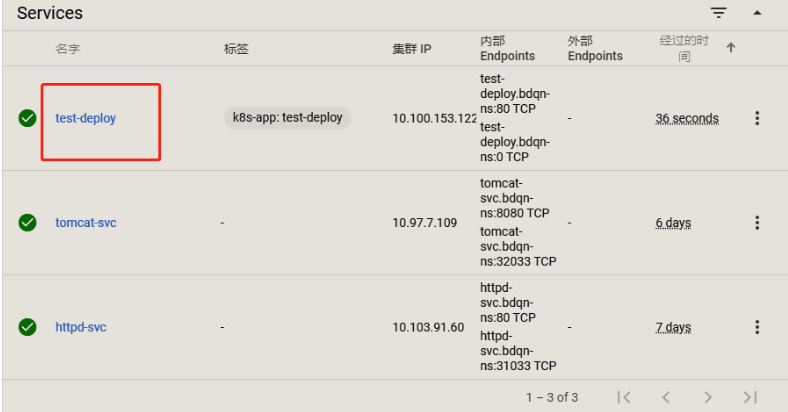
Check whether the creation is successful
5. Login dashboard based on kubeconfig configuration file
<1> Get Token
[root@master https]# kubectl get secrets -n kube-system | grep dashboard-admin
//Get the name of Token first
[root@master https]# kubectl describe secrets -n kube-system  dashboard-admin-token-62bh9
//Check the details of the secret resource obtained above, and you will get the token
<2> Generate the kubeconfig configuration file.
Set an environment variable to represent the acquired token
[root@master https]# DASH_TOKEN=$(kubectl get secrets -n kube-system dashboard-admin-token-62bh9 -o jsonpath={.data.token} | base64 -d)Write the configuration information of k8s cluster to the kubeconfig configuration file.
[root@master https]# kubectl config set-cluster kubernetes --server=192.168.1.21:6443 --kubeconfig=/root/.dashboard-admin.conf
[root@master https]# kubectl config set-credentials dashboard-admin --token=$DASH_TOKEN --kubeconfig=/root/.dashboard-admin.conf
[root@master https]# kubectl config set-context dashboard-admin@kubernetes --cluster=kubernetes --user=dashboard-admin --kubeconfig=/root/.dashboard-admin.conf
[root@master https]# kubectl config use-context dashboard-admin@kubernetes --kubeconfig=/root/.dashboard-admin.conf
<3> Export and save the generated configuration file of / root/.dashboard-admin.conf.
[root@master https]# sz /root/.dashboard-admin.conf
//Export to the location you are used to
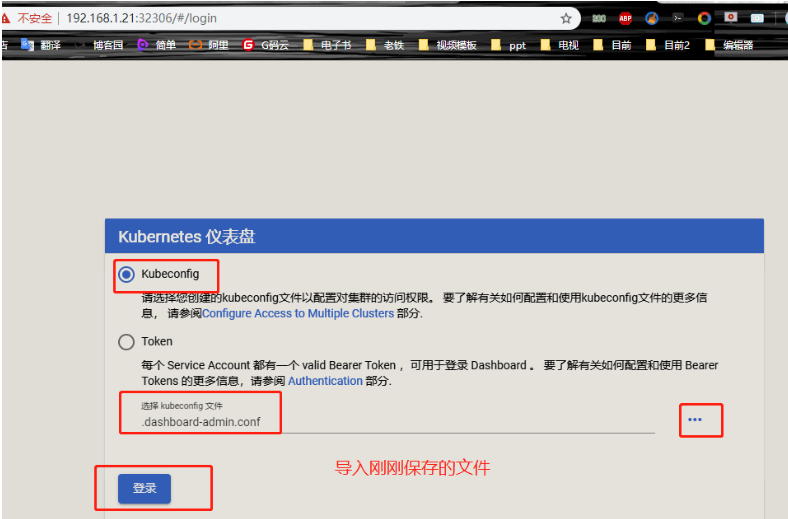
<4> Select the login mode of kubeconfig from the browser, and then import the configuration file.
2, Deploy weave scope to monitor k8s cluster
Weave Scope is a visualized monitoring tool for Docker and Kubernetes. Scope provides a complete view of the cluster infrastructure and applications from the top to the bottom. Users can easily monitor and diagnose the distributed containerized applications in real time.
Using scope
- Scope automatically builds the logical topology of applications and clusters. For example, click PODS at the top to display all PODS and their dependencies.
-
Click HOSTS to display the relationship between each node.
Real time resource monitoring
- You can view the CPU and memory usage of resources in Scope.
- Supported resources are Host, Pod, and Container. * *
Online operation
- Scope also provides convenient online operation functions, such as selecting a Host and clicking the > button can directly open the command line terminal of the node in the browser
- Click + of Deployment to perform Scale Up operation
- You can view the log of Pod
-
You can attach, restart, stop containers, and troubleshoot problems directly in Scope
Powerful search capabilities
- Scope supports keyword search and locating resources.
- You can also perform conditional searches, such as finding and locating pods with memory > 100m.
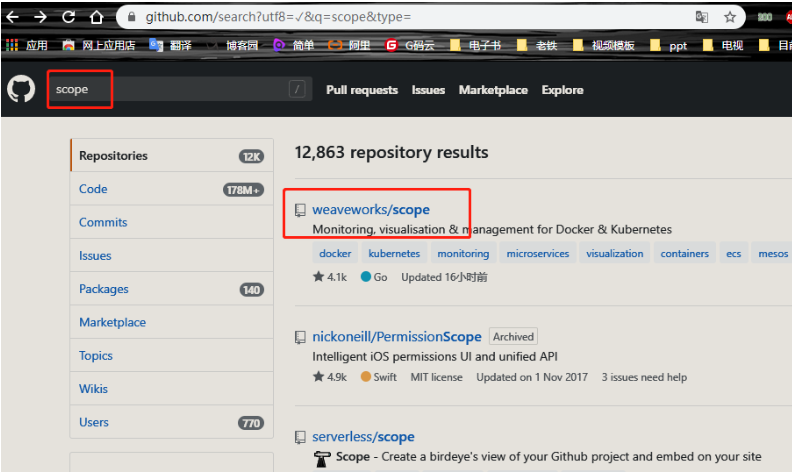
1. Find the yaml file of scope on github
(1) Search scope on github
(2) Enter k8s deployment scope description
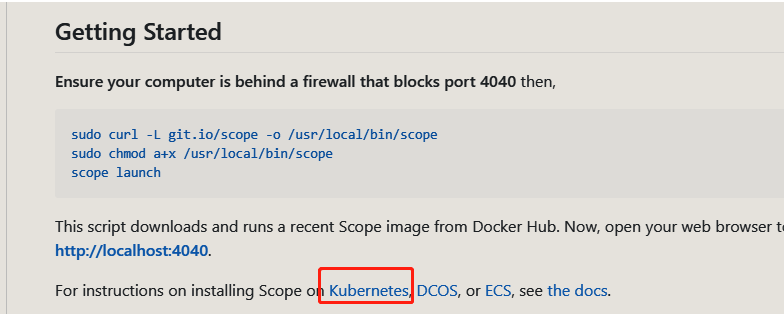
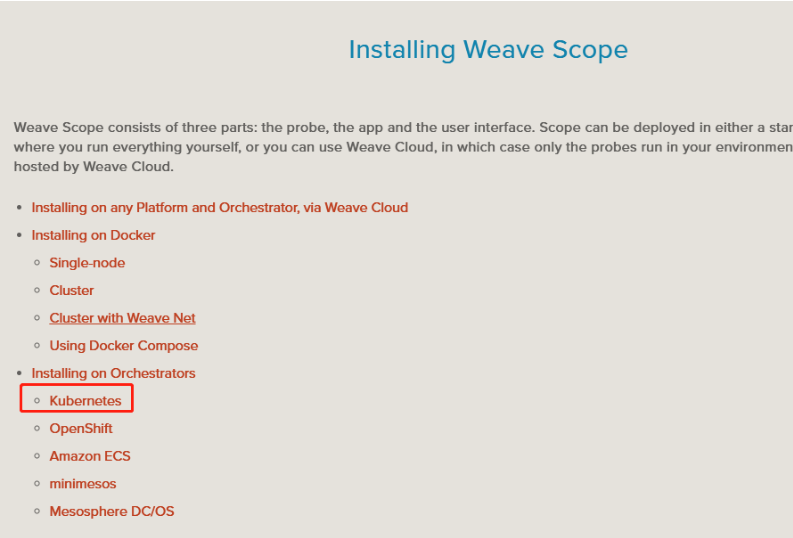
(3) Choose k8s deployment
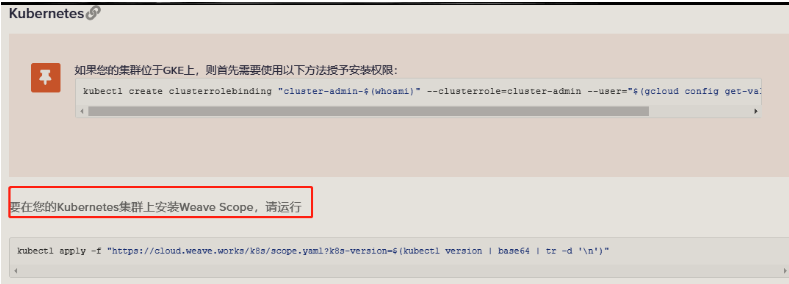
(4) Copy the above link and download the yaml file
[root@master https]# wget https://cloud.weave.works/k8s/scope.yaml
2. Modify the downloaded yaml file and run
[root@master ~]# vim scope.yaml  #Edit yaml file
#Go to line 213 and change the port type of its service
    spec:
      type: NodePort         #Modify the type to NodePort
      ports:
        - name: app
          port: 80
          protocol: TCP
          targetPort: 4040
(1) Do it
[root@master https]# kubectl apply -f scope.yaml
(2) Check the operation of the container to make sure it is in normal operation
[root@master https]# kubectl get pod -o wide -n weave
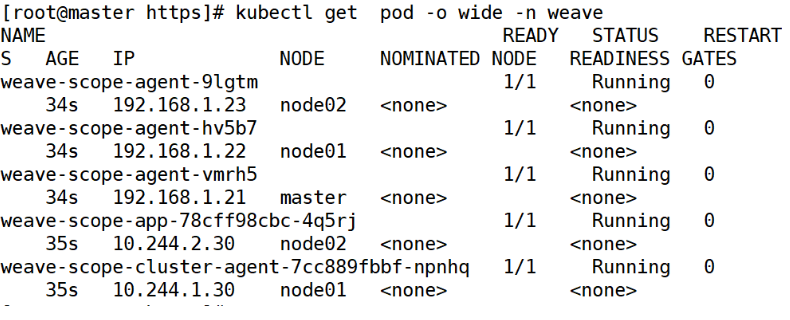
- Daemonset weave scope agent, the scope agent program that runs on each node of the cluster, is responsible for collecting data.
- Deployment web scope app, a scope application, obtains data from agent s, displays it through Web UI and interacts with users.
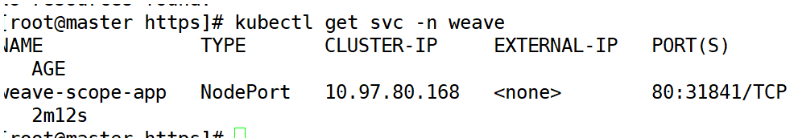
- Service weave scope app, the default is ClusterIP type. We have added k8s service type = NodePort to the above command and changed it to NodePort.
[root@master https]# kubectl get svc -n weave
#DaemonSet resource object: weave scope agent (agent): responsible for collecting node information;
#deployment resource object: Web scope app (application): get data from agent, display and interact with user through web UI;
#Compared with deployment, the feature of DaemonSet resource object is that DaemonSet resource object will run on each node and only one pod can run.
#Because every node needs to be monitored, a resource object like DaemonSet is used
3. Visit http://192.168.1.21:31841/
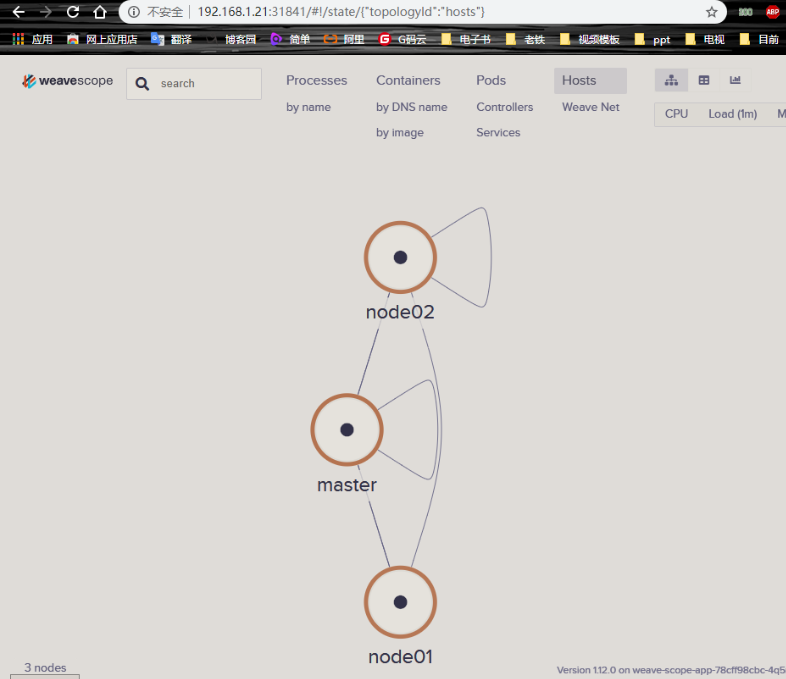
In the scope web interface, you can view a lot of things, such as pod, node node and other details, including opening the container terminal, viewing its log information and so on
summary
• web scope can show us the management of resource objects such as service/controller/pod and simple web ui operation with its simple visualization, which is convenient for troubleshooting and timely positioning
• web scope as a web ui currently lacks login authentication. You can use the authentication of web server in other ways for security control.
3, Deploy Prometheus service
PS: prometheus deployed here is not provided by prometheus official website, but the prometheus project provided by coreos.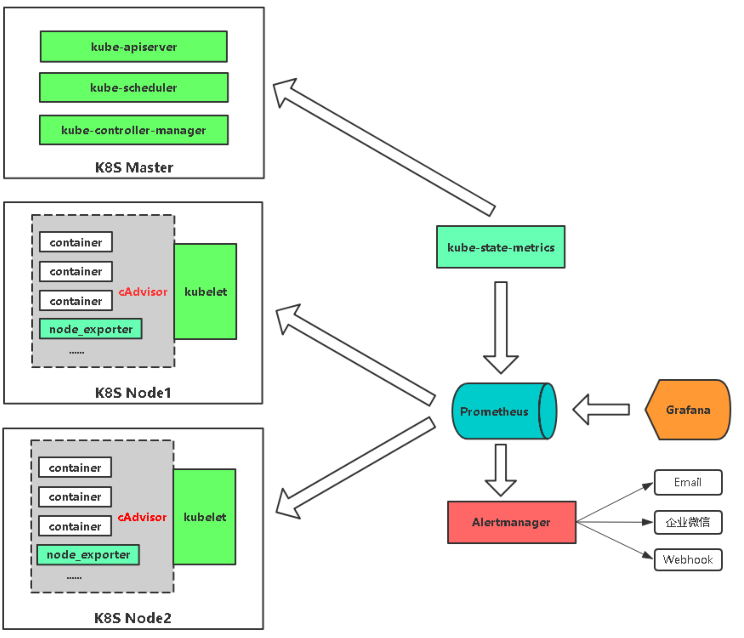
Before deployment, let's understand the function of each component of Prometheus!
- MetricsServer: it is the aggregator of k8s cluster resource usage. It collects data for use in k8s cluster, such as kubectl,hpa,scheduler, etc.
- Prometheus Operator: a system detection and alarm toolbox for storing monitoring data.
- Prometheus node exporter: collect data of k8s cluster resources and specify alarm rules.
- Prometheus: collect the data of apiserver, scheduler, controller manager and kubelet components, and transfer them through http protocol.
- Grafana: visual data statistics and monitoring platform.
Features
Compared with other traditional monitoring tools, Prometheus has the following characteristics:
- Multidimensional data model with time series data identified by metric name and key / value pair
- There is a flexible query language
- Independent of distributed storage, only related to local disk
- Pull time series data through HTTP service
- Push is also supported to add time series data
- It also supports the discovery of targets through service discovery or static configuration
- Multiple graphics and dashboard support
1. Search for core OS / Prometheus on github
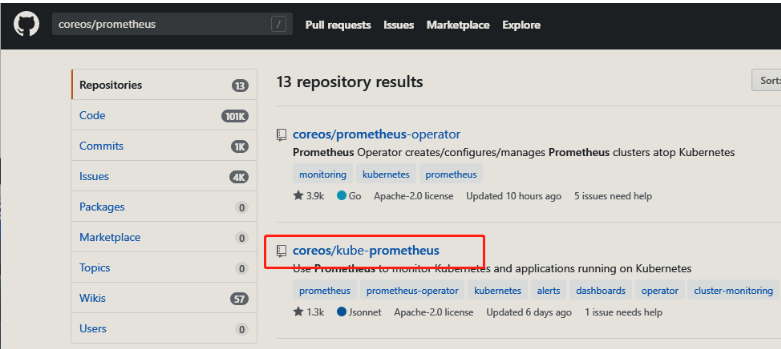
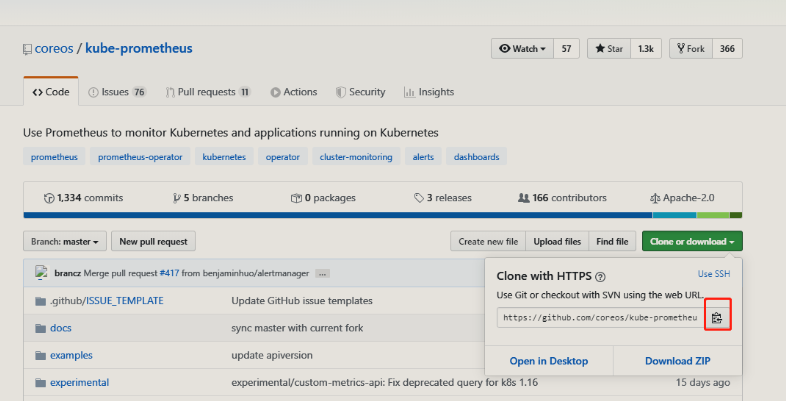
Replication link
2. Clone the promethes project on github
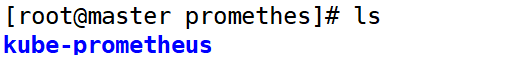
[root@master promethes]# yum -y install git
//Download git command
[root@master promethes]# git clone  https://github.com/coreos/kube-prometheus.git
//Clone projects on github
3. Modify the file grafapa-service.yaml to the exposure mode of nodePort, and the exposure port is 31001.
[root@master promethes]# cd kube-prometheus/manifests/
//Enter the manifest directory of Kube Prometheus
[root@master manifests]# vim grafana-service.yaml    #Modify grafana's yaml file

apiVersion: v1
kind: Service
metadata:
  labels:
    app: grafana
  name: grafana
  namespace: monitoring
spec:
  type: NodePort       #Change to NodePort type
  ports:
  - name: http
    port: 3000
    targetPort: http
    nodePort: 31001    #Mapping to host 31001 port
  selector:
    app: grafana
3. Modify the prometheus-service.yaml file to the exposure mode of nodePort, and the exposure port is 31002
[root@master manifests]# vim prometheus-service.yaml    #Modify yaml file of prometheus

apiVersion: v1
kind: Service
metadata:
  labels:
    prometheus: k8s
  name: prometheus-k8s
  namespace: monitoring
spec:
  type: NodePort      #Change to NodePort type
  ports:
  - name: web
    port: 9090
    targetPort: web
    nodePort: 31002    #Mapping to host 31002 port
  selector:
    app: prometheus
    prometheus: k8s
  sessionAffinity: ClientIP
4. Modify the alertmanager-service.yaml file to the exposure mode of nodePort, and the exposure port is 31003
[root@master manifests]# vim alertmanager-service.yaml    #Modify the yaml file of alertmanager

apiVersion: v1
kind: Service
metadata:
  labels:
    alertmanager: main
  name: alertmanager-main
  namespace: monitoring
spec:
  type: NodePort             #Change to NodePort type
  ports:
  - name: web
    port: 9093
    targetPort: web
    nodePort: 31003         #Mapping to host 31003 port
  selector:
    alertmanager: main
    app: alertmanager
  sessionAffinity: ClientIP
5. Run all yaml files in the setup directory. Is the basic environment configuration for running the above yaml file.
[root@master manifests]# cd setup/
//Go to the setup / directory
[root@master manifests]# kubectl apply -f setup/
//Run all yaml files in the setup directory
6. Run all yaml files in the main directory (Kube Prometheus).
When the following yaml files are executed, each node will download many images on the Internet. In order to prevent the image download time from being too long, you can download the image provided by me to the local, then import it to each node, and then execute the following yaml files, which will save some time. (if downloading the image provided by me, it is recommended to write a script to import the image to avoid manual import and error.)
[root@master manifests]# cd ..
//Return to the previous directory (Kube Prometheus)
[root@master kube-prometheus]# kubectl apply -f manifests/
//Run all yaml files in the Kube Prometheus directory
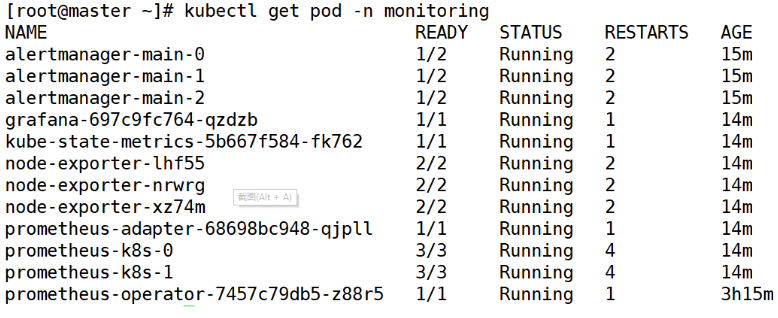
Check it out.
[root@master ~]# kubectl get pod -n monitoring
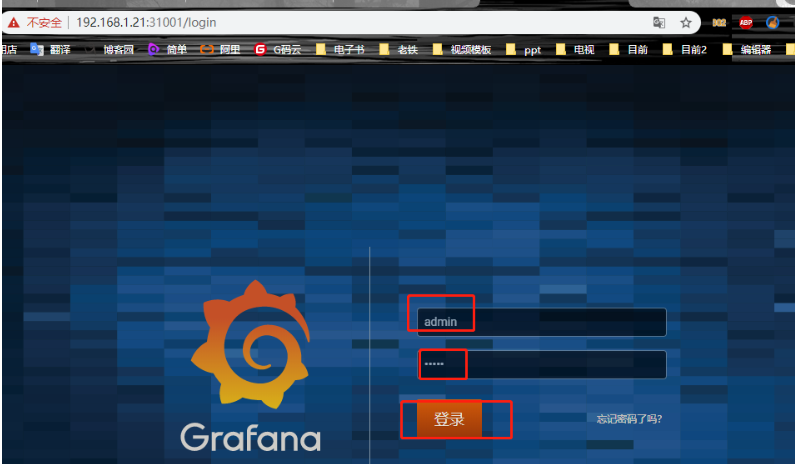
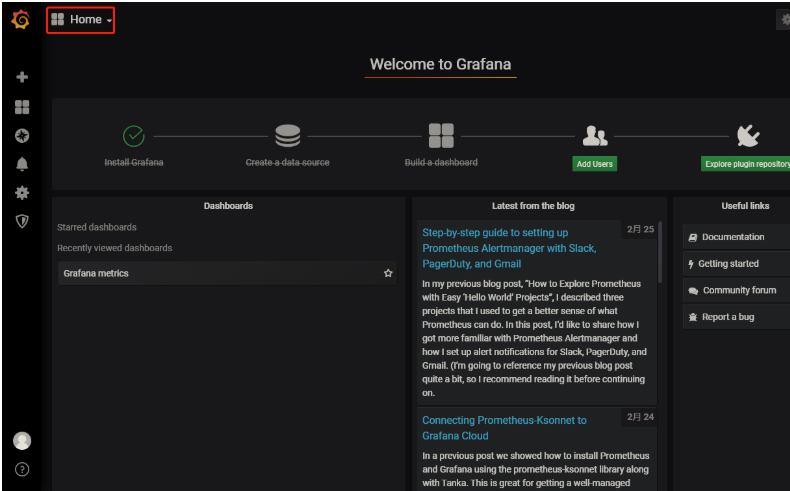
7. Visit http://192.168.1.21:31001
When the client accesses the IP+30100 port of any node in the cluster, it can see the following interface (the default user name and password are admin)
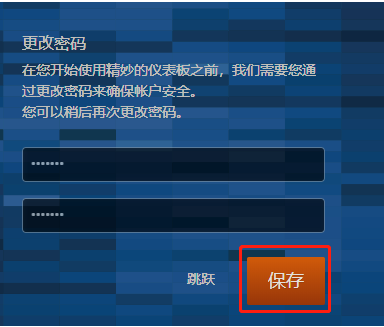
Follow the prompts to change the password:
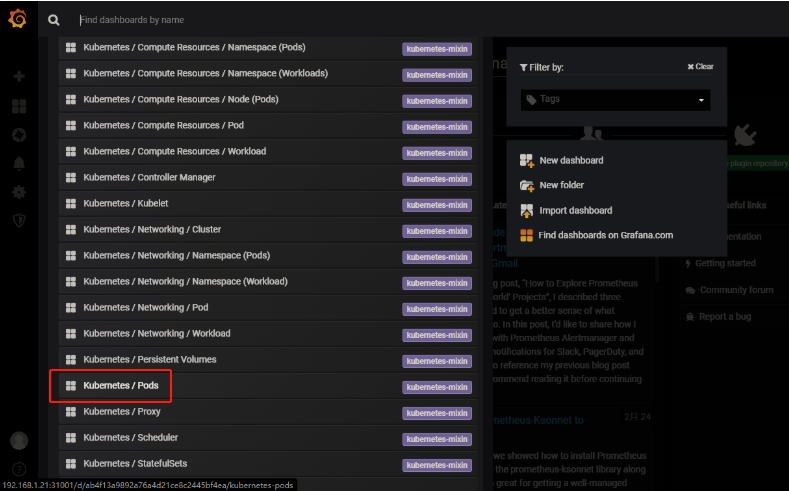
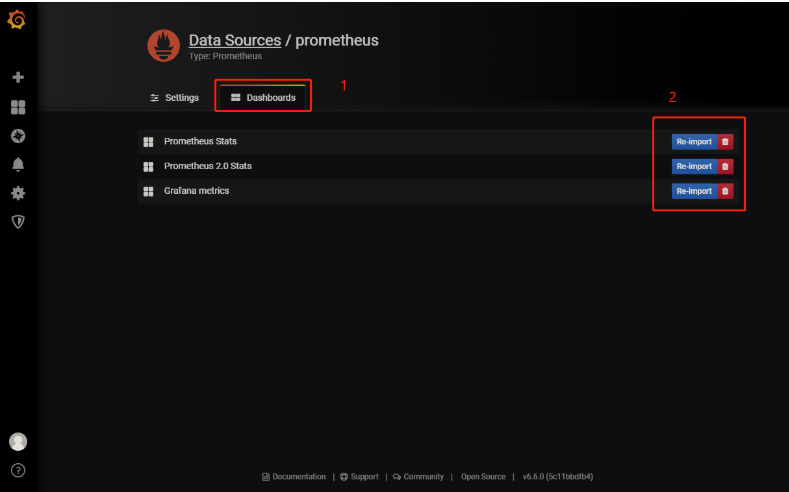
(1) Add template
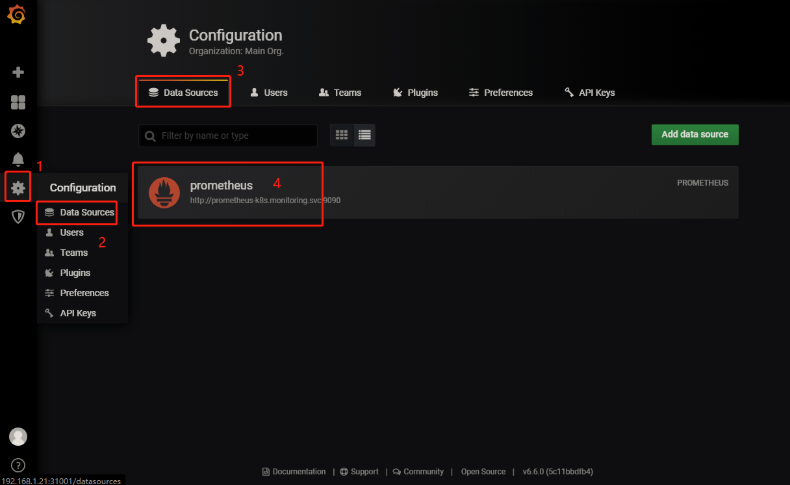
Click "import" successively to import the following three templates:
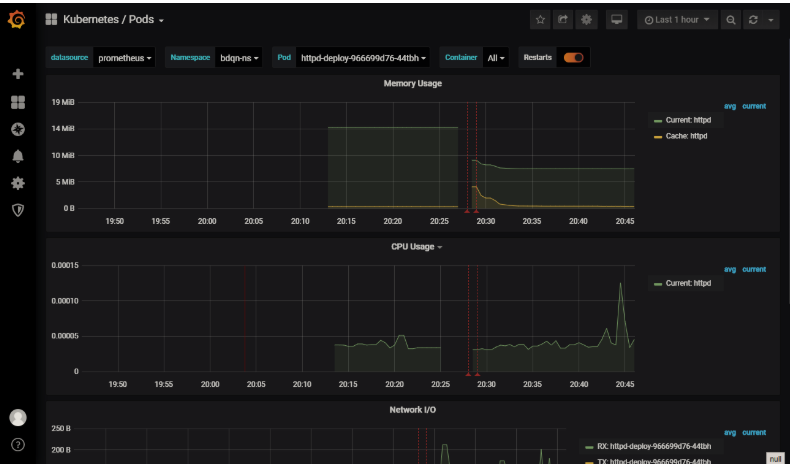
(2) Click below to view the monitoring status within the cluster
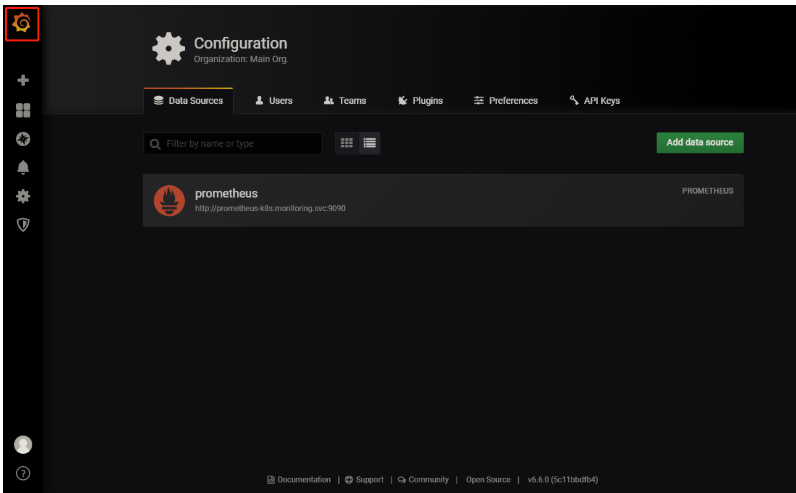
The monitoring status can be seen below