0 guidance
Objective: to master the ability of using 3D effect to express scientific and engineering data
Spread an idea: visualization technology is the eye of data
Content organization:
Scalar visualization and vector visualization of fluid data
Visualization example of 3D scanning data (model / terrain)
3D Earth scene visualization example
Visual example of interactive control of curve UI
1. Basic application
The main methods of visualization in scientific computing are as follows:
Two dimensional scalar data field: color mapping method, isoline method, stereogram method and hierarchical segmentation method
3D scalar data field: surface drawing method and volume drawing method
Vector data field: direct method (arrow, line segment, color wheel and other means to represent vector data), streamline method
Application fields: Earth Science, atmospheric science, medicine / life science, biology / molecular science, aviation / Aerospace / industry, chemical industry / chemistry, physics / mechanics, human / Archaeology, address exploration, etc
1.1 introduction to tvtk
The TVTK library is encapsulated with traits on top of the standard VTK library, so you can view the VTK library documents https://vtk.org/doc/nightly/html/annotated.html
The prefix vtk is removed from the class name in the TVTK Library
The function name uses underscores to connect words according to Python conventions, such as add item - > Add Item
The method of VTK object is replaced by the Trait attribute in TVTK, for example, m.SetInputConnection(c.GetOutputPort()) in VTK, m.input-u connection (c.output-u port) in TVTK
Installation:
conda install vtk
conda install numpy
conda install traits
conda install mayavi
conda install PyQt
Or from https://www.lfd.uci.edu/~gohlke/pythonlibs/ Download the pip installation of the application what file
Test after installation
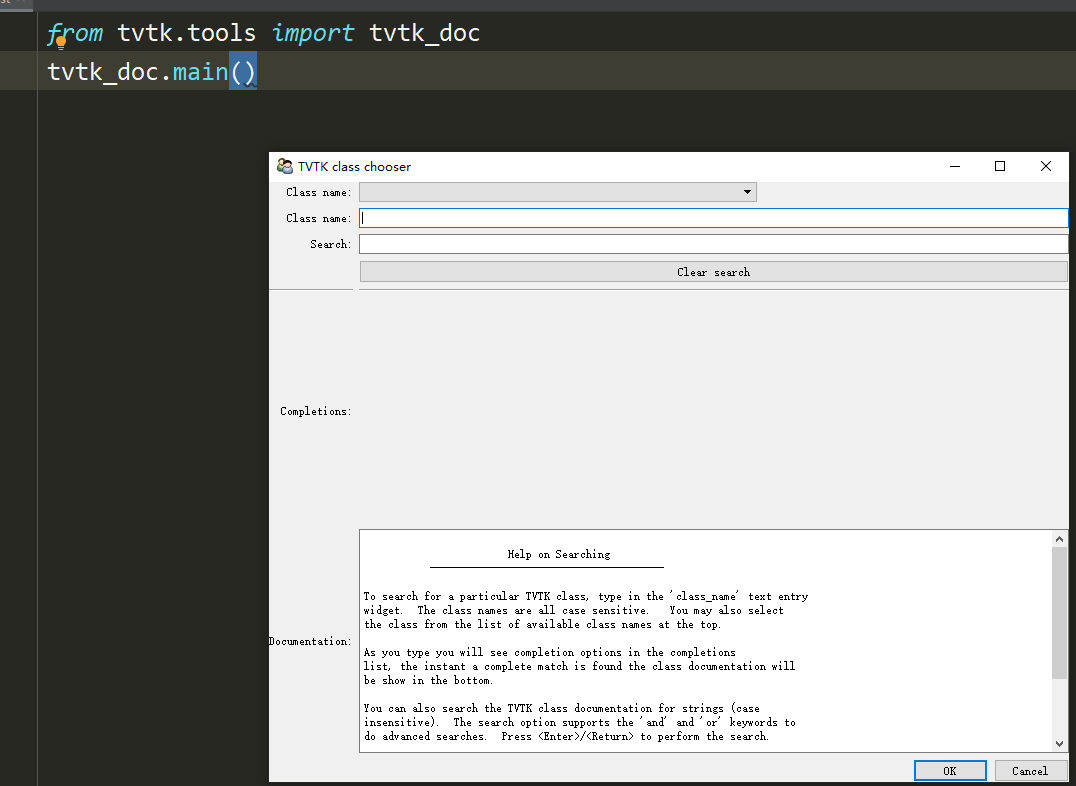
from tvtk.tools import tvtk_doc
tvtk_doc.main()
In[3]: from tvtk.api import tvtk
In[4]: s = tvtk.CubeSource(x_length=1.0,y_length=2.0,z_length=3.0)
In[5]: print(s)
vtkCubeSource (000001A7ACDECA70)
  Debug: Off
  Modified Time: 132
  Reference Count: 2
  Registered Events:
    Registered Observers:
      vtkObserver (000001A7B0699C20)
        Event: 33
        EventName: ModifiedEvent
        Command: 000001A7B097C560
        Priority: 0
        Tag: 1
  Executive: 000001A7B0418800
  ErrorCode: No error
  Information: 000001A7AD8034D0
  AbortExecute: Off
  Progress: 0
  Progress Text: (None)
  X Length: 1
  Y Length: 2
  Z Length: 3
  Center: (0, 0, 0)
  Output Points Precision: 0
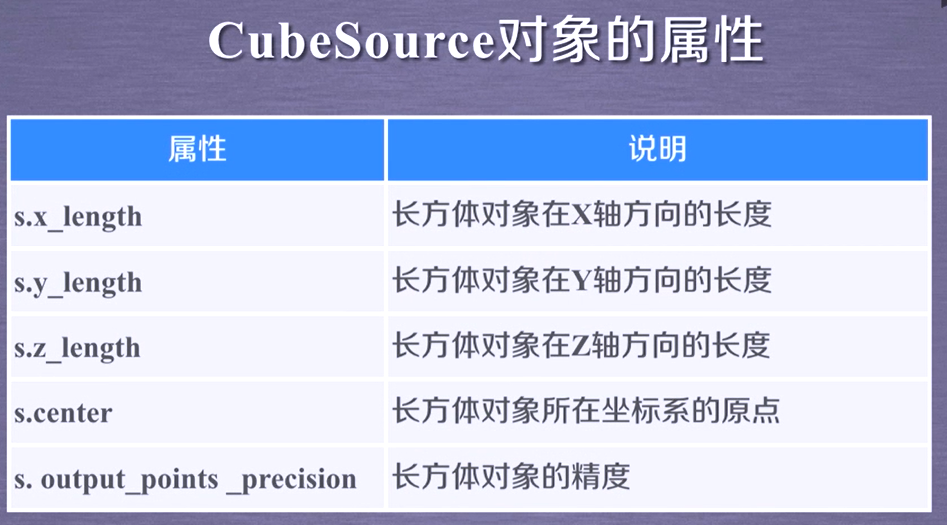
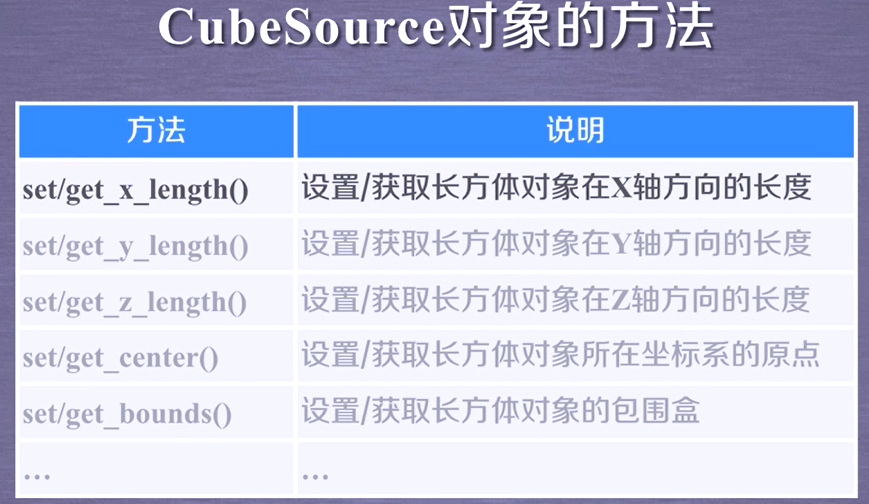
Create a basic 3D object
s = tvtk.CubeSource(traits)
s represents the object variable and returns a 3D object instance
tvtk.CubeSource is a constructor that constructs a box data source object with a certain traits attribute
What is traits? Attributes in English. Because python variables have no type, there are some inconveniences in actual operation. The traits library can add type definitions for python. Because tvtk is the encapsulation form of traits library on vtk, we can think of traits as the attributes of tvtk objects for a simpler understanding
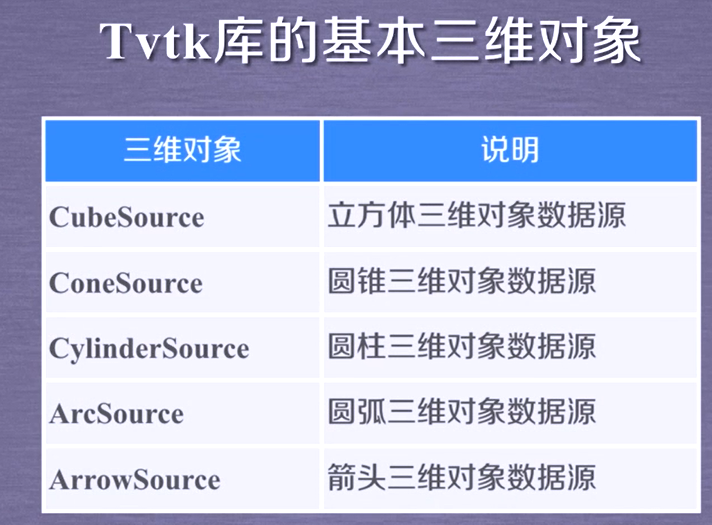
 In addition, tvtk has other basic 3D objects
 Try to build a cone data source
In[3]: from tvtk.api import tvtk
In[4]: s = tvtk.ConeSource(height=3.0,radius=1.0,resolution=36)
In[5]: s.height
Out[5]: 3.0
In[6]: s.radius
Out[6]: 1.0
In[7]: s.resolution
Out[7]: 36
In[8]: s.center
Out[8]: array([0., 0., 0.])
In[9]: print(s)
vtkConeSource (000002CC5566E290)
  Debug: Off
  Modified Time: 134
  Reference Count: 2
  Registered Events:
    Registered Observers:
      vtkObserver (000002CC572346C0)
        Event: 33
        EventName: ModifiedEvent
        Command: 000002CC573449D0
        Priority: 0
        Tag: 1
  Executive: 000002CC56FFA700
  ErrorCode: No error
  Information: 000002CC5722B540
  AbortExecute: Off
  Progress: 0
  Progress Text: (None)
  Resolution: 36
  Height: 3
  Radius: 1
  Capping: On
  Center: (0, 0, 0)
  Direction: (1, 0, 0)
  Output Points Precision: 0
Show a 3D object
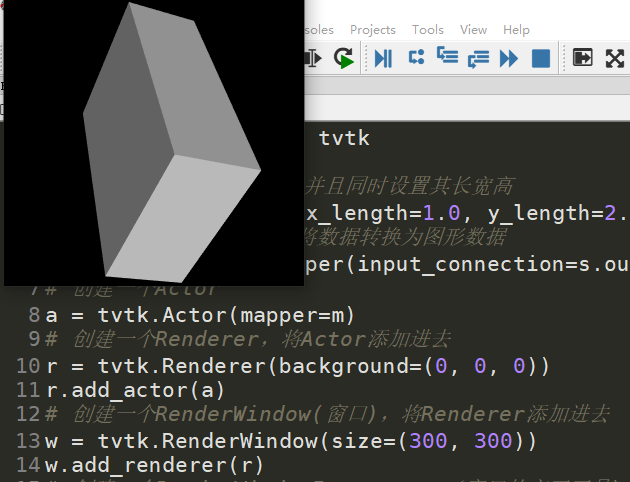
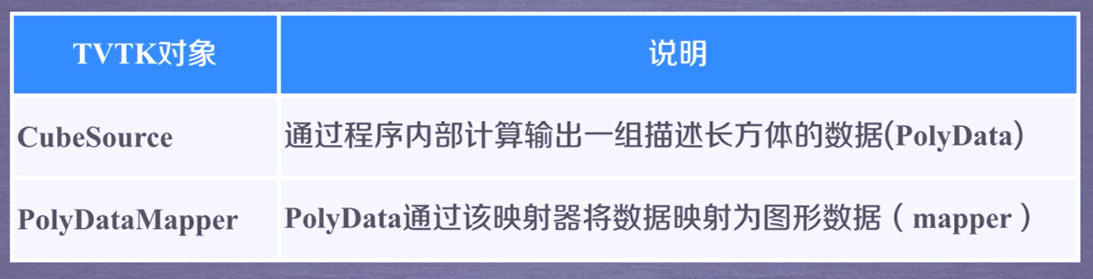
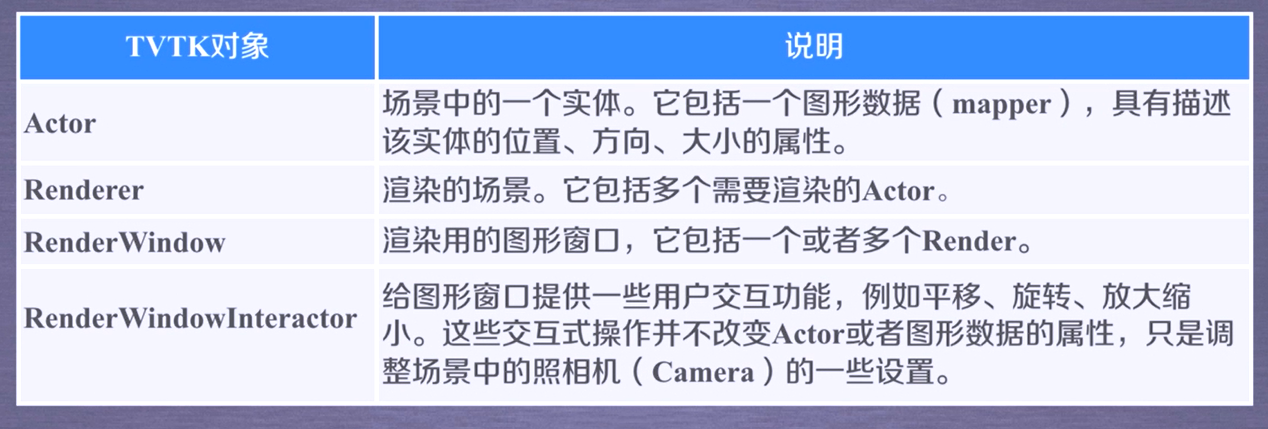
from tvtk.api import tvtk

# Create a box data source and set its length, width and height at the same time
s = tvtk.CubeSource(x_length=1.0, y_length=2.0, z_length=3.0)
# Using PolyDataMapper to convert data to drawing data
m = tvtk.PolyDataMapper(input_connection=s.output_port)
# Create an Actor
a = tvtk.Actor(mapper=m)
# Create a Renderer and add the Actor
r = tvtk.Renderer(background=(0, 0, 0))
r.add_actor(a)
# Create a renderwindow and add a Renderer to it
w = tvtk.RenderWindow(size=(300, 300))
w.add_renderer(r)
# Create a renderwindow interactive
i = tvtk.RenderWindowInteractor(render_window=w)
# Open interaction
i.initialize()
i.start()
What technology is used to transform cuboid data into 3D images?
Pipeline, the process of coordinating the work between objects, requires many TVTK objects to coordinate together, such as tvtk.CubeSource, tvtk.PolyDataMapper, tvtk.Actor, tvtk.Renderer, tvtk.RenderWindow, tvtk.RenderWindow actor
1.2 TVTK pipeline and data loading
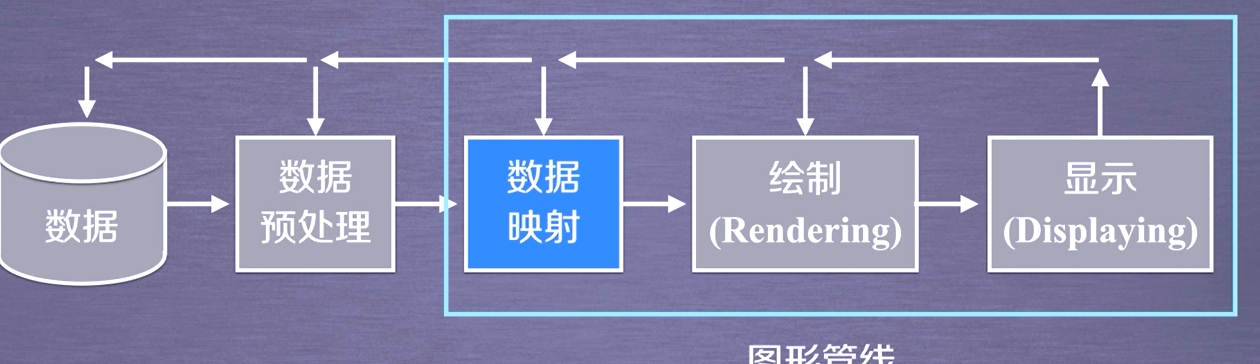
Basic process of pipeline
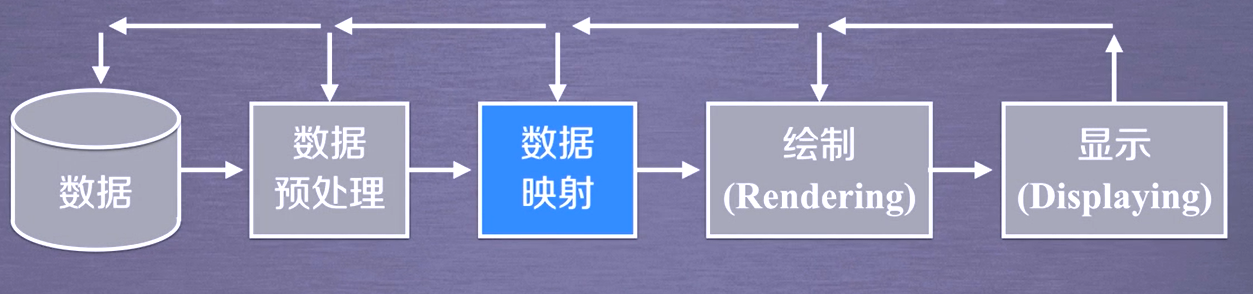
Almost all rendering engines involve pipeline technology, and TVTK pipeline is divided into two parts:
Visual pipeline: the process of processing original data into graphic data
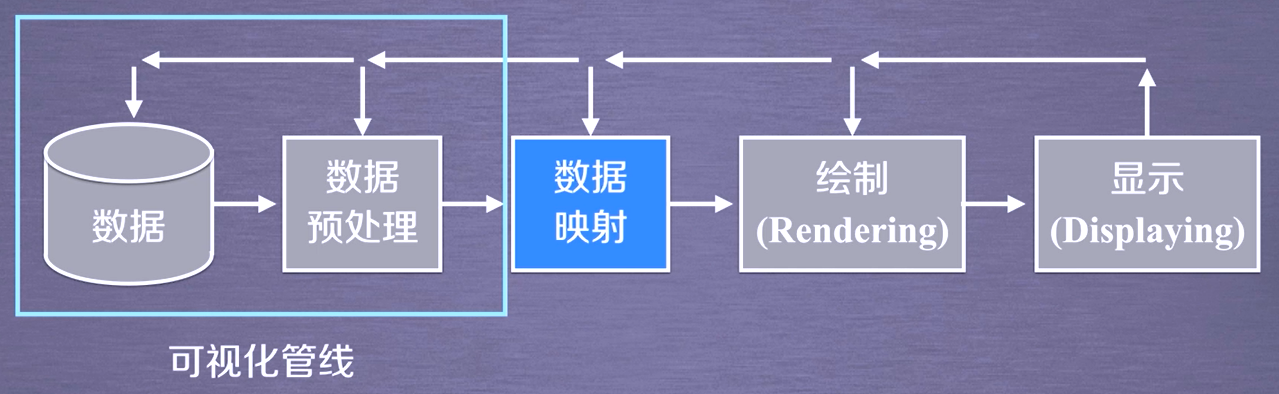
 Graphic pipeline: the process of processing graphic data into the image we see
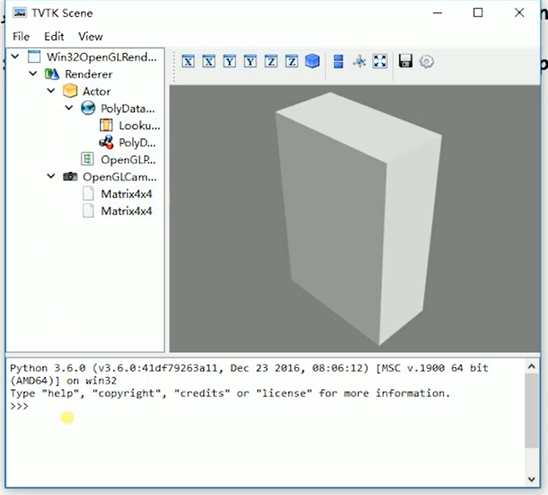
IVTK tool observation pipeline
from tvtk.api import tvtk
from tvtk.tools import ivtk
from pyface.api import GUI

s = tvtk.CubeSource(x_length=1.0, y_length=2.0, z_length=3.0)
m = tvtk.PolyDataMapper(input_connection=s.output_port)
a = tvtk.Actor(mapper=m)

#Create a window with a cust (Python Shell)
gui = GUI()
win = ivtk.IVTKWithCrustAndBrowser()
win.open()
win.scene.add_actor(a)

#Start interface message loop
gui.start_event_loop()
Because the version is too high, there is an error in the sentence from tvtk.tools import ivtk...
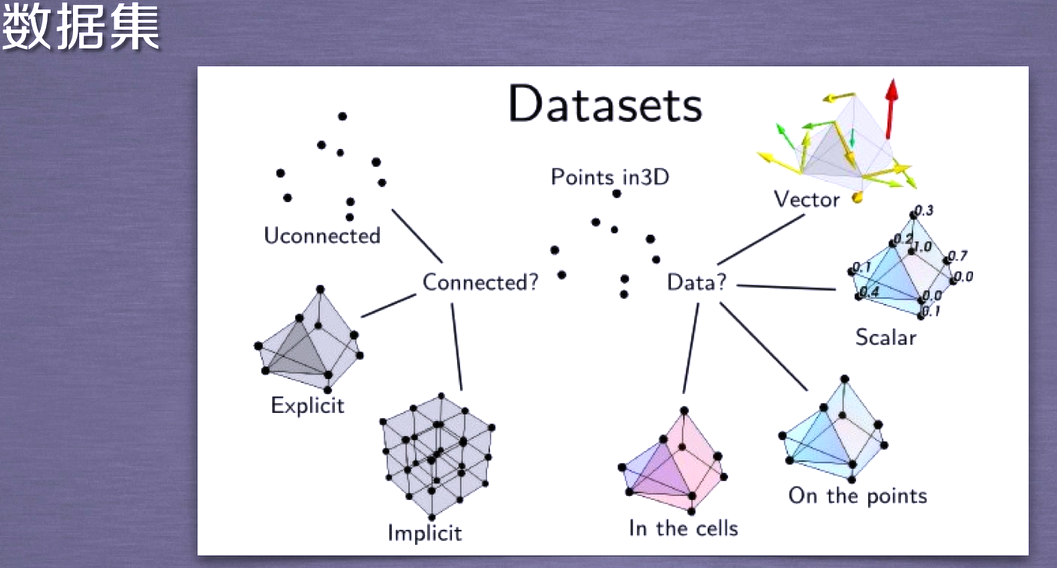
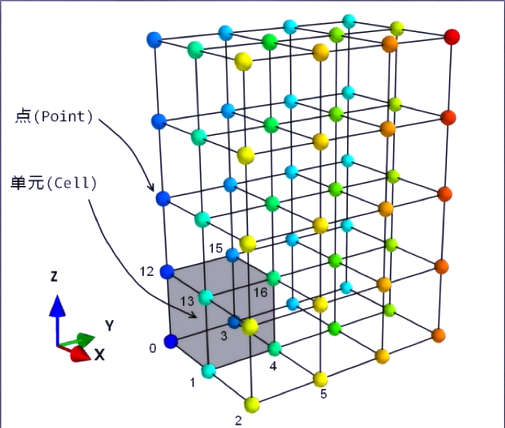
TVTK data set
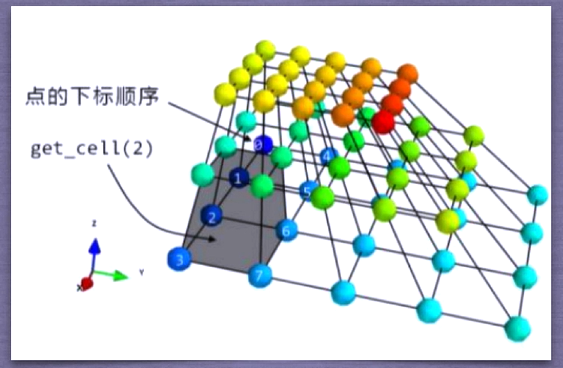
Data set, including point and data, points have connection and non connection relations, multiple related points constitute units, points have implicit connection and display, data has scalar and vector
 TVTK five data sets:
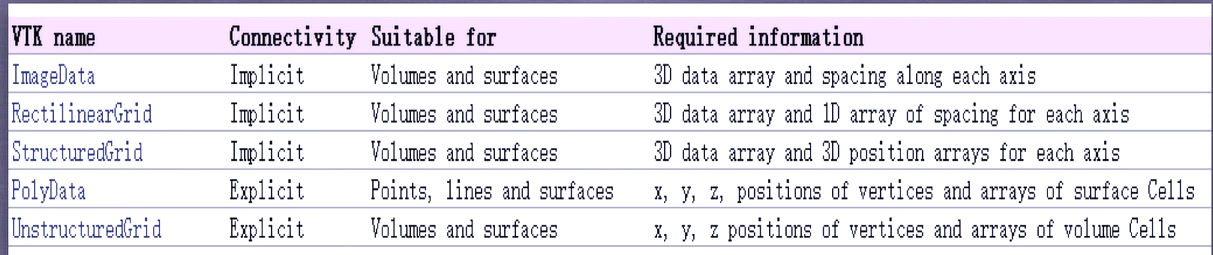
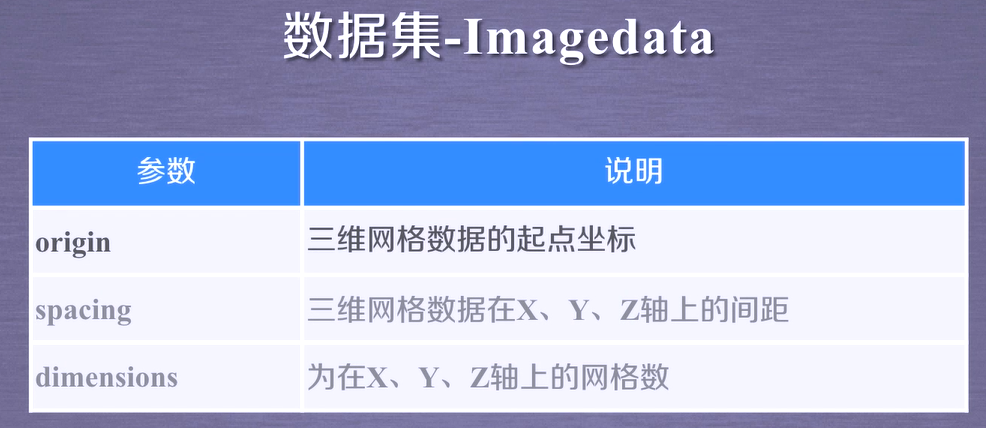
ImageData represents the data structure of two-dimensional or three-dimensional images, which can be simply understood as a two-dimensional or three-dimensional array. It is characterized by storing data in the array. The points are located on an orthogonal and equidistant grid. We do not need to give coordinates. The connection between the points is determined by their positions in the array. The connection between the points is implicit
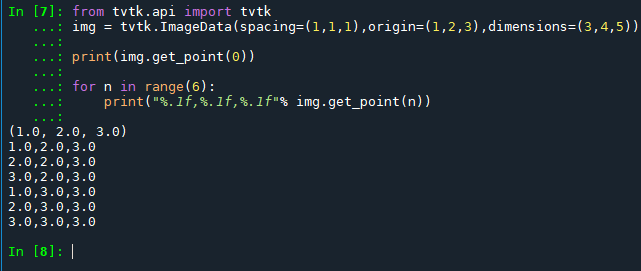
from tvtk.api import tvtk
img = tvtk.ImageData(spacing=(1,1,1),origin=(1,2,3),dimensions=(3,4,5))

print(img.get_point(0))

for n in range(6):
    print("%.1f,%.1f,%.1f"% img.get_point(n))
RectilinearGrid: grid with uneven spacing, all points on the orthogonal grid
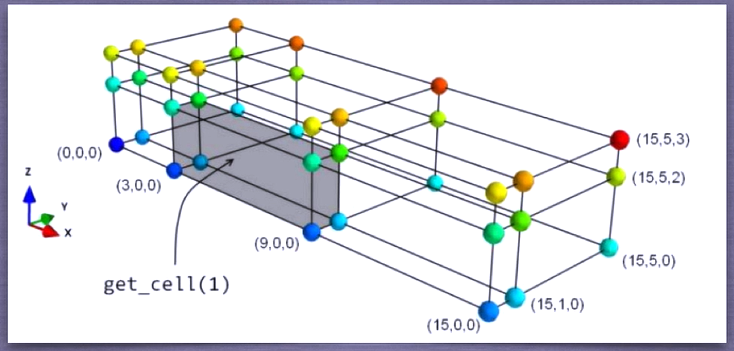 How to build
from tvtk.api import tvtk
import numpy as np

x = np.array([0,3,9,15])
y = np.array([0,1,5])
z = np.array([0,2,3])
r = tvtk.RectilinearGrid()
r.x_coordinates = x
r.y_coordinates = y
r.z_coordinates = z
r.dimensions = len(x),len(y),len(z)
You can also view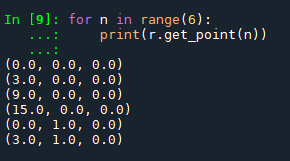 StructuredGrid: to create a mesh of any shape, you need to specify the coordinates of the points
 PolyData: a polygon composed of a series of points, the connection between points, and points

Because these information need to be set by the user, creating PolyData with the program is cumbersome. Many 3D models of TVTK can output PolyData objects
TVTK data loading
Most of the visualization data is not built in the TVTK library, but read the external data file through the interface
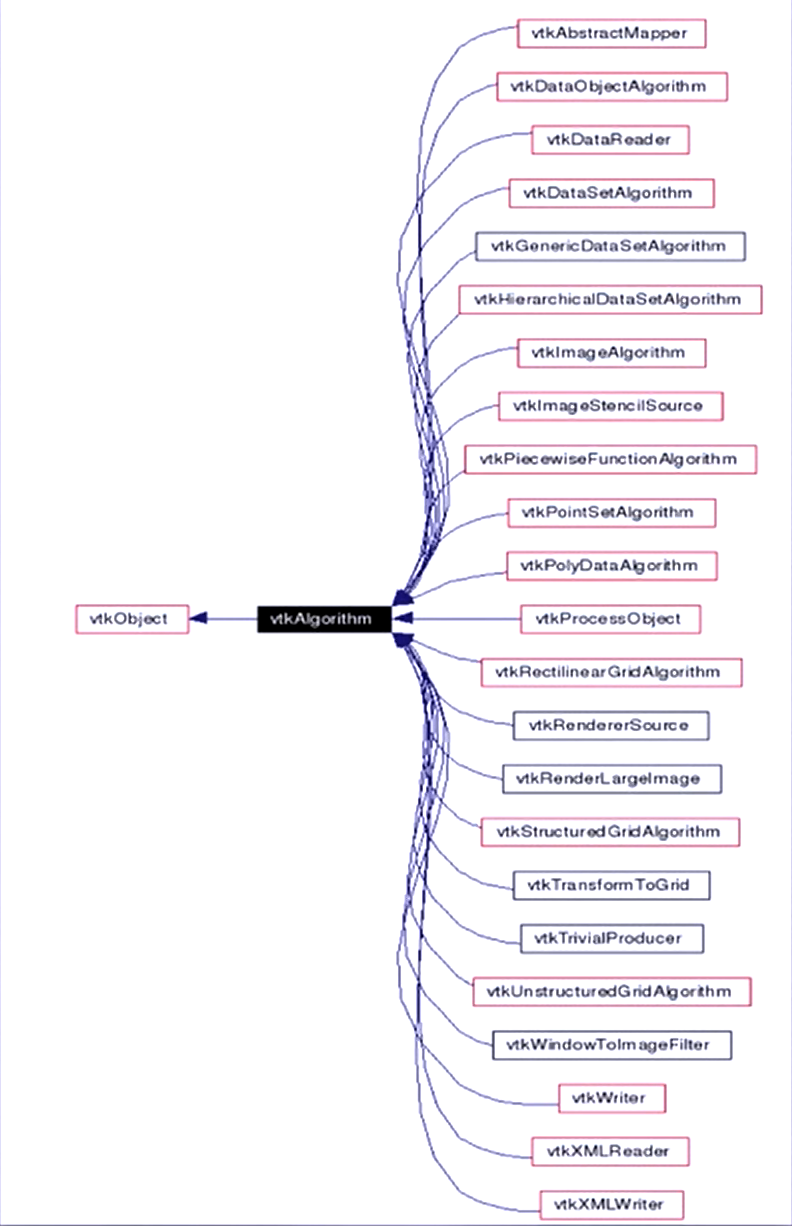
Inheritance relationship of TVTK Library
 VTK 3D model reading
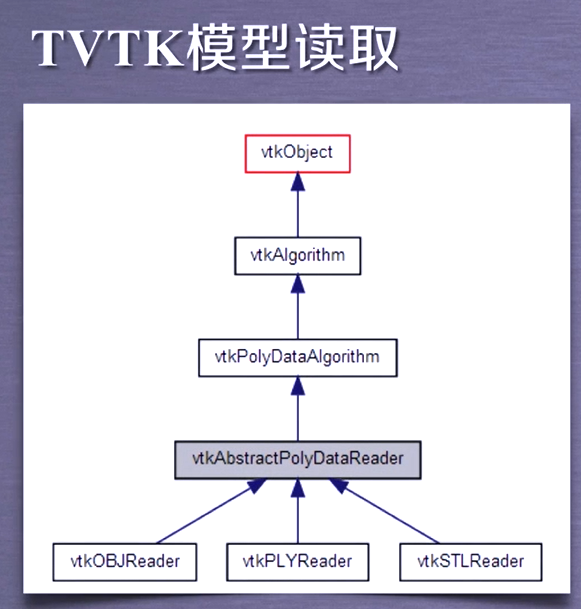 STL file is a file format used to represent triangle mesh in computer graphics application system. This format is very simple and widely used
from tvtk.api import tvtk
from tvtkfunc import ivtk_scene,event_loop

s = tvtk.STLReader(file_name = "python.stl")
m = tvtk.PolyDataMapper(input_connection = s.output_port)
a = tvtk.Actor(mapper = m)

win = ivtk_scene(a)
win.scene.isometric_view()
event_loop()
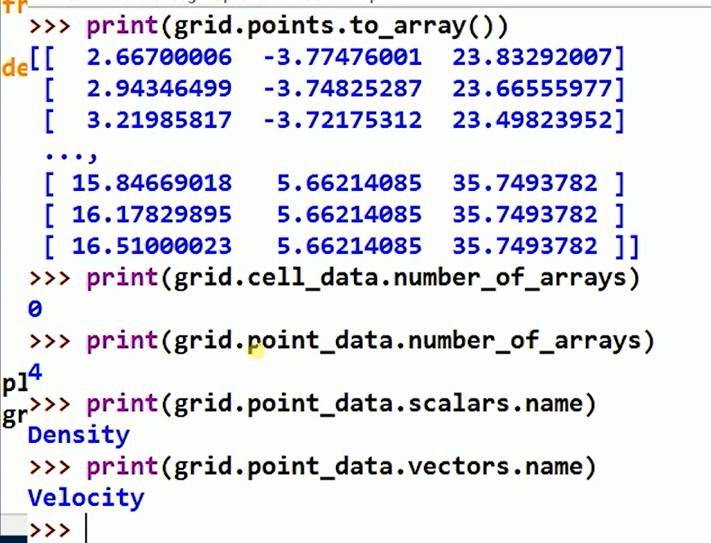
from tvtk.api import tvtk
def read_data():# read in data
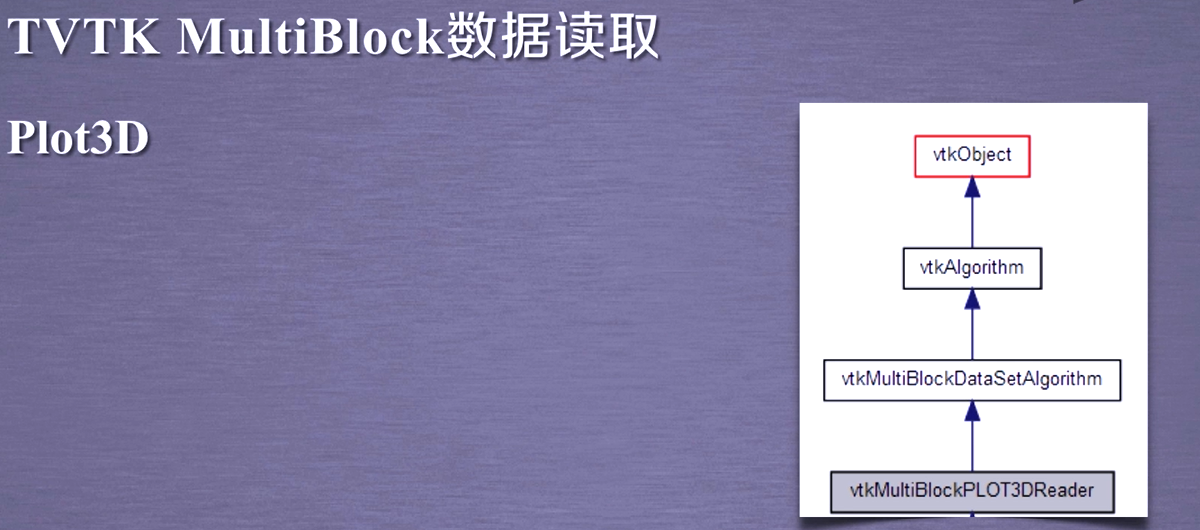
plot3d = tvtk.MultiBlockPLOT3DReader(
xyz_file_name="combxyz.bin",#Grid file
q_file_name="combq.bin",#Aerodynamic results file
scalar_function_number=100,#Set scalar data quantity
vector_function_number=200#Set the number of vector data
)
plot3d.update()
return plot3d
plot3d = read_data()
grid = plot3d.output.get_block(0)
 2
2