background
How springboot integrates Prometheus is not described in detail here. For an understanding of the integration process, refer to the blog: Spring Boot uses Micrometer integrated Prometheus to monitor Java application performance, Let me tell you a little bit about how long p99, p90 and other metrics we need to get for some monitoring metrics, such as the response time of http requests, p99, etc.
Micrometer
According to the number of objects monitored by the indicator, the purpose and the meaning of the monitoring, Micrometer indicator types can be generally divided into Gauge, Counter, Distribution Summary, Timer. Here I'll focus on Distribution Summary.
DistributionSummary
DistributionSummary is used to track the distribution of events and consists of several indicators:
- count, number of events, aggregation metrics, such as number of responses
- sum, synthesis, aggregation of indicators, such as response size synthesis
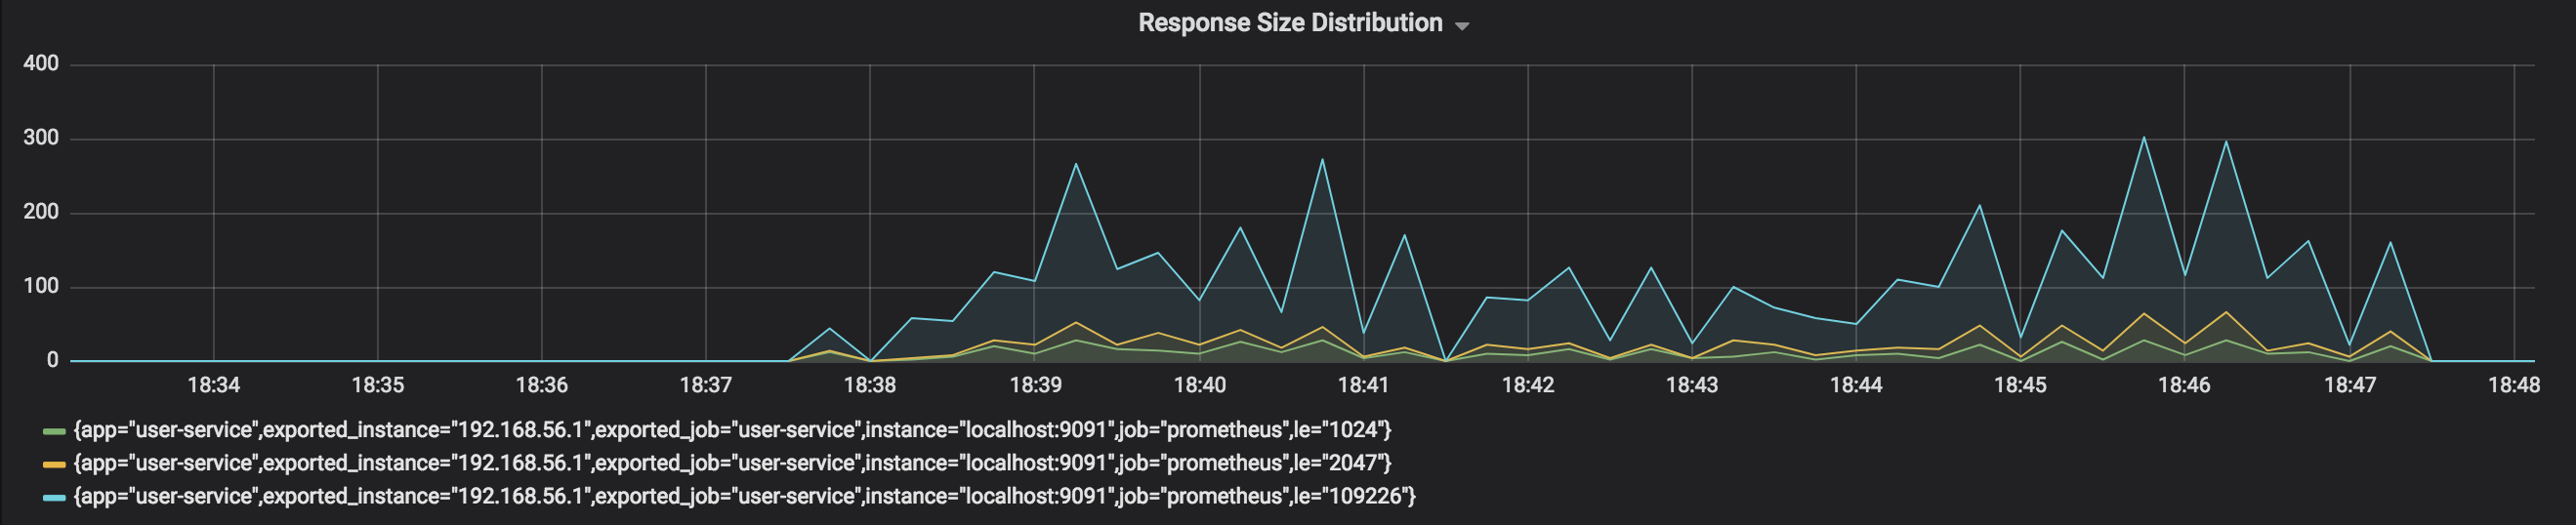
- histogram, distribution, aggregation indicator, containing Le tags to distinguish buckets, for exampleWeb.response.size.historgram {le=512} = 99, which means that the number of responses whose response size does not exceed 512 (Byte) is 99.There are generally multiple buckets, such as le=128, le=256, le=512, le=1024,le=+Inf, and so on. Each bucket is shown as a time series, and you get a graph similar to the one below.
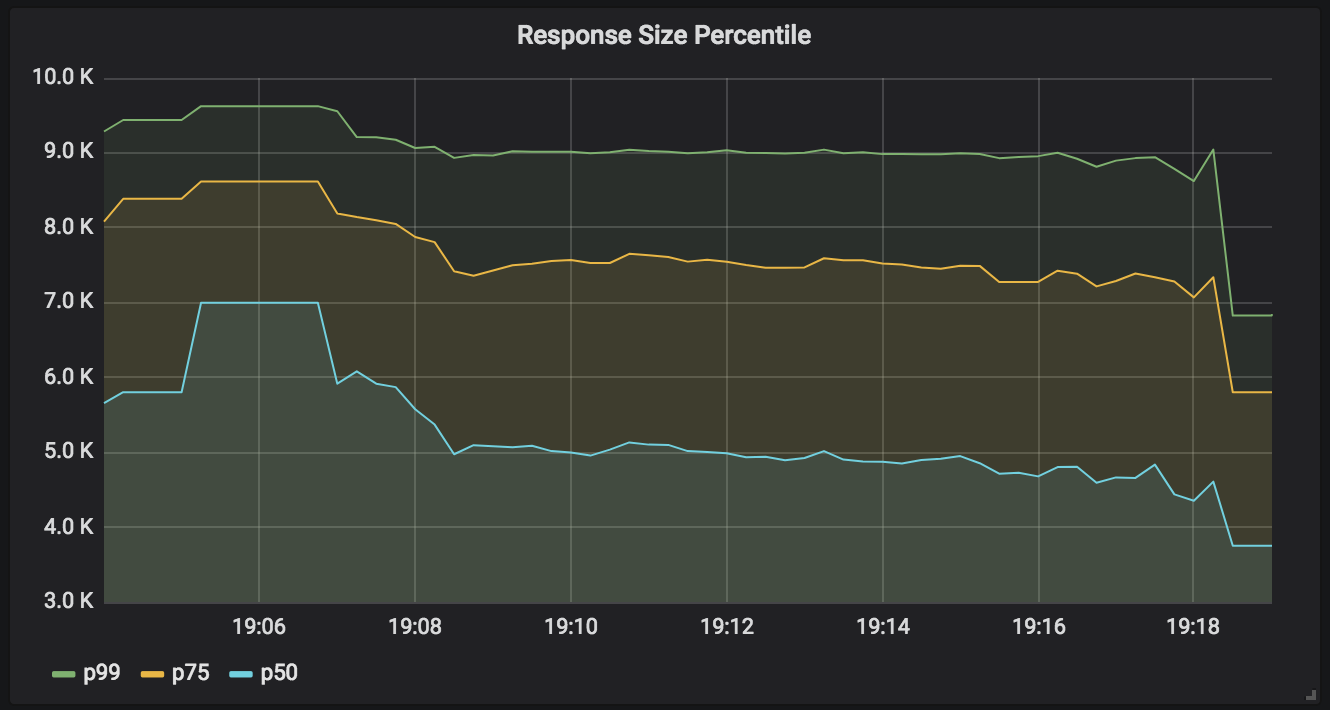
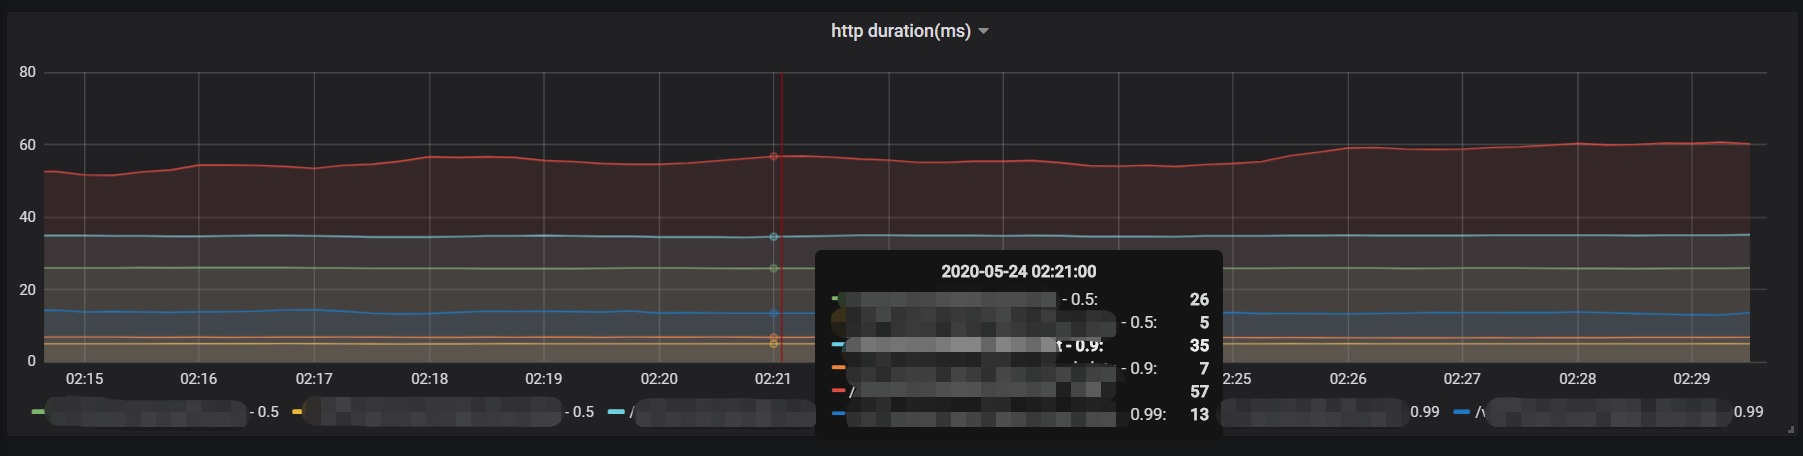
 percentile(quantile), percentile, aggregate indicator, contains percentile tags to distinguish between different percentiles, for exampleWeb.response.size.percentile{p=90) = 512, indicating that 90% of the response sizes are less than 512.There are usually multiple percentiles, such as p50,p75,p90,p99.
Each percentile is represented as a time series and you get a graph similar to the one below.
percentile(quantile), percentile, aggregate indicator, contains percentile tags to distinguish between different percentiles, for exampleWeb.response.size.percentile{p=90) = 512, indicating that 90% of the response sizes are less than 512.There are usually multiple percentiles, such as p50,p75,p90,p99.
Each percentile is represented as a time series and you get a graph similar to the one below.
 Timer
Timer is a specialization of Distribution Summary and is designed to be an indicator of a time class that converts the time value (duration) of a record into units.
Timer
Timer is a specialization of Distribution Summary and is designed to be an indicator of a time class that converts the time value (duration) of a record into units.
Exposure to histogram
 <dependency>
            <groupid>io.micrometer</groupid>
            <artifactid>micrometer-registry-prometheus</artifactid>
        </dependency>
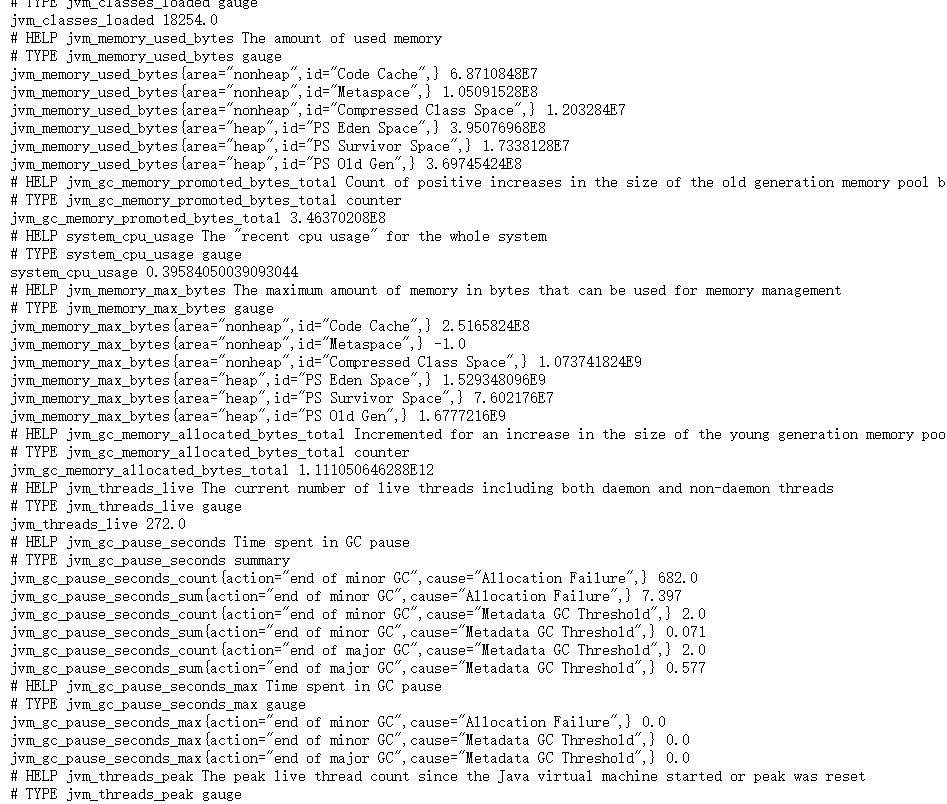
The prometheus library provides us with a lot of monitoring indicators, which can be accessed below http://localhost:8080/actuator/prometheus to see the monitoring information
 But by default these monitoring metrics are not Distribution Summary, so we need to replace the configuration and turn on the count switch at initialization as follows:
import io.micrometer.core.instrument.Meter; import io.micrometer.core.instrument.MeterRegistry; import io.micrometer.core.instrument.config.MeterFilter; import io.micrometer.core.instrument.distribution.DistributionStatisticConfig; import lombok.extern.slf4j.Slf4j; import org.springframework.boot.actuate.autoconfigure.metrics.MeterRegistryCustomizer; import org.springframework.context.annotation.Bean; import org.springframework.context.annotation.Configuration; import java.time.Duration; @Configuration @Slf4j public class MicrometerConfig { @Bean MeterRegistryCustomizer<meterregistry> metricsCommonTags() { return registry -> { registry.config().meterFilter( new MeterFilter() { @Override public DistributionStatisticConfig configure(Meter.Id id, DistributionStatisticConfig config) { if (id.getType() == Meter.Type.TIMER&&id.getName().matches("^(http|hystrix){1}.*")) { return DistributionStatisticConfig.builder() .percentilesHistogram(true) .percentiles(0.5, 0.90,0.95, 0.99) .sla(Duration.ofMillis(50).toNanos(), Duration.ofMillis(100).toNanos(), Duration.ofMillis(200).toNanos(), Duration.ofSeconds(1).toNanos(), Duration.ofSeconds(5).toNanos(), .minimumExpectedValue(Duration.ofMillis(1).toNanos()) .maximumExpectedValue(Duration.ofSeconds(5).toNanos()) .build() .merge(config); } else { return config; } } }); }; } }
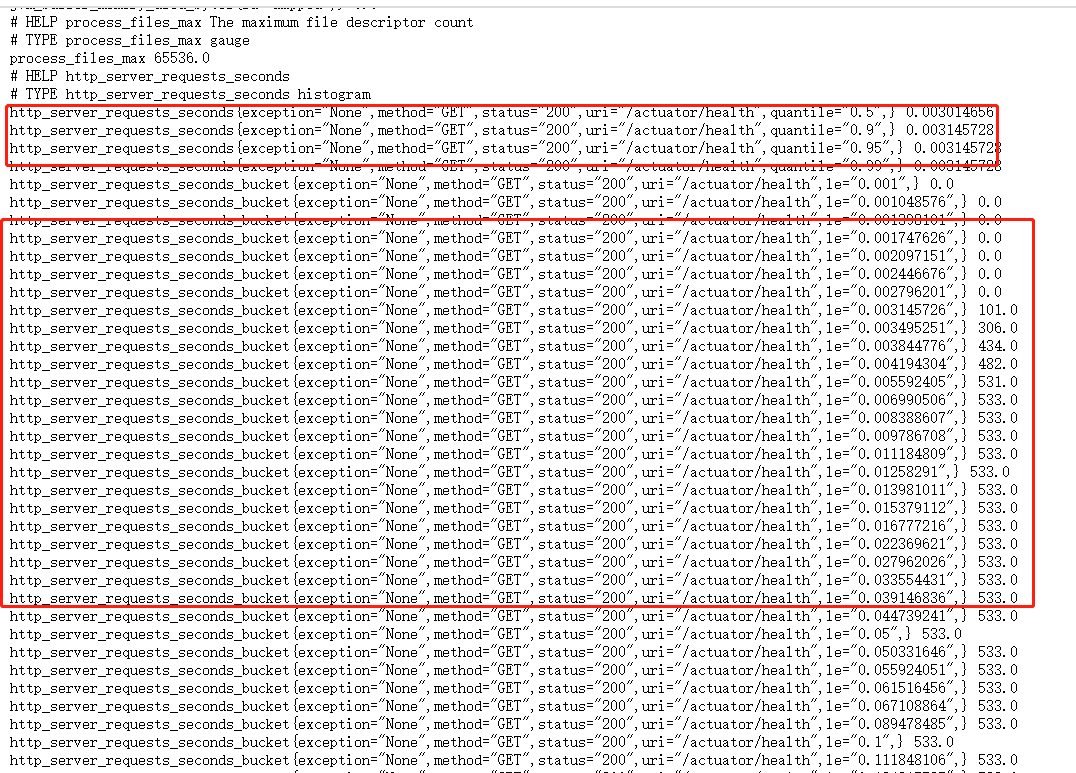
The above code exposes histogram information as needed, choosing the length of http response and hystrix response monitoring to expose histogram, without adding filter conditions if necessary.
You can see a lot more monitoring information when you open it:
Configure to grafana
avg(http_server_requests_seconds{service=~"$service" ,quantile =~ "0.9|0.5|0.99", uri !~ "/actuator.*|/health|/prometheus|root"}*1000 > 0) by (uri,quantile)
 </meterregistry>