How to get a core dump of a segment error on Linux
What is a segment error?
Segment fault refers to a situation in which your program attempts to access memory addresses that are not allowed. This may be due to:
- Attempt to dereference null pointer (you are not allowed to access memory address 0);
- Try to unquote other pointers that are not in your memory (LCTT translation: not in the legal memory address range);
- A C++ virtual table pointer (C++ vtable pointer) that has been destroyed and points to the wrong place, causing the program to attempt to execute instructions in memory that do not have permission to execute;
- Other things that I don't understand, such as I think accessing misaligned memory addresses can also lead to segment errors (LCTT Note: Segment errors are more likely to occur in architectures that require natural boundary alignment, such as MIPS, ARM).
This "C++ dummy table pointer" is a case where my program has made a segment error. I may explain this in a future blog, because I did not know anything about C++ at first, and I do not know what kind of dummy table lookup caused the segment error.
But! This blog post is not about C++ issues. Let's talk about the basics, like, how do we get a core dump?
Step 1: Run valgrind
I find the easiest way to find out why my program has a segment error is to use valgrind: I run it (not on my arm-linux)
valgrind -v your-program
This gives me a stack call sequence in case of failure. Simple!
But I also want to do a more in-depth investigation and find out something valgrind didn't tell me! So I want to get a core dump and explore it.
How to get a core dump
Core dump is a copy of your program's memory and is useful when you are trying to debug what went wrong with your problematic program.
When your program has a segment error, the Linux kernel sometimes writes a core dump to disk. When I first tried to get a core dump, I was very depressed for a long time because - Linux did not generate a core dump! Where is my core dump?
That's what I ultimately did: (This arm-linux can start instead)
1. Run ulimit-c unlimited before starting my program
2. Run sudo sysctl-w kernel.core_pattern=/tmp/core-%e.%p.%h.%t
ulimit: Set the maximum size of the core dump
Ulimit-c sets the maximum size of a core dump. It is often set to 0, which means the kernel will not write a core dump at all. It is set in kilobytes. ulimit is set per process - you can see the various resource constraints of a process by running cat/proc/PID/limit. (There is no cat on arm-linux)
For example, these are resource constraints for one of the random Firefox processes on my system:
$ cat /proc/6309/limits
Limit                     Soft Limit           Hard Limit           Units
Max cpu time              unlimited            unlimited            seconds
Max file size             unlimited            unlimited            bytes
Max data size             unlimited            unlimited            bytes
Max stack size            8388608              unlimited            bytes
Max core file size        0                    unlimited            bytes
Max resident set          unlimited            unlimited            bytes
Max processes             30571                30571                processes
Max open files            1024                 1048576              files
Max locked memory         65536                65536                bytes
Max address space         unlimited            unlimited            bytes
Max file locks            unlimited            unlimited            locks
Max pending signals       30571                30571                signals
Max msgqueue size         819200               819200               bytes
Max nice priority         0                    0
Max realtime priority     0                    0
Max realtime timeout      unlimited            unlimited            us
The kernel uses a soft limit when deciding how many core dump files to write (in this case, max core file size = 0). You can increase the soft limit to the hard limit using the shell built-in command ulimit (ulimit-c unlimited).
kernel.core_pattern: Where do core dumps reside?
The kernel.core_pattern is a kernel parameter, or "sysctl settings", that controls where the Linux kernel writes core dump files to disk.
Kernel parameters are a way to set your system's global settings. You can run sysctl-a to get a list of each kernel parameter, or use sysctl kernel.core_pattern to specifically view the kernel.core_patternsettings.
[root@RV1126_RV1109 /userdata/ky_ai_camera_error_test]# sysctl kernel.core_pattern
kernel.core_pattern = /tmp/core-%e.%p.%h.%t
[root@RV1126_RV1109 /userdata/ky_ai_camera_error_test]#
So sysctl-w kernel.core_pattern=/tmp/core-%e.%p.%h.%t saves t h e core dump under directory/tmp with a suffix of core plus a series of parameters that identify t h e (failing) process.
If you want to know what these parameters like%e and%p mean, please refer to man core.
(👇A little hard to understand)
Naming of core dump files:

By default, the core dump file name is core,But it can be set /proc/sys/kernel/core_pattern File (from Linux 2.6 And 2.4.21 To define a template for naming core dump files. Templates can include % Specifiers, which are replaced with the following values when the core file is created:

           %% single % Character.
           %c Core file size soft resource limit for crash process (from Linux 2.6.24).
           %d Dump Mode - and prctl(2) PR_GET_DUMPABLE The returned values are the same (from Linux 3.7 Up).
           %e Of a process or thread comm Value, usually the same as the executable name (no path prefix and truncated to a maximum of 15 characters), but may have been modified to something different; see proc(5) To /proc/[pid]/comm and /proc/[pid]/task/[tid]/comm Discussion.
           %E Path name of executable, slash ('/') Replace with exclamation mark ('!')(since Linux 3.0 Up).
           %g Dump process digital truthfulness GID.
           %h Host name (with uname(2) The node names returned are the same.
           %i Threads triggering core dumps TID,Such as where the thread is located PID As seen in the namespace (from Linux 3.18 Up).
           %I Threads triggering core dumps TID,As initial PID As shown in the namespace (from Linux 3.18 Up).
           %p Dump process PID,Such as where the process is located PID As seen in the namespace.
           %P Dump process PID,As initial PID As shown in the namespace (from Linux 3.12 Up).
           %s Number of signals causing dump.
           %t Dump time, expressed as seconds since epoch, 1970-01-01 00:00:00 +0000 (UTC).
           %u Dump process digital truthfulness UID.
It's important that kernel.core_pattern is a global setting -- it's best to be careful when modifying it, because other system functionality may depend on setting it to a specific way (to work properly).
Kernel.core_patternand Ubuntu
By default, in ubuntu systems, the kernel.core_pattern is set to the following values:
$ sysctl kernel.core_pattern
kernel.core_pattern = |/usr/share/apport/apport %p %s %c %d %P
(Yes, of course)

This confuses me (what does this apport do, and what does it do with my core dump?). Here's what I know about it:
- Ubuntu uses a system called apport to report crash information about apt packages.
- Setting kernel.core_pattern=|/usr/share/apport/apport%p%s%c%d%P means that the core dump will be piped to the apport program.
- The log of the apport is saved in the file/var/log/apport.log.
- apport ignores crash information from binaries that are not part of the Ubuntu package by default
Ultimately, I just skipped t h e apport and reset t h e kernel.core_pattern to sysctl-w kernel.core_pattern=/tmp/core-%e.%p.%h.%t because I'm on a developer and I don't care if t h e apport works or if I try to have it dump my core to disk.
Now that you have a core dump, what's next?
Okay, now we know ulimit and kernel.core_pattern, and there's actually a core dump file in the disk's / tmp directory. Great! What's going on? We still don't know why this program has a segment error!
The next step is to use gdb to open the core dump file and get the stack call sequence.
(View my core dump file and copy it to pc-linux)
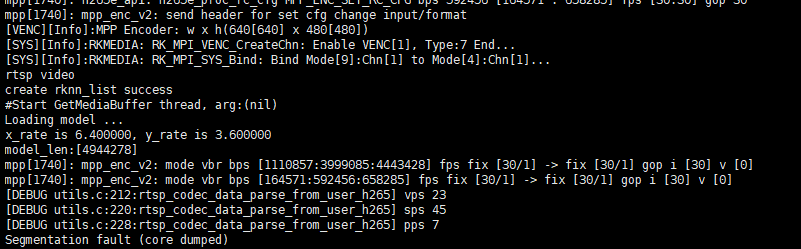
Run the error-reporting program first
[root@RV1126_RV1109 /userdata/ky_ai_camera_error_test]# ./run.sh
After one output
......
Then we open the / tmp directory in the root directory to see if there is our dump file core-ky_ai_rtsp_ssd.1740.RV1126_RV1109.172780
[root@RV1126_RV1109 /tmp]# ls -lah
total 20M
drwxr-xr-x  4 root root  200 Jan  2 23:59 .
drwxr-xr-x 30 root root 4.0K Jan  2 23:20 ..
-rwxr-xr-x  1 root root   11 Jan  1 00:00 .usb_config
-rwxr-xr-x  1 root root  65K Jan  1 00:16 cl_viv_vx_ext.h
-rw-------  1 root root 234M Jan  2 23:59 core-ky_ai_rtsp_ssd.1740.RV1126_RV1109.172780
----------  1 root root    6 Jan  3 00:26 loglevel
-rw-r--r--  1 root root 1.2K Jan  1 00:00 mountall.log
drwx------  2 root root   40 Jan  1 00:00 tmp.me4T9JcnbC
-rwxr-xr-x  1 root root 147K Jan  1 00:00 upgrade_tool
drwxrwxrwx  5 1004 1004  300 Jan  1 00:00 webs
Copy the dump file to pc-linux using xftp and place it in the folder arnold_core_dump_analysis:
[root@ubuntu /home/yg/rv/sdk/rv1.8/arnold_core_dump_analysis]18# ls -lah
 Total usage 234 M
drwxr-xr-x 2 yg hhh 4.0K Oct  2 16:35 .
drwxrwxrwx 6 yg hhh 4.0K Oct  2 16:34 ..
-rw-r--r-- 1 yg hhh 234M Oct  2 16:35 core-ky_ai_rtsp_ssd.1740.RV1126_RV1109.172780
Get stack call sequence from gdb
You can open a core dump file with gdb like this:
$ gdb -c my_core_file
I open it like this:
[root@ubuntu /home/yg/rv/sdk/rv1.8/arnold_core_dump_analysis]19# gdb -c core-ky_ai_rtsp_ssd.1740.RV1126_RV1109.172780
GNU gdb (Ubuntu 7.11.1-0ubuntu1~16.5) 7.11.1
Copyright (C) 2016 Free Software Foundation, Inc.
License GPLv3+: GNU GPL version 3 or later <http://gnu.org/licenses/gpl.html>
This is free software: you are free to change and redistribute it.
There is NO WARRANTY, to the extent permitted by law.  Type "show copying"
and "show warranty" for details.
This GDB was configured as "x86_64-linux-gnu".
Type "show configuration" for configuration details.
For bug reporting instructions, please see:
<http://www.gnu.org/software/gdb/bugs/>.
Find the GDB manual and other documentation resources online at:
<http://www.gnu.org/software/gdb/documentation/>.
For help, type "help".
Type "apropos word" to search for commands related to "word".

warning: Couldn't find general-purpose registers in core file.

warning: Unexpected size of section `.reg2' in core file.
Core was generated by `./ky_ai_rtsp_ssd -a /opt/sbin/iqfiles -p model/rv1109_rv1126/yolov5s_relu_rv110'.

warning: Couldn't find general-purpose registers in core file.

warning: Unexpected size of section `.reg2' in core file.
#0  <unavailable> in ?? ()
(gdb)
Tip warning: Couldn't find general-purpose registers in core file. Go online to find out that the gdb version is too low and upgrade to the next gdb version
old yuan Solve the problem temporarily, do not upgrade next gdb And view the core dump for a while
How to get a core dump of a segment error on Linux
Next, we want to know what the stack looks like when the program crashes. Running bt at the gdb prompt gives you a backtrace. In my case, gdb doesn't load symbolic information for binaries, so these function names look like'??'. Fortunately, (we fixed it by) loading symbols.
Here's how to load debug symbols.
symbol-file /path/to/my/binary
sharedlibrary
This loads symbols from binaries and any shared libraries they reference. Once I do this, when I execute bt, gdb gives me a nice stack trace with line numbers!
If you want it to work, binaries should be compiled with debug symbol information. Line numbers in the stack trace can be very helpful when trying to find out the cause of a program crash.😃