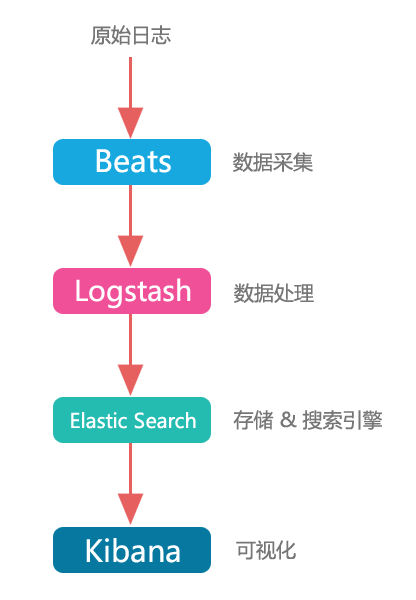
Elasticsearch is used to search for and analyze data.
Kibana is used to present data.
Beats are used to collect data.
Logstash is used to centralize, transform, and store data.
The main flow of processing the log is the following (forgot where to find the graph):
Build ELK with Docker
New Profile
Under the elastic/config directory, create a configuration file for ElasticSearch:
1 2 3 | # es01.yml cluster.name: "docker-cluster" network.host: 0.0.0.0 |
Create a configuration file for kibnana in the same directory:
1 2 3 4 5 6 7 | # kib01.yml server.host: "0" elasticsearch.hosts: [ "http://elasticsearch:9200" ] monitoring.ui.container.elasticsearch.enabled: true xpack.encryptedSavedObjects.encryptionKey: b014b39f62fd1d9a0b1dac766c0e51f5 xpack.reporting.encryptionKey: 9e069cbc6b68796799f96f057ce6c5f5 xpack.security.encryptionKey: 1e0cf9eb23cbfd00d8ba113cb5327bb5 |
In the elastic/config/logstash directory, create the logstash configuration file:
1 2 3 4 5 6 7 | # logstash.yml http.host: "0.0.0.0" xpack.monitoring.elasticsearch.hosts: [ "https://es01:9200" ] xpack.monitoring.enabled: true xpack.monitoring.elasticsearch.username: elastic xpack.monitoring.elasticsearch.password: TsfYfefVTuDfwDg3IITK xpack.monitoring.elasticsearch.ssl.certificate_authority: /usr/share/elasticsearch/config/certificates/ca/ca.crt |
In the same directory, create a configuration file for the logstash management pipeline:
1 2 3 4 5 6 7 8 | # pipelines.yml # This file is where you define your pipelines. You can define multiple. # # For more information on multiple pipelines, see the documentation: # # https://www.elastic.co/guide/en/logstash/current/multiple-pipelines.html # - pipeline.id: main path.config: "/usr/share/logstash/pipeline" |
Under the elastic/config/logstash/pipeline directory, create the logstash collector configuration file:
1 2 3 4 5 6 7 8 9 10 11 12 13 14 15 16 17 18 19 | |
Ready to create docker-compose file
Create instances.yml file in the elastic/config/elasticsearch/certificaes directory:
1 2 3 4 5 6 7 8 9 10 11 12 13 14 15 16 17 18 19 20 | |
Under the elastic directory, create the authenticated file:
1 2 3 4 5 6 7 8 9 10 11 12 13 14 15 16 17 18 19 20 21 22 23 24 25 26 27 28 29 30 | |
In the same directory, create environment files to facilitate unified management of docker versions:
1 2 3 4 | # .env COMPOSE_PROJECT_NAME=es CERTS_DIR=/usr/share/elasticsearch/config/certificates # This is the location inside the docker container VERSION=7.13.4 |
In the same directory, create a docker-compose file:
1 2 3 4 5 6 7 8 9 10 11 12 13 14 15 16 17 18 19 20 21 22 23 24 25 26 27 28 29 30 31 32 33 34 35 36 37 38 39 40 41 42 43 44 45 46 47 48 49 50 51 52 53 54 55 56 57 58 59 60 61 62 63 64 65 66 67 68 69 70 71 72 73 74 75 76 77 78 79 80 81 82 83 84 85 86 87 88 89 90 91 92 93 94 95 96 97 98 99 100 101 102 | |
It is recommended to pull the docker file from the official, but the official web address is slower and can be downloaded from other mirror repositories instead, such as [docker.elastic.co/kibana/kibana:${VERSION}].http://docker.elastic.co/kibana/kibana:${VERSION}) The official address prefix is removed and turned into kibana:${VERSION}, similar to other images.
Configure authentication and launch ELK
First create the certification:
1 | $ docker-compose -f create-certs.yml run --rm create_certs |
Start all services:
1 | $ docker-compose -f elastic-docker-tls.yml up -d |
Generate user password:
1 2 | $ docker exec es01 /bin/bash -c "bin/elasticsearch-setup-passwords \ auto --batch --url https://es01:9200" |
Record the generated password, copy the password of kibana_system to ELASTICSEARCH_PASSWORD of kib01 in the elastic-docker-tls.yml file, and copy the password of logstash_system to ELASTICSEARCH_PASSWORD of logstash in the elastic-docker-tls.yml file.
Stop docker-compose:
1 | $ docker-compose -f elastic-docker-tls.yml stop |
Start docker-compose again.
After successful startup, use the command docker network inspects_elastic to see that the applications are connected to the same network.
Check that logstash started properly and check the log for error s by commanding docker logs logstash.
Spring Integrated ELK
The Spring-generated log is sent to logstash, which filters the data, sends it to elasticsearch, and views the data through kibnana.
Add Dependency
Spring uses logback, which was meant to use log4j but failed to integrate.
Add logstash dependencies (core), lombok and spring-boot-starter-web:
1 2 3 4 5 6 7 8 9 10 11 12 13 14 15 16 17 | |
Detailed use of integrated logstash can be referred to:
GitHub - logstash/logstash-logback-encoder: Logback JSON encoder and appenders
Project Configuration
Configuration log configuration file logback.xml, placed under src/main/resource:
1 2 3 4 5 6 7 8 9 10 11 12 13 14 15 16 17 18 19 20 21 22 | |
<destination>127.0.0.1:4560</destination>logstash IP and the exposed port through which logback sends the log to logstash.
And configure the log output level and log profile location in the application.properties file:
1 2 3 | # application.properties logging.level.root=info logging.config=classpath:logback.xml |
Code for printing logs:
1 2 3 4 5 6 7 8 9 10 11 12 13 14 15 16 17 18 19 20 | |
logstash configuration
The logstash.conf configuration collector was actually configured earlier. You need to restart logstash after changing the configuration:
1 2 3 4 5 6 7 8 9 10 11 12 13 14 15 16 17 18 19 | |
view log
You can see the received log in logstash.
Next, sign in to kibana with the account elastic athttp://ip:5601
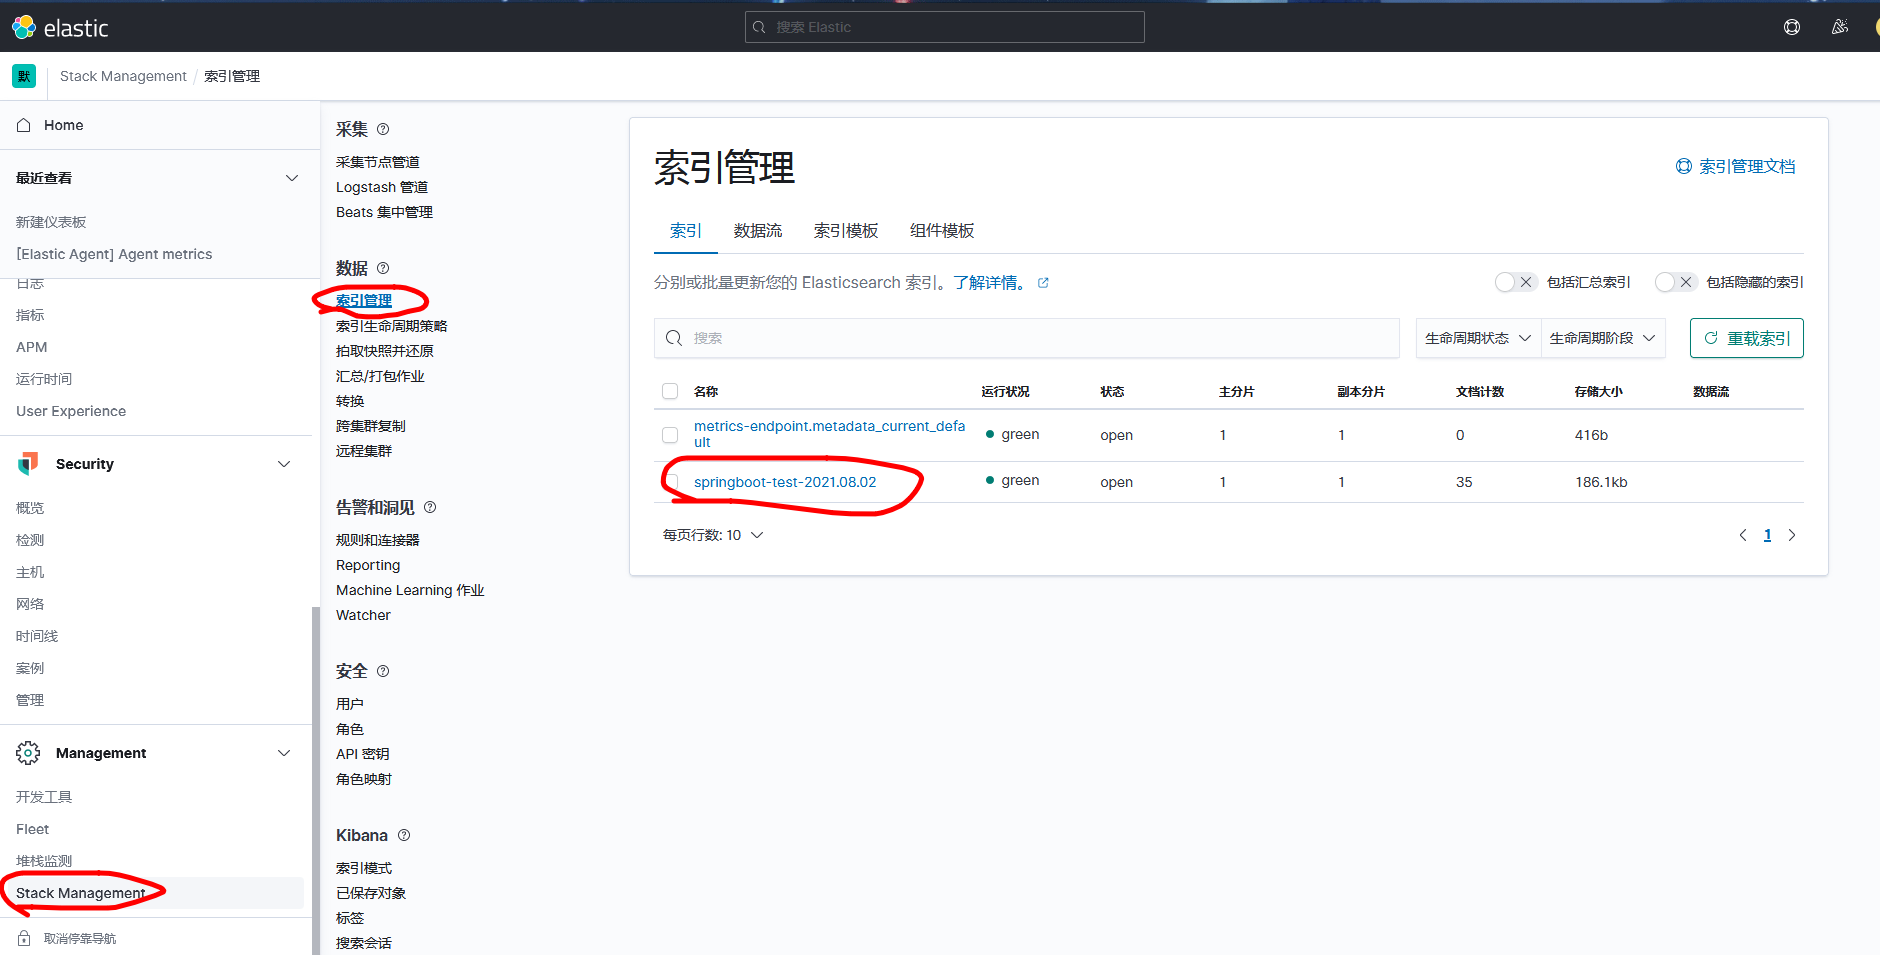
You can see the incoming data in index management.
Then go to index mode, create index mode

The index name is the same as the index in output in logstash.conf. Select @timestamp at the time filter field name to facilitate filtering data by time period later on.
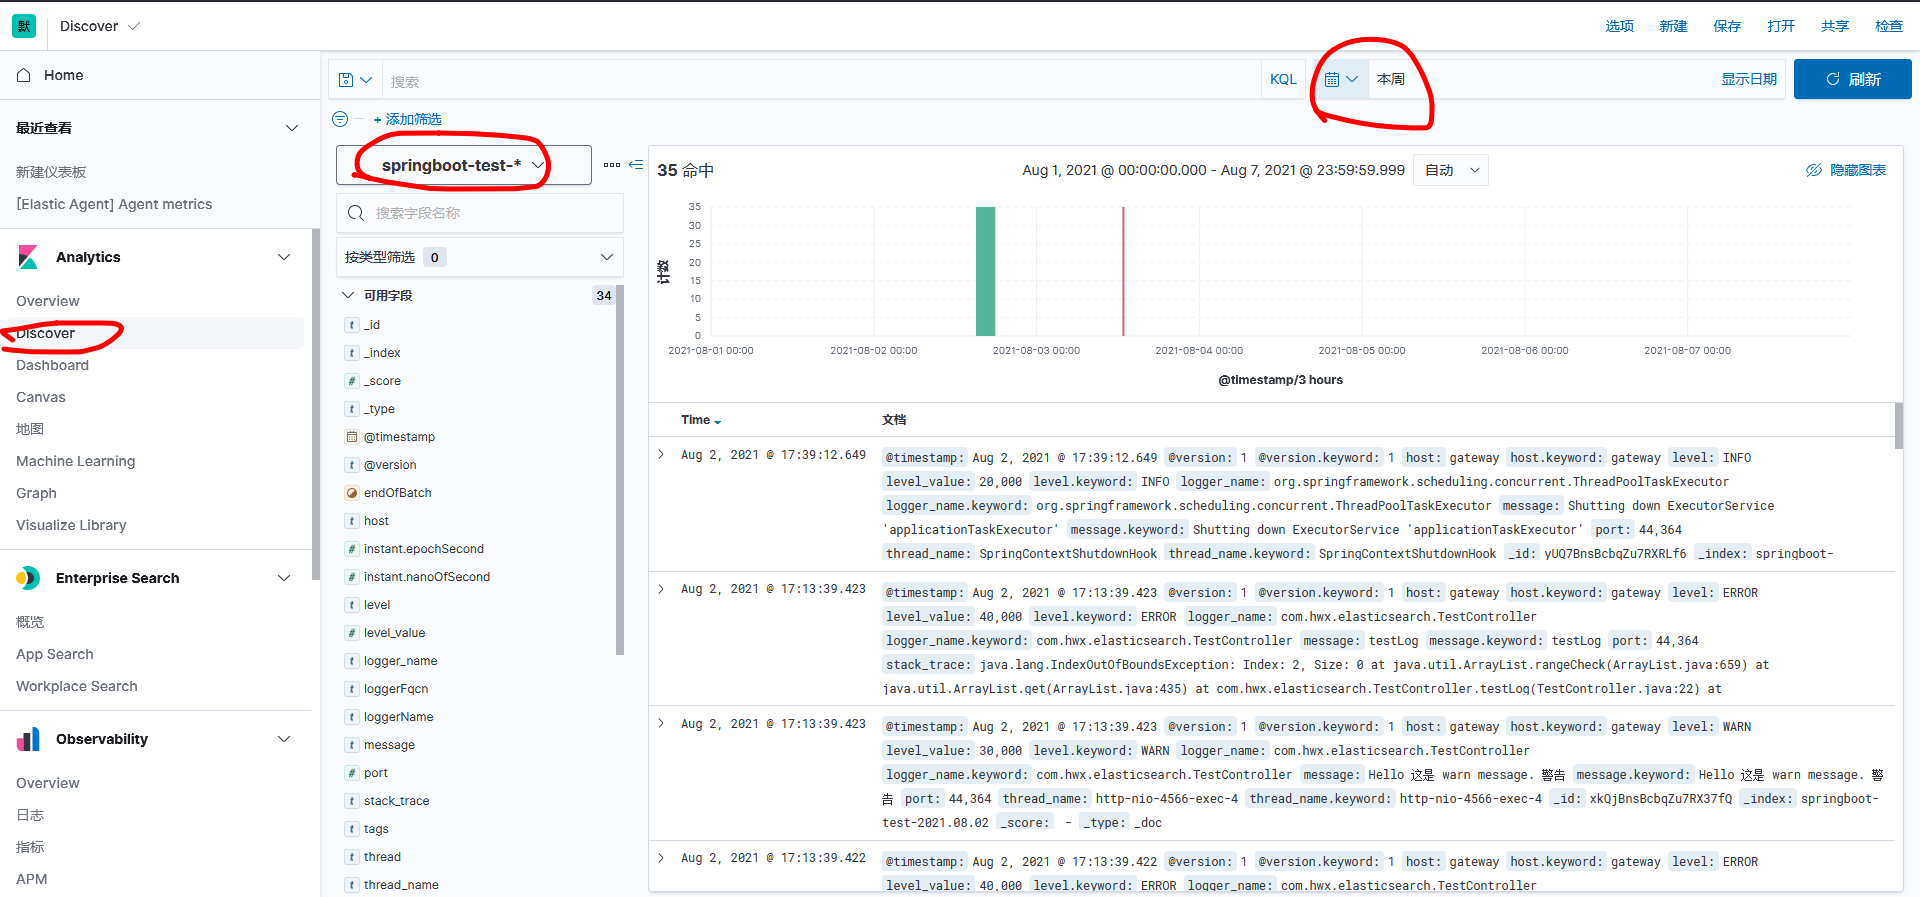
Then go to Discover and select the appropriate indexing mode and log time to see the data
For ssl configuration of logstash, you can refer to:
Error unable to find valid certification path
Collect Logstash monitoring data using legacy collectors | Logstash Reference [7.14] | Elastic
Pass in custom index from project
The above configuration can only be used for one project, but it is not possible for an ELK to have only one project, so in order for the ELK to access multiple projects, the project passes in a custom index.
Modify the logback.xml file by adding tags:
1 2 3 4 5 6 7 8 9 10 11 12 13 14 15 16 17 18 19 20 21 22 23 24 25 26 27 | |
Modify logstash.conf
1 2 3 4 5 6 7 8 9 10 11 12 13 14 15 16 17 18 19 | |
Restart logstash to see the incoming index.
Collect logs using Filebeats
Use filebeats to collect the application's log file *.log and send the log to logstash.
Doker Installation for Filebeats
1 2 3 4 5 6 7 8 9 | $ docker run -d \ --name=filebeat \ --user=root \ --volume="$(pwd)/filebeat.docker.yml:/usr/share/filebeat/filebeat.yml:ro" \ --volume="/var/lib/docker/containers:/var/lib/docker/containers:ro" \ --volume="/var/run/docker.sock:/var/run/docker.sock:ro" \ --volume="/var/log:/logs:ro" \ docker.elastic.co/beats/filebeat:7.14.0 filebeat |
Configuration of the filebeat.docker.yml file:
1 2 3 4 5 6 7 8 9 10 11 12 13 14 | |
With respect to the index of output.logstash, this value is assigned to the metadata.beat key, so it can be obtained in the logstash collector's configuration file using%{[@metadata][beat]}.
Configure the configuration file for the logstash collector:
1 2 3 4 5 6 7 8 9 10 11 12 13 14 15 16 | |
Detailed use of the filebeats configuration file can be referred to as:
filebeat.reference.yml | Filebeat Reference [7.15] | Elastic
The logstash configuration file can be used as a reference:
Configure the Logstash output | Filebeat Reference [7.15] | Elastic
Since two configuration files were used, pipelines.yml needs to be reconfigured:
1 2 3 4 5 6 | # pipelines.yml - pipeline.id: main path.config: "/usr/share/logstash/pipeline/logstash.conf" - pipeline.id: beats path.config: "/usr/share/logstash/pipeline/logstash-filebeats.conf" |
Customize collected log content
Because log content is collected by default, including time, log type, and so on, we often only need to see what the program actually outputs, so we can use the grok plug-in of logstash to filter the log content.
Group plug-in
The grok plug-in is used to filter sliced text.
The basic syntax is:%{SYNTAX:SEMANTIC}
SYNTAX is a configuration configuration type that can be used with built-in types (you can use logstash-patterns-core/patterns at master · logstash-plugins/logstash-patterns-core · GitHub You can also customize the type.
The variable names given by SEMANTIC to the matched text can be seen in kibana.
Example:
1 | |
For example, to match:
1 | 112.123.1.10 [info] - success |
The matching method is
1 | |
[and] need to be escaped \[and \], respectively. Actually, the syntax is similar to regular expressions.
Recommended Use Grok Debugger Debugging.
So at this point pipeline is configured to:
1 2 3 4 5 | |
grok plug-ins also support custom types
Custom types can be managed separately in a single file (file name is optional) using either regular expressions or built-in types
1 2 | |
Under the patterns_dir parameter, specify the directory in which the custom type stores files
1 2 3 4 5 6 7 | |
Overwrite the default message field with the overwrite parameter
Match Single Line Log
Knowing the basic grok syntax, we applied it to our project. For example, the normal info log for a project is:
1 | 2021-08-11 10:58:10 - [INFO] [org.springframework.amqp.rabbit.connection.CachingConnectionFactory:] Attempting to connect to: [xxx] |
So the corresponding matching method is:
1 | |
If the characters are too long, use too much*, or match types GREEDYDATA and DATA, logstash may time out. There is no solution at this time, but try to materialize the match as much as possible.
Match multiline logs
Such as a java stack.
Example:
1 2 3 4 5 | |
Multiline logs should be preprocessed in filebeat h and sent to logstash because processing multiple rows in logstash can cause confusion and data corruption.
Configure multiple lines in the filebeat configuration file first:
1 2 3 4 | |
This configuration means to append rows that do not qualify for a pattern to rows that previously qualify for a pattern.
Patterns are matching patterns; negates deny matching patterns; matches are how rows are combined to match, depending on negate. Detailed use can be seen in:
Manage multiline messages | Filebeat Reference [7.14] | Elastic
Next, configure logstash. Since there are multiple lines in the log passed in from filebeat, you need to add (?m) and a line break, but the normal DATA and GREEDYDATA are. *? And. *, respectively, and do not match the line break, so you need to match the line break with (?<message>(. |\r|\n)*).
The total logstash configuration is:
1 2 3 4 5 6 7 8 9 10 11 12 13 14 15 16 17 18 19 20 21 22 23 | |
filebeat log duplication
Because the filebeats transport guarantees "at least once" instead of "exactly once". Because filebeats will only consider the data to be sent successfully if they receive an ack s from logstash, otherwise they will be retransmitted.
To avoid duplication, there are three ways to define the unique id of a document in a filebeat. You can see the official document:
Deduplicate data | Filebeat Reference [7.15] | Elastic
Translated version:
Here you choose to add a add_id processor to the filebeats configuration file to generate a unique ID for each field.
1 2 | processors: - add_id: ~ |
Note: If a program writes a log with the same paragraph in two log files (for example, error logs are written to both error and info files), filebeat adds different IDs to them, which can also cause duplicate data.
filebeat collects multiple log files and adds them to different indexes
Configure the addresses of two log files in filebeat.yml and add fields address and category under the fields to identify different log files. Fields under fields can be used directly in logstash.conf, for example, if [category]{} and'%{[category]}-%{[address]}'. Instead of filebeat configuration index, they are processed in logstash.
1 2 3 4 | |
Accept these two fields in logstash and configure them as index:
1 2 3 4 5 6 7 8 9 10 | |
So you can see index in kibana
Replace @timestamp with the time the log was generated
Replace the @timestamp field with the matching timestamp field from the log in logstash.conf
1 2 3 4 5 6 7 8 9 10 11 12 13 14 15 16 17 18 19 20 21 | |
However, there are problems with this method, which will cause the logs seen in logstash and elasticsearch to be out of date and no solution has been found for the time being.
Reference resources
Questions 4 and 5:
Elasticsearch 100 Questions (1-30)
About date:
Date filter plugin | Logstash Reference [7.x] | Elastic
About event.set:
Event API | Logstash Reference [7.x] | Elastic
Treadpit:
ELK Development Diary (2) - Filebeat 7.2.0 Time Zone Drift (UTC+16) Solution
Time Error of Kibana Component in ELK
configuration file
So the final configuration file for now is as follows;
filebeat.yml
1 2 3 4 5 6 7 8 9 10 11 12 13 14 15 16 17 18 19 20 21 | |
logstash.conf
1 2 3 4 5 6 7 8 9 10 11 12 13 14 15 16 17 18 19 20 21 22 23 24 25 26 27 28 29 30 31 32 33 34 35 36 37 38 39 40 41 42 43 | |
Send alert log to pin

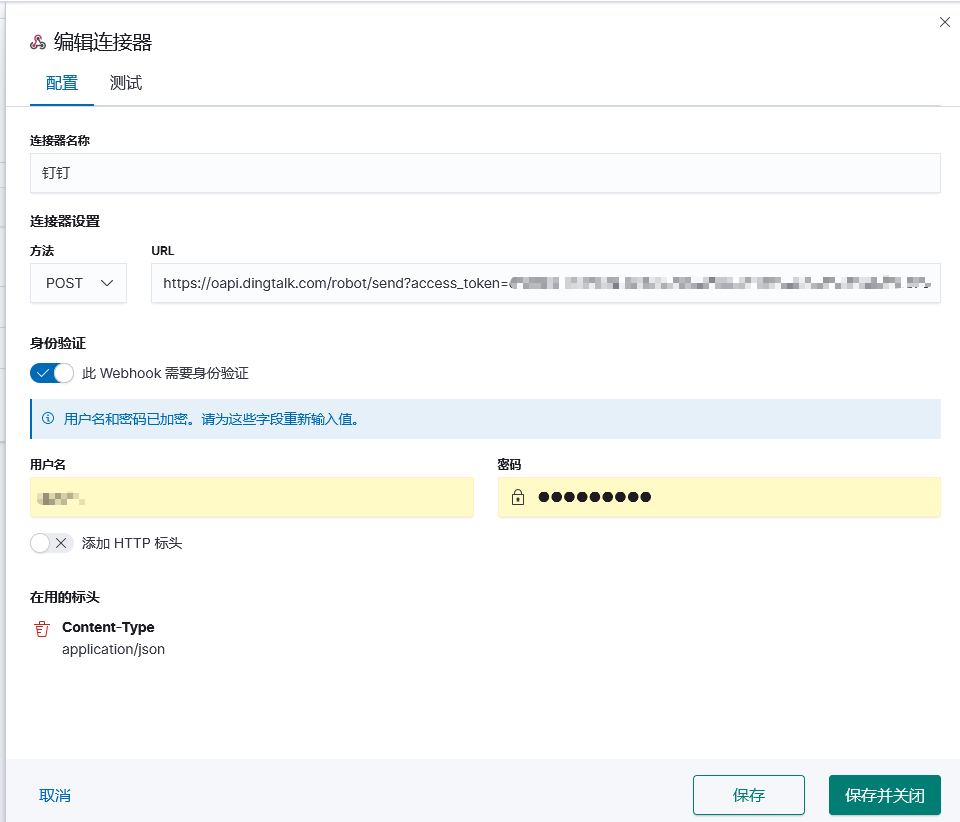
Create a connector
Method Select POST, fill in the pin's webhook address, and add the header Content-Type:application/json.
How to apply for a pinned webhook:
First, create a new group chat. If you need to create a new group chat for one person, you can start a group chat on the computer and select the classmates.
Then add a group chat robot and choose Custom.
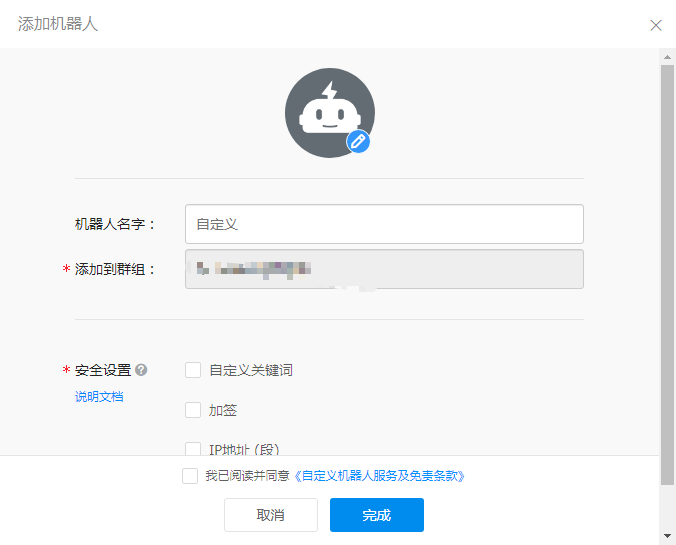
Here you choose the custom keyword elastic. Then paste the webhook address into elastic.
test
Fill in the text:
1 | |
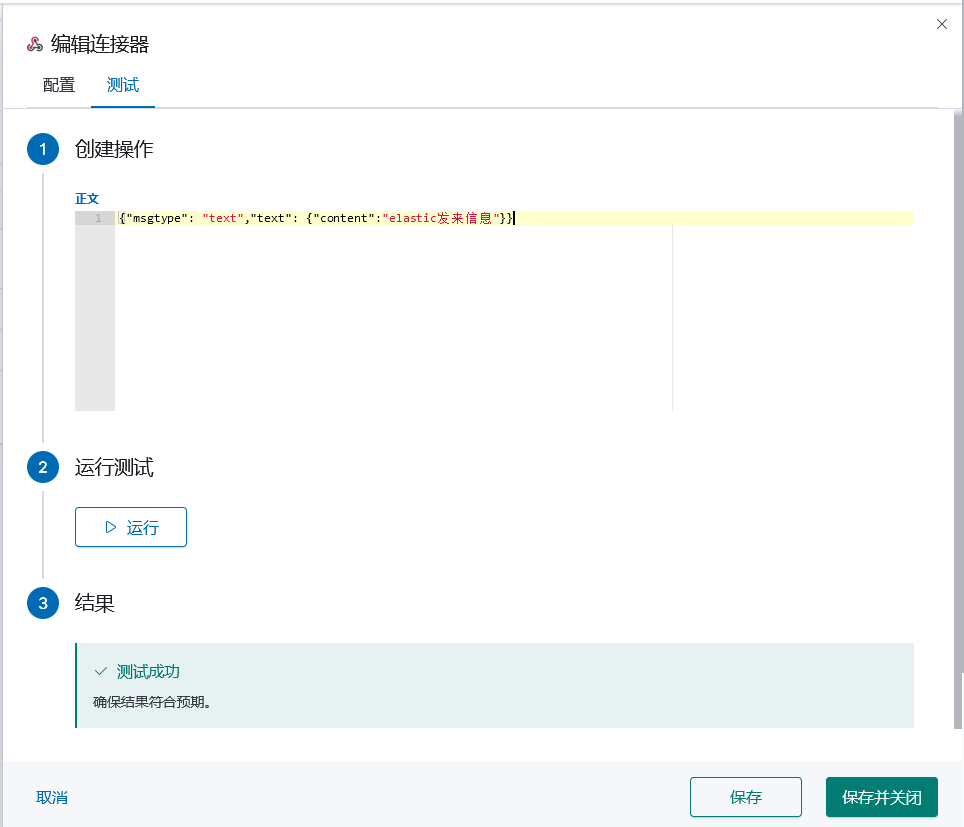
Click Test
A pin receives the message.
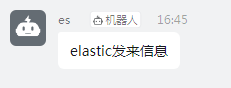
Text sent to see pinned documents
Custom Robot Access-Pin Open Platform
Text parameters can refer to elastic's documentation
Create and manage rules | Kibana Guide [master] | Elastic

Reference resources
Running the Elastic Stack on Docker | Getting Started [7.15] | Elastic
Spring Boot uses Log4j2 & Logback to output logs to EKL_Ouch_Sheep's Blog-CSDN Blog