Introduction to multi factor screening stage
1. Tasks in the filtering phase
-
Single factor validity analysis
Selection of 500 factors = = > 100 factors, which really contribute to the yield
-
Multi factor correlation analysis
Get the high correlation and delete some
-
Multifactor synthesis
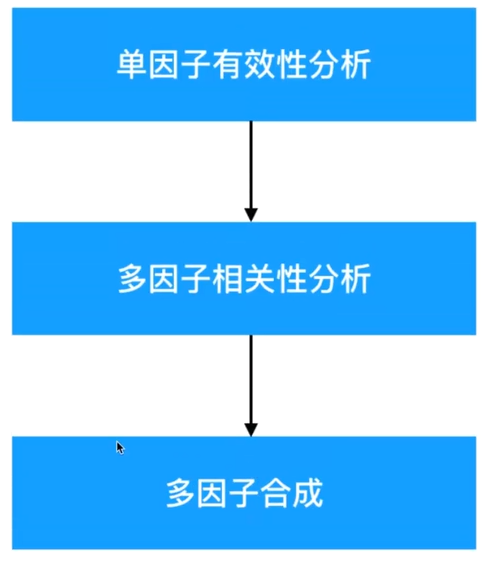
With so many characteristics, how to find the stock return corresponding to the factor?
Relationship between factor and yield factor eigenvalue
- Link between factor and yield factor (eigenvalue), yield (target value)
2. Process of mining factors
1. From hundreds of factors, the factors that are effective for the rate of return are analyzed
-
Filter in each category of factors, and filter out N effective factors in each category
- Quality, valuation, growth and other factors
- Strict: for example, 20 effective factors
- Not strict: for example, there are 50 effective factors
-
Do correlation analysis among the selected single factors and combine the factors with strong correlation
Finally, the effective and weak correlation factors are obtained, the number is small, generally about 10
Audition > n factors > selection = = > n factors
Objective of multivariate validity analysis
1. Several problems in validity analysis
-
IC analysis of factors
Correlation strength between judgment factor and income
-
Yield analysis of factor
Determine the stock direction of the factor
Direction of factor
-
Factor ascending order the smaller the factor value, the better, such as P / E ratio
-
Factor descending order: the larger the factor value, the better, such as profit
-
Factor neutral factor direction uncertainty, such as turnover
-
Get two tables to filter
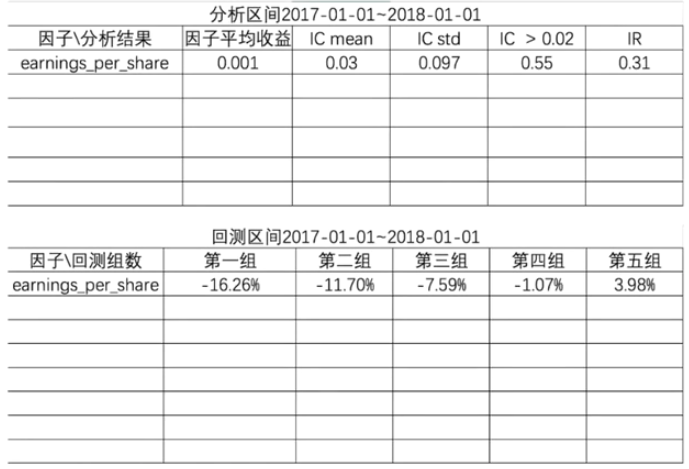
Single factor validity analysis – factor IC analysis
Factor IC analysis determines the correlation between factor and yield.
- IC mean: average value of factor IC
- IC std: standard deviation
- IC > 0.02: ratio with factor greater than 0.02
- IR: information ratio
- IR = IC mean / IC volatility (std)
- IR > 0.3 for screening, the standard can be modified
1. Definition of information coefficient
Correlation between factor data and stock return
The IC of a period refers to the cross-sectional correlation coefficient between the factor exposure value of that period and the actual return value of the stock in the next period.
1.1 factor exposure value
It refers to the value of the factor itself
The cycle is one day: (this period) the factor exposure value of 20180103, (next period) 20180104: stock return
Cycle one week, one month (similar)
1.2 calculation method
- Spearman correlation coefficient (Rank IC)
- If X increases, Y tends to increase. The Spearman correlation coefficient is positive.
- Value [- 1, 1]
1.3 information coefficient API
import scipy.stats as st
st.spearmanr(fund['pe_ratio'], fund['return']) # stock yield
2. How to find the rate of return
2.1 yield range
- By interval size
- Daily rate of return
- Monthly rate of return
- Annual rate of return
2.2 calculation formula
Yield of a period = (closing price - closing price (previous period)) / closing price (previous period)
3. Case: IC analysis of single factor one day
If the factor IC value of January 3, 2017 is calculated
3.1 analysis
If the factor IC value of January 3, 2017 is calculated (correlation coefficient with income)
1. Factor exposure value on January 3, 2017
2. Stock return on January 4, 2017 (closing price No. 4 - closing price No. 3) / closing price No. 3
3. Calculate correlation coefficient
3.2 code
import scipy.stats as st
# 1. Factor exposure value on January 3, 2017
# Get all stock codes (A shares)
stocks = all_instruments('CS').order_book_id

# Acquisition factor
fund = get_factor(stocks, factor=['basic_earnings_per_share'], start_date='20170103', end_date='20170103')
# Delete date index
fund = fund.reset_index(1, drop=True)
# Delete nan data
fund = fund.dropna()
# fund = fund.sort_index(axis=0)
# Cross section data is obtained
stocks = fund.index.values
# stock_list = fund.index.values
print(len(stocks))
print(fund['basic_earnings_per_share'][:10]))
print(stocks, len(stocks))
# 2. Stock return on January 4, 2017 (closing price No. 4 - closing price No. 3) / closing price No. 3
# Each stock has a price return calculation
print(len(stocks))
price_now = get_price(stocks, start_date='20170103', end_date='20170103', fields='close')
price_next = get_price(stocks, start_date='20170104', end_date='20170104', fields='close')
price_now = price_now.reset_index(1, drop=True)
price_next = price_next.reset_index(1, drop=True)

# Gets and sets the mask for the collection
def get_mask(and_list, stock_list):
    masks = []
    for stock in stock_list:
        if stock in and_list:
            masks.append(True)
        else:
            masks.append(False)
    return masks

# Print the length of the current closing price and the closing price factor data of the next period
print(len(price_now), len(price_next), len(fund['basic_earnings_per_share']))

# Get stock code list
next_stock_list = price_next.index.values
now_stock_list = price_now.index.values
# print(next_stock_list)

# Intersection of current and next stock codes
next_stock_set = set(next_stock_list)
now_stock_set = set(now_stock_list)
and_stock_list = list(next_stock_set & now_stock_set)
print('Code intersection:', len(and_stock_list))

# Filter current closing price
masks = get_mask(and_stock_list, now_stock_list)
price_now = price_now[masks]

# Filter the closing price of the next period
masks = get_mask(and_stock_list, next_stock_list)
price_next = price_next[masks]

# Reprint data length
print(len(price_now), len(price_next))

# Re filter
fund = fund['basic_earnings_per_share']
masks = get_mask(and_stock_list, stocks)
fund = fund[masks]
print(len(fund))

# 2. Calculate the rate of return on January 4
stock_rice = (price_next.iloc[:, 0] - price_now.iloc[:, 0]) / price_now.iloc[:, 0]
print(stock_rice[:10])
print(len(stock_rice), len(fund))
# 3. Calculate correlation coefficient
print(stock_rice[:10])
print(fund[:10])
st.spearmanr(fund, stock_rice)