explain
A blog previously described the helm package of k8s in detail, as follows:
[Kubernetes] k8s detailed description and operation of helm package management and application [helm installation, helm warehouse management and building private warehouse]
Image and other files
Monitoring management [prometheus]
Frame description
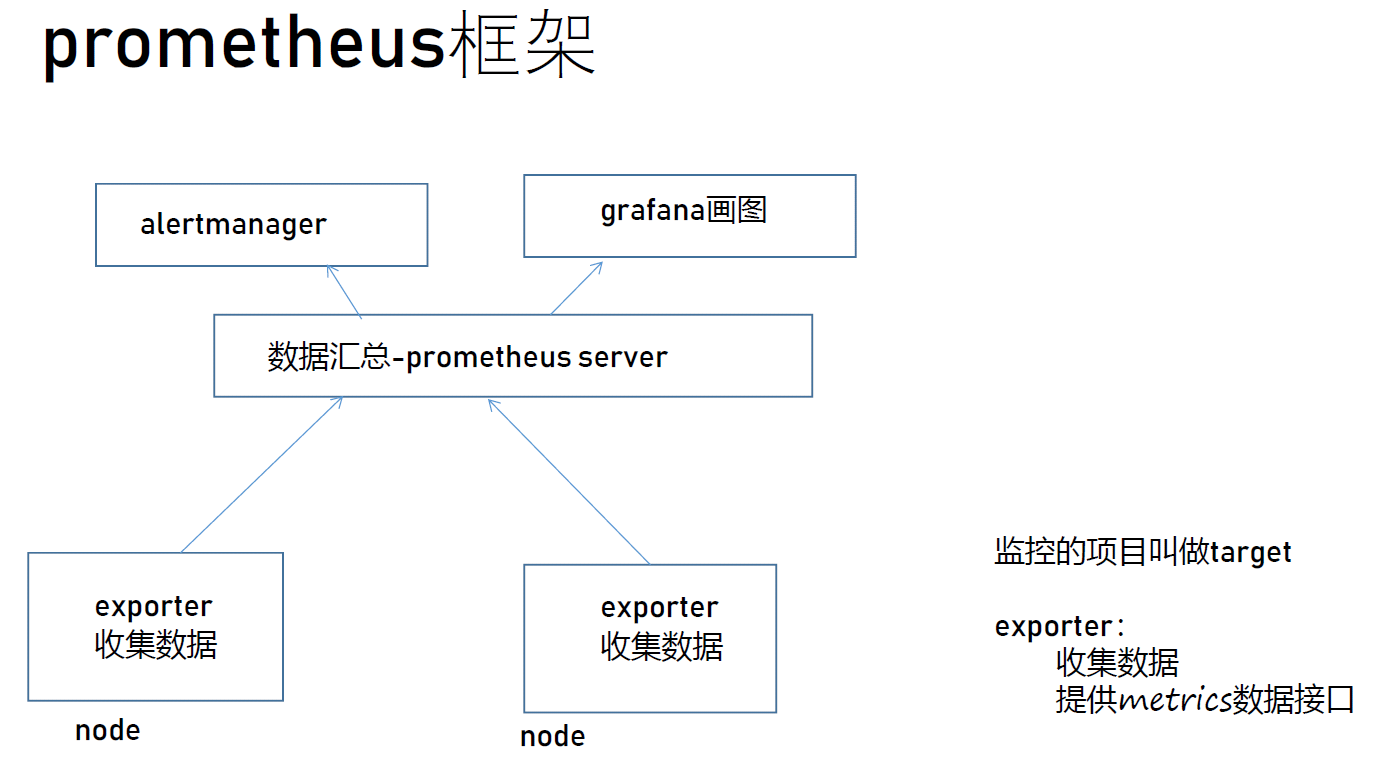
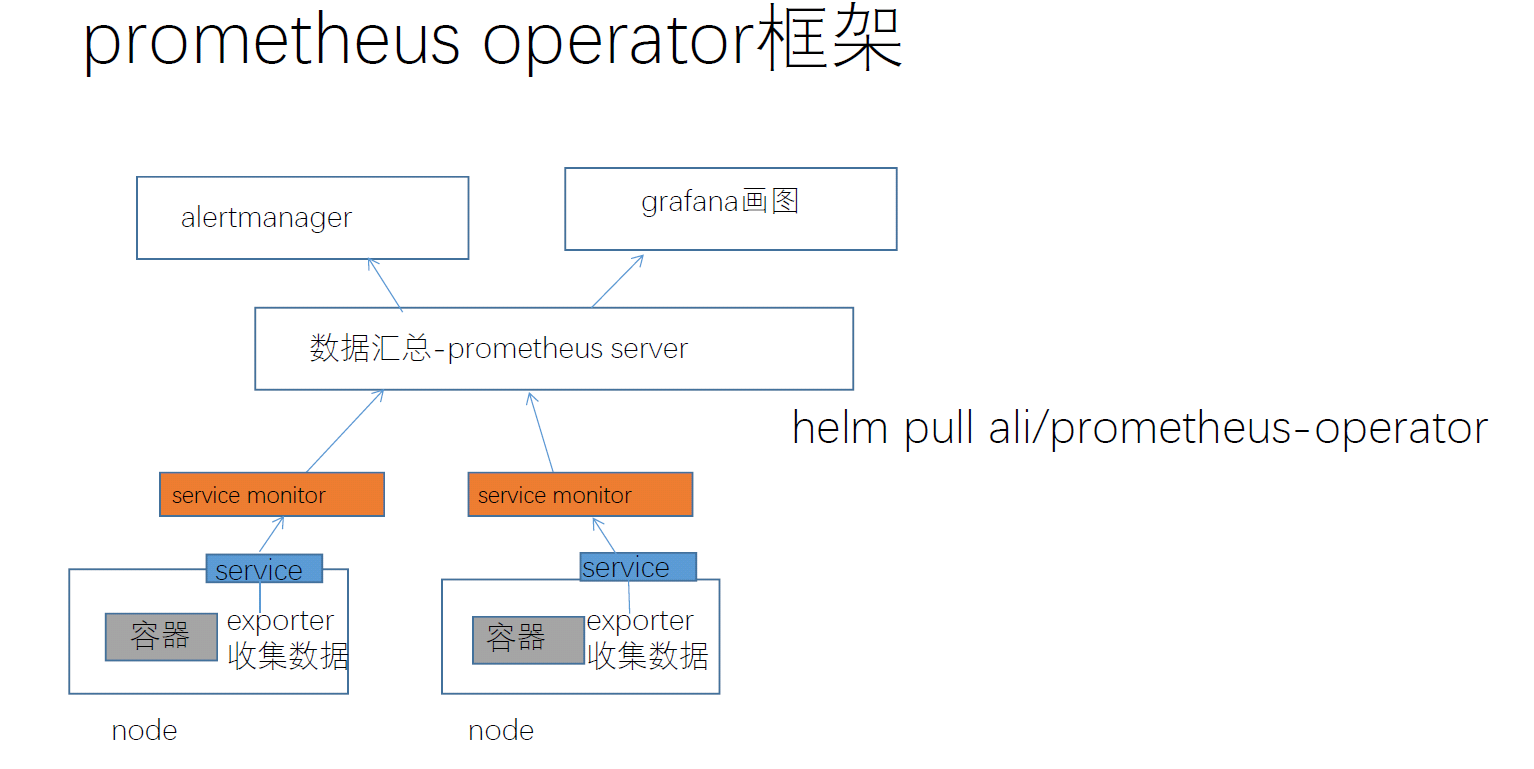
Deploy prometheus [mon node]
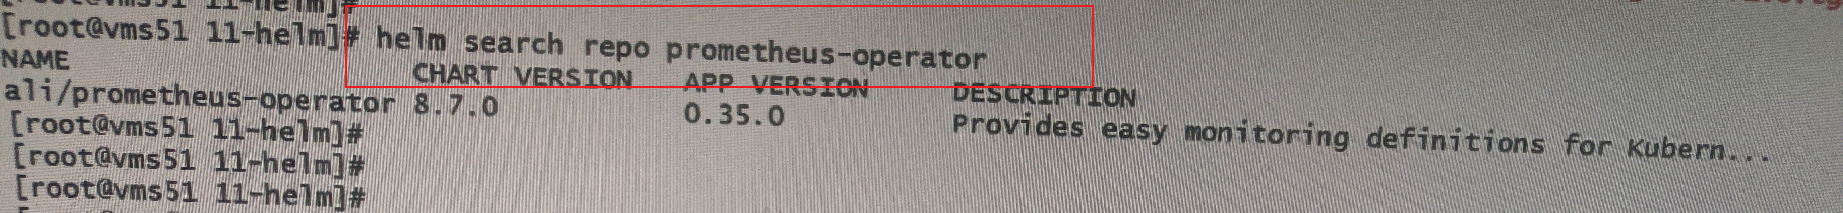
- View the image [the helm source needs to be configured first, here is the configured ali source] [the cluster can be deployed only through the Internet]
helm search repo prometheus-operator
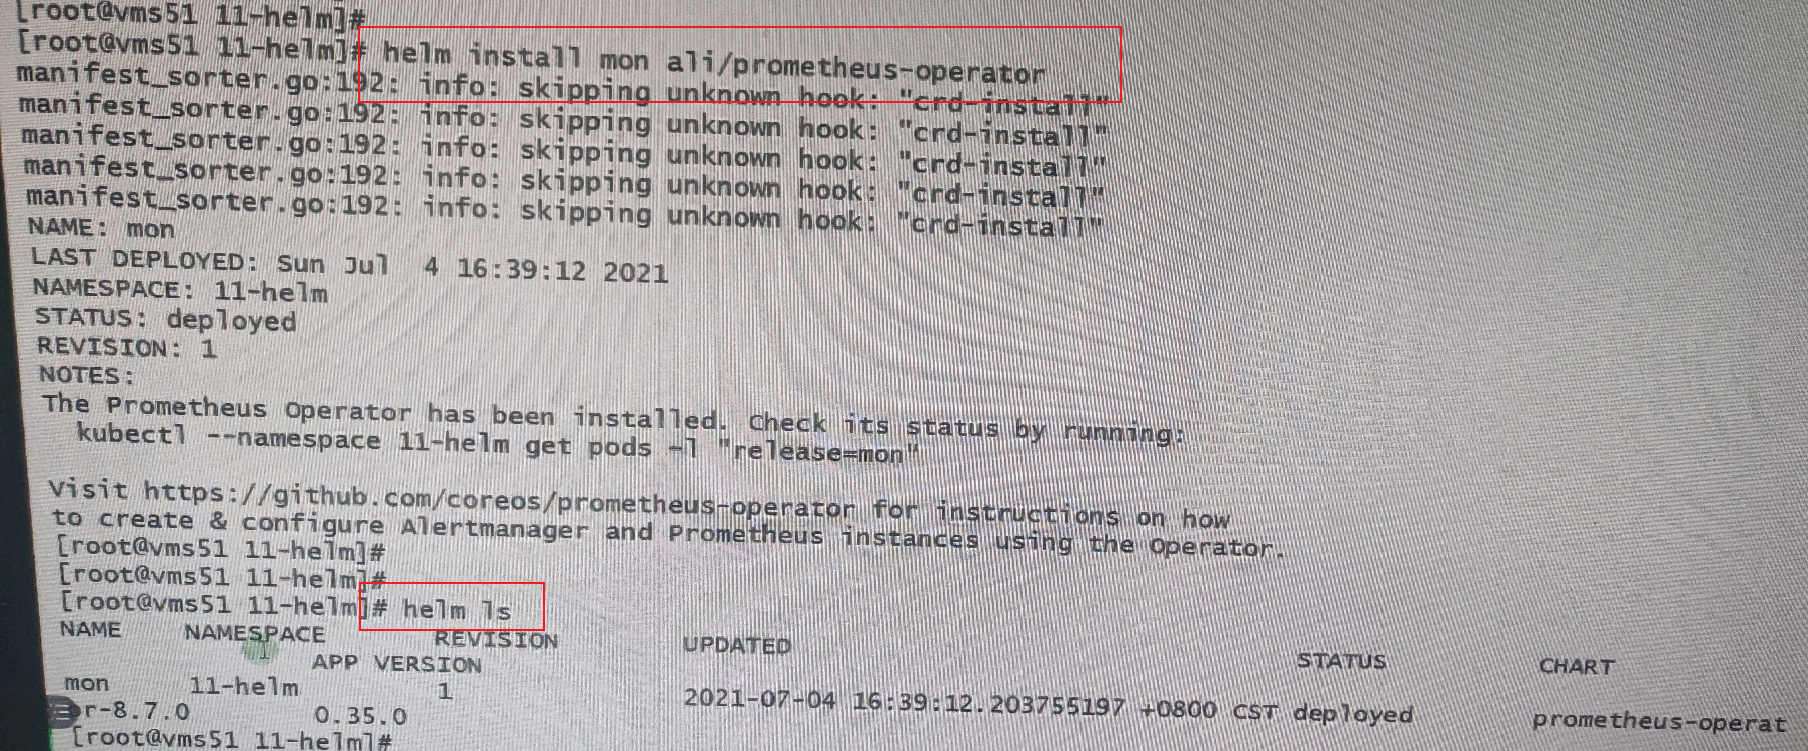
- Install prometheus
helm install mon ALI / Prometheus operator
After downloading, there will be a helm message
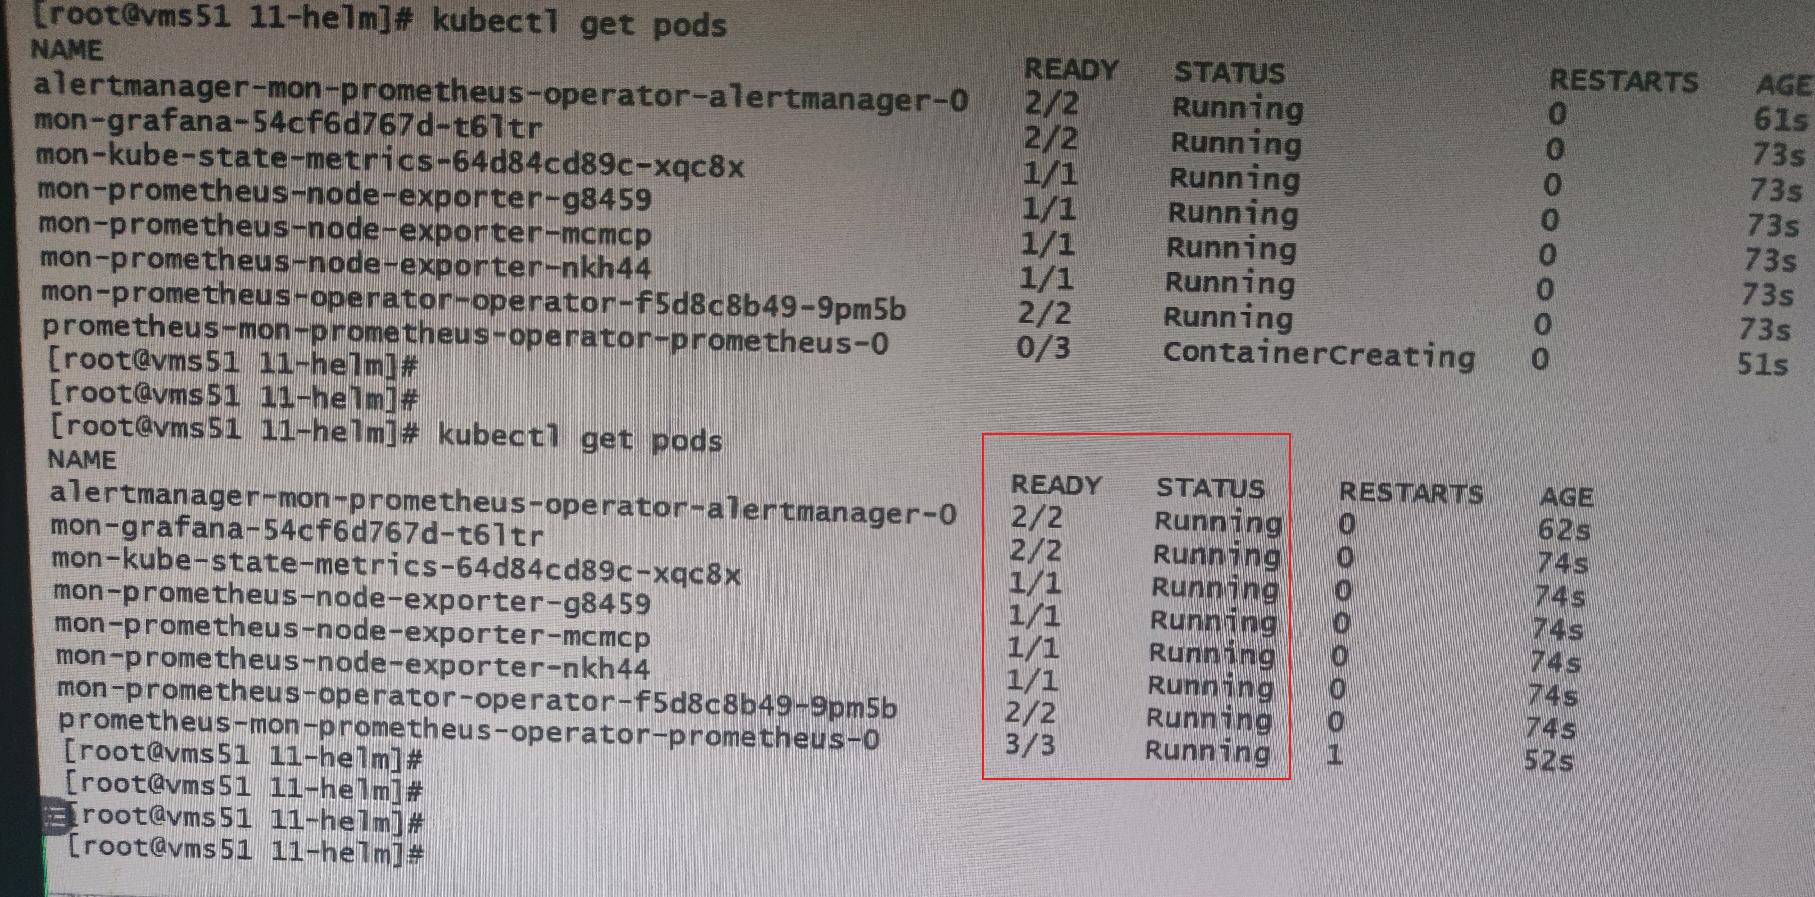
- At the same time, many pods will be generated automatically. Wait and make all these pods in running status
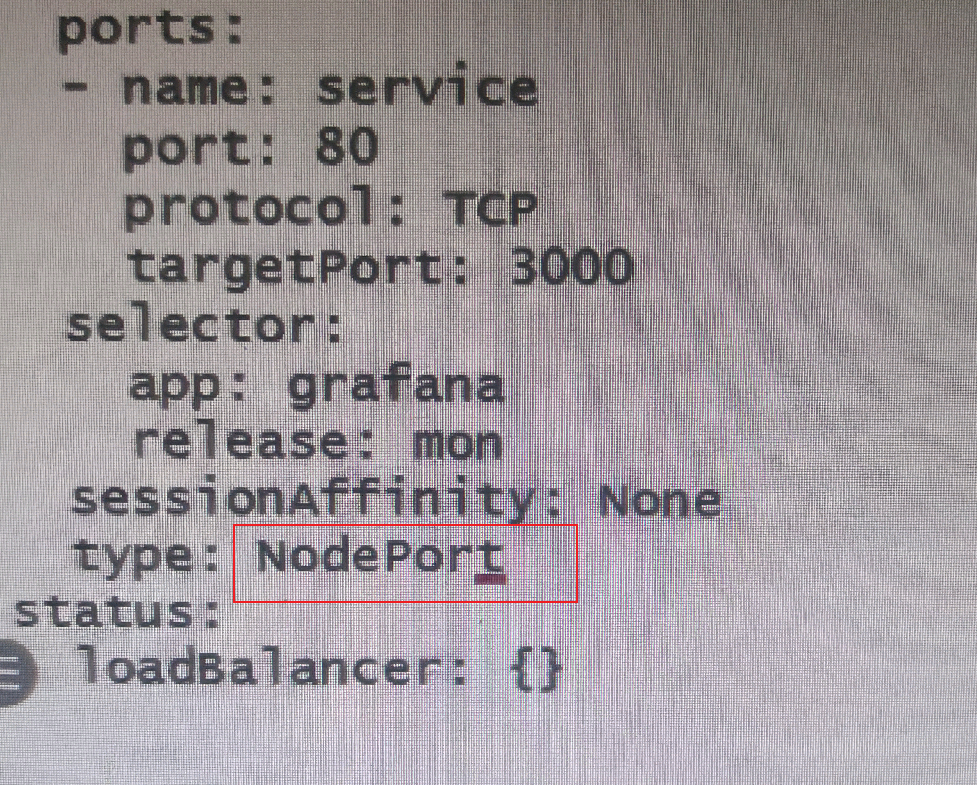
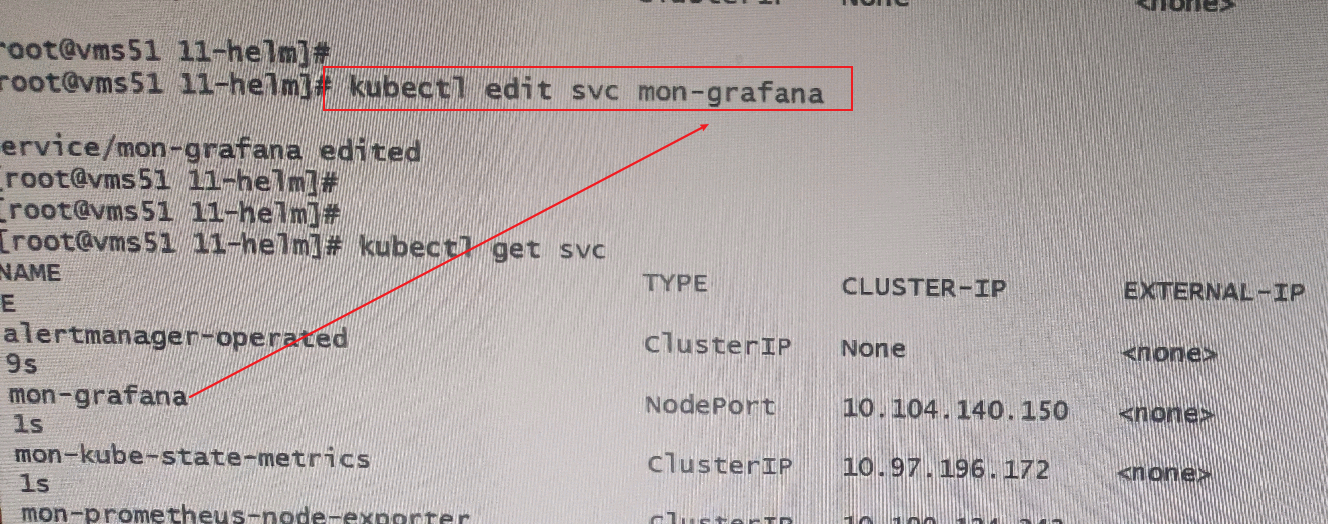
- Edit the pod of mon grafana and change the TYPE to Nodeport
Kubectl edit SVC mon grafana [the TYPE in the second figure below is the modified effect]
- Delete the helm content above
helm del mon
Log in to prometheus
-
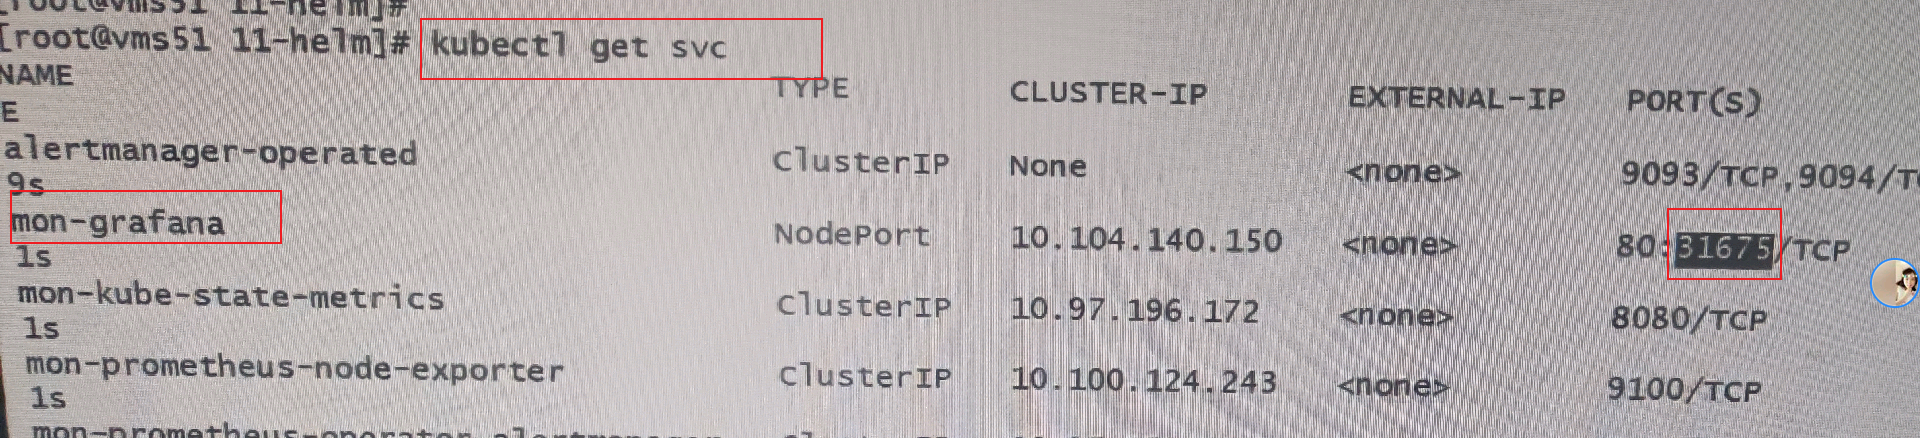
First, execute kubectl get svc to find the port number of mon grafana mapping
-
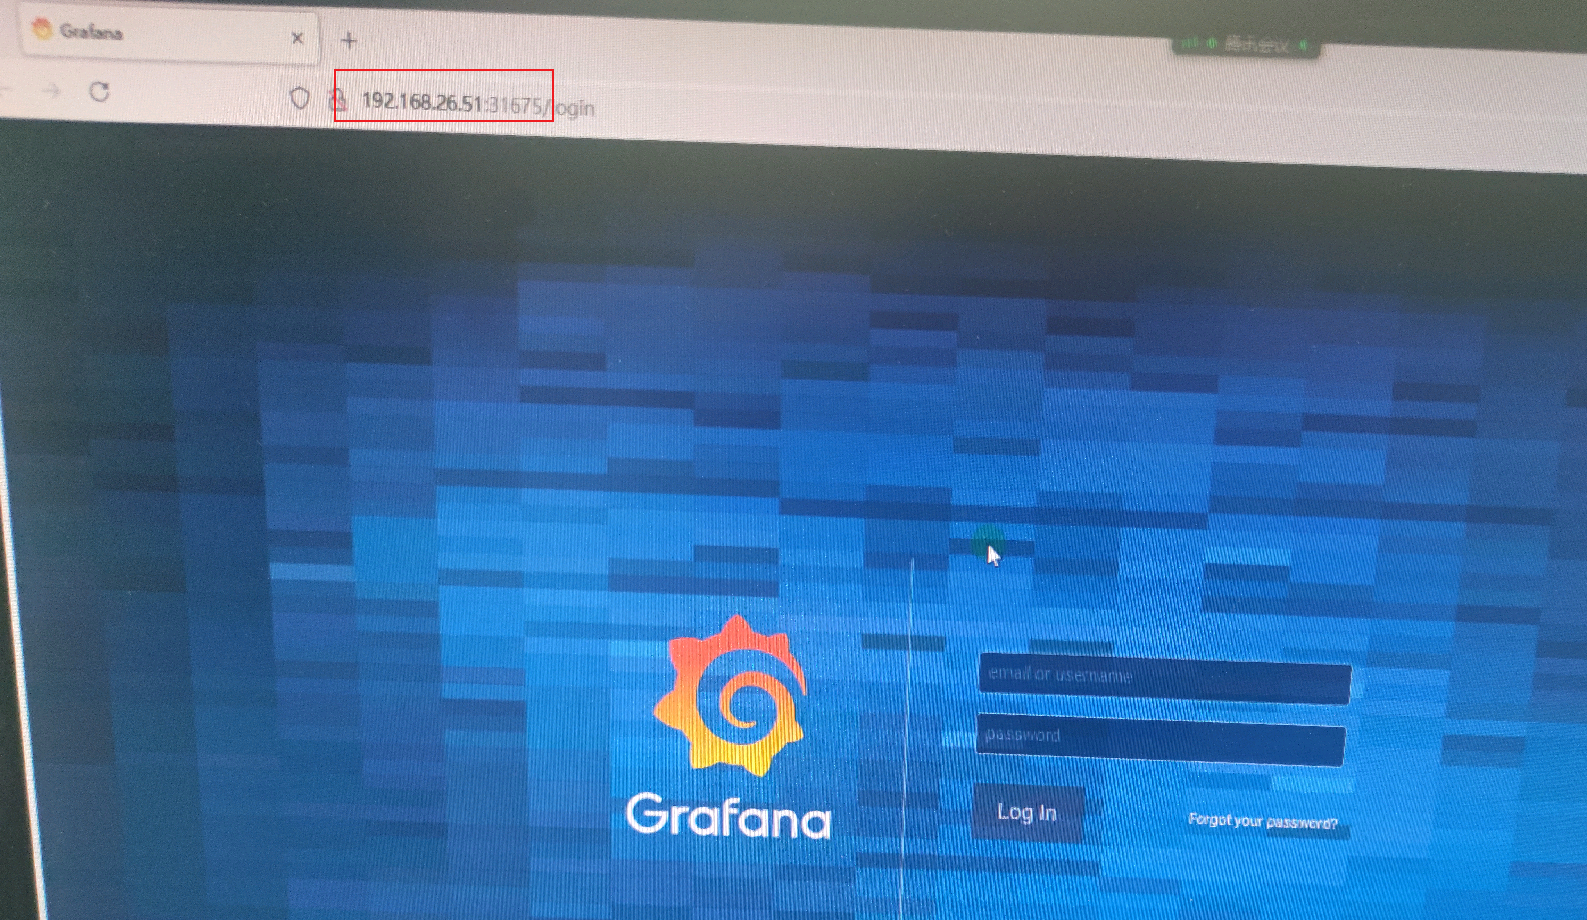
Then enter any nodeIP: port number in the browser to enter the prometheus interface
However, we don't know the user name and password now. Don't worry, and then look down.
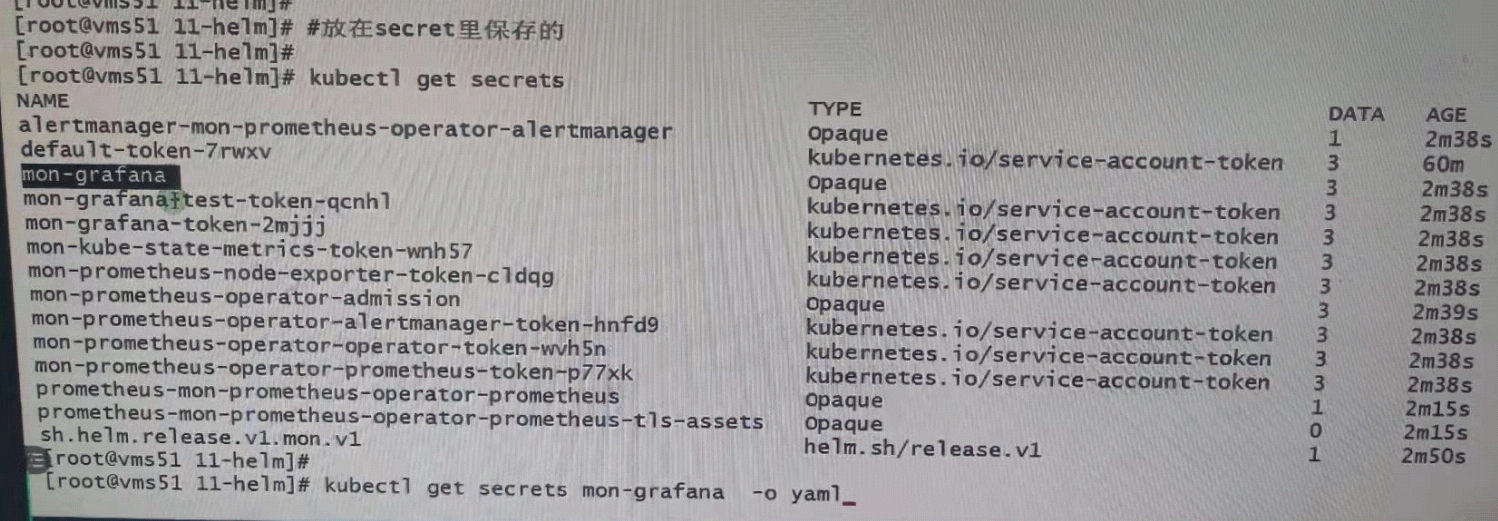
User name and password view
-
The user name and password are placed in a mon grafana container in secret
-
So now we can decompile the password through this container
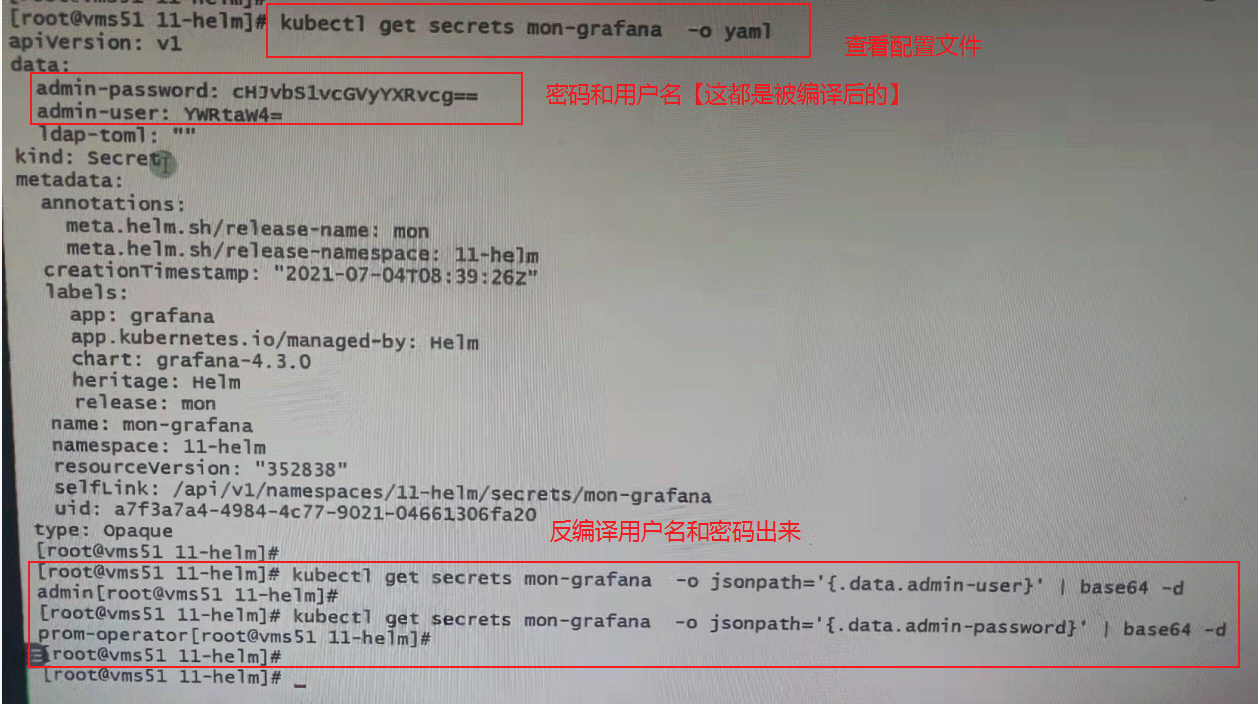
-
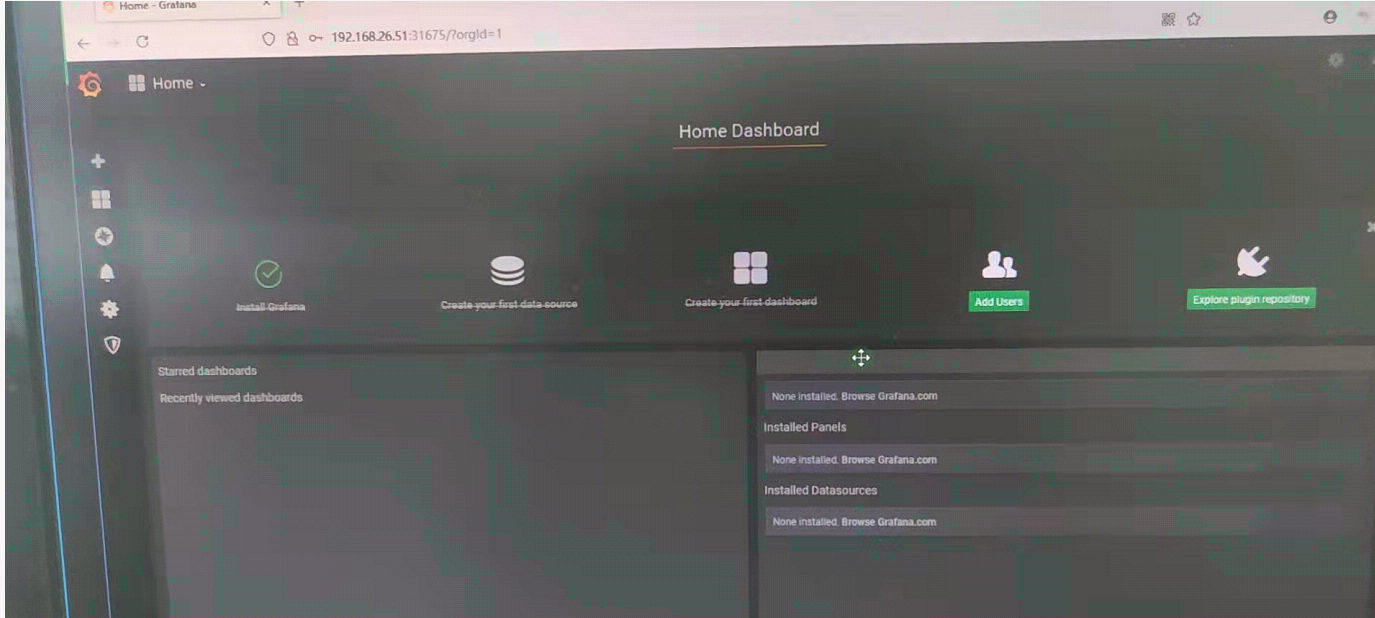
Then enter the login interface of the website through the user name and password viewed above
After successful login, this is the interface
Use of templates
The above interface is only self-contained. More display templates can be downloaded from the official website. Because my cluster has no external network, this experiment cannot be done. You can search the template of prometheus online by yourself. There are many tutorials.
Grafane official website
helm3 install (deploy) EFK [elk upgrade]
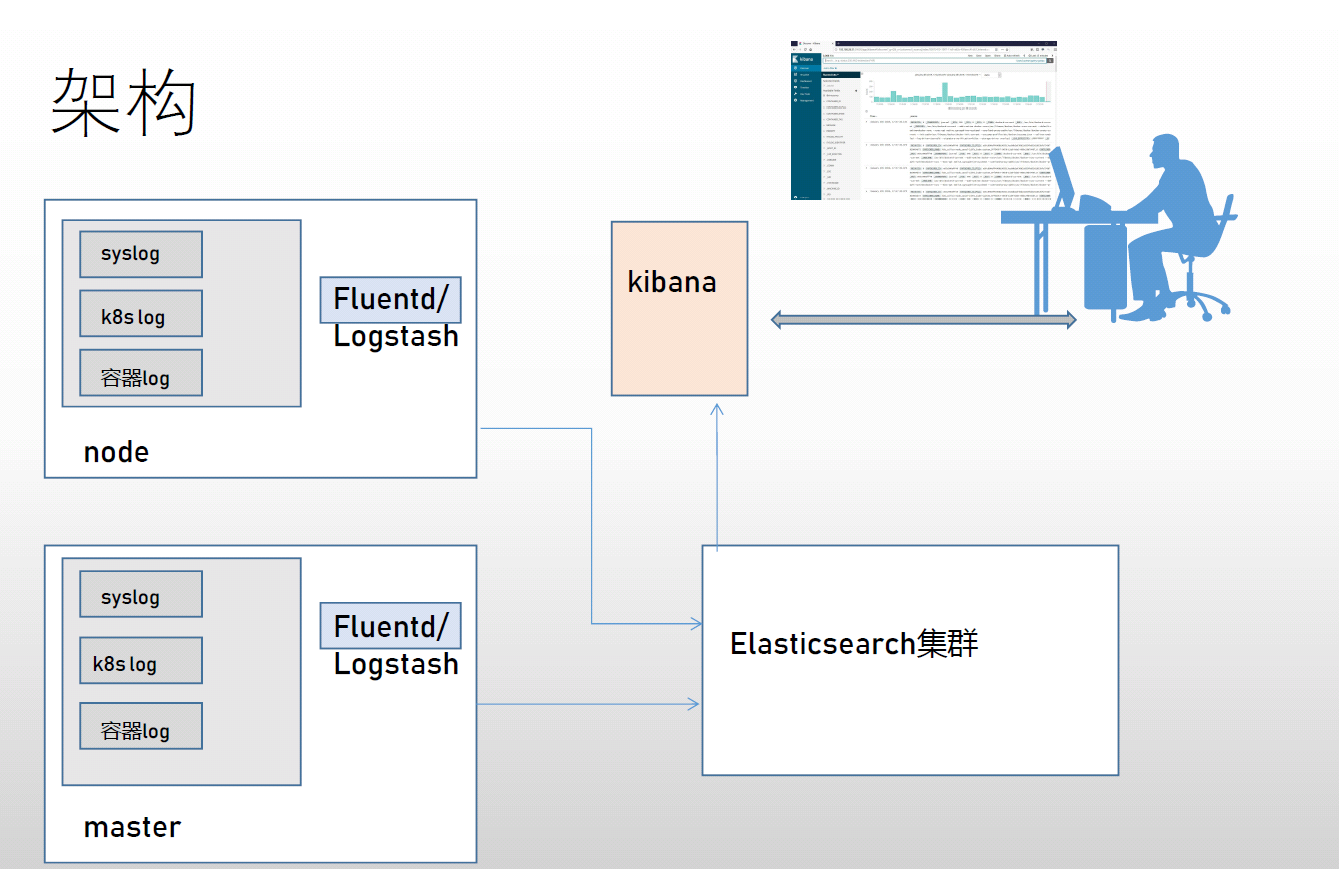
Architecture description
- ELK
- Elasticsearch # is an open source distributed search engine that stores logs and provides query interfaces.
- Logstash # is a completely open source tool. It can collect logs and send them to Elasticsearch
- Kibana # is an open source and free web interface tool that allows users to browse the logs in elastic search
- logstash has low performance, consumes resources, and does not support message queue caching and data loss
Therefore, logstash can generally be replaced by fluent D or filebeat
If the above two alternatives are used, it will be called EFK framework
Operating environment description [required]
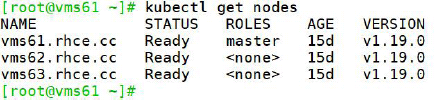
- Where vms61 is the master, vms62 and vms62 bit worker.
- Modify / var/lib/kubelet/config.yaml on all nodes and add in the last line:
featureGates:
CSIMigration: false
- Otherwise, the following error will be reported when viewing the pod status:
MountVolume.SetUp failed for volume "default-token-bd9jk" : failed to sync secret cache: timed
out waiting for the condition
But it doesn't matter if you don't change it.
- All the packages used below have been packaged and put here. If the download is not too slow, you can directly download the packages I uploaded
1. Add efk official helm source
[root@vms61 ~]# helm repo add elastic https://helm.elastic.co
"elastic" has been added to your repositories
[root@vms61 ~]#
[root@vms61 ~]# helm repo list
NAME URL
azure http://mirror.azure.cn/kubernetes/charts/
ali https://apphub.aliyuncs.com
elastic https://helm.elastic.co
[root@vms61 ~]#
2. Download and install elasticsearch
- download
[root@vms61 ~]# mkdir efk ; cd efk
[root@vms61 efk]#
[root@vms61 efk] helm pull elastic/elasticsearch
-
Use the command tar zxvf elasticsearch-7.9.1.tgz to unzip the downloaded elasticsearch-7.9.1.tgz to get a directory elasticsearch.
-
Edit elasticsearch/values.yaml with vim and modify the following part:
-
Because our environment has one master and two worker s, replica is modified to 2.

-
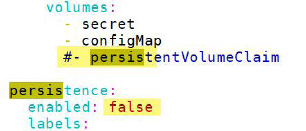
Because you are not going to use persistent storage, change the enabled value under persistence from true to false.
-
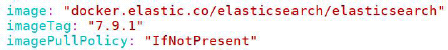
The image used here specifies that the image used for elasticsearch is local [if it is not specified, it may fail due to network problems, so it is best to download it on all nodes in advance], and then save and exit.
-
install
[root@vms61 efk]# helm install elastic elasticsearch
NAME: elastic
LAST DEPLOYED: Sat Sep 12 18:38:08 2020
NAMESPACE: ns6
STATUS: deployed
REVISION: 1
NOTES:
1. Watch all cluster members come up.
$ kubectl get pods --namespace=ns6 -l app=elasticsearch-master -w
2. Test cluster health using Helm test.
$ helm test elastic --cleanup
[root@vms61 efk]#
- The elastic in the command is the name of the application, which can be written at will, and the elastic search is the extracted folder.
After about 1 minute, the corresponding pod will run:
[root@vms61 efk]# kubectl get pods
NAME READY STATUS RESTARTS AGE
elasticsearch-master-0 1/1 Running 0 80s
elasticsearch-master-1 1/1 Running 0 79s
[root@vms61 efk]#
3. Download and install filebeat
- download
[root@vms61 efk] helm pull elastic/filebeat
- Use the command tar zxvf filebeat-7.9.1.tgz to unzip the downloaded filebeat-7.9.1.tgz to get a directory filebeat.
- Edit filebeat/values.yaml with vim to view the following sections:
It is recommended to download the required images on all nodes in advance. Save and exit if you don't need to edit anything else. - Start installing filebeat:
[root@vms61 efk]# helm install fb filebeat
NAME: fb
LAST DEPLOYED: Sat Sep 12 18:47:20 2020
NAMESPACE: ns6
STATUS: deployed
REVISION: 1
TEST SUITE: None
NOTES:
1. Watch all containers come up.
$ kubectl get pods --namespace=ns6 -l app=fb-filebeat -w
[root@vms61 efk]#
- fb in the command is the name of the application, which can be written at will, and filebeat is the extracted folder.
About 20 seconds:
[root@vms61 efk]# kubectl get pods
NAME READY STATUS RESTARTS AGE
elasticsearch-master-0 1/1 Running 0 9m33s
elasticsearch-master-1 1/1 Running 0 9m32s
fb-filebeat-lgm76 1/1 Running 0 21s
fb-filebeat-trz5m 1/1 Running 0 21s
[root@vms61 efk]#
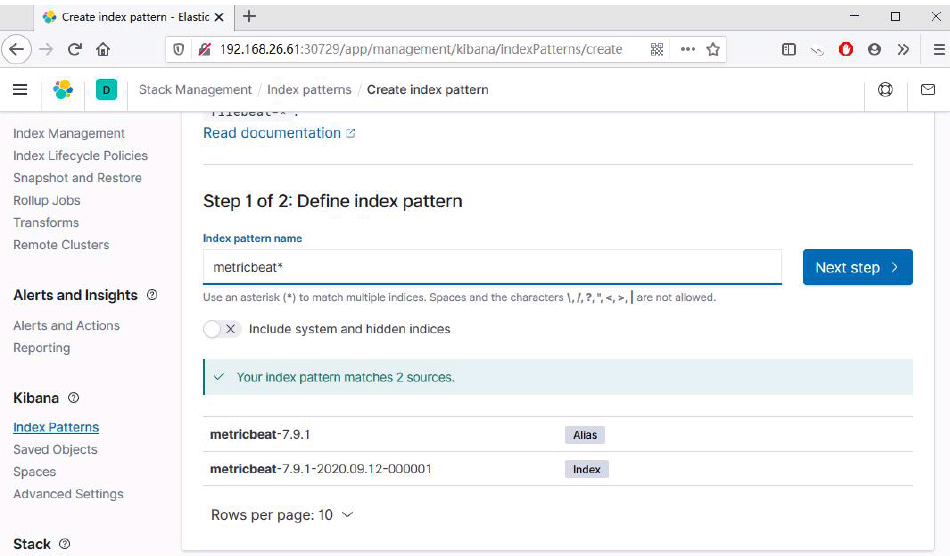
4. Download and install metricbeat
- Download metricbeat:
[root@vms61 efk] helm pull elastic/metricbeat
- Use the command tar zxvf metricbeat-7.9.1.tgz to unzip the downloaded metricbeat-7.9.1.tgz to get a directory metricbeat.
- Similar to the previous method, Download all images on all nodes in advance to start installation:
[root@vms61 efk]# helm install metric metricbeat
NAME: metric
LAST DEPLOYED: Sat Sep 12 18:53:55 2020
NAMESPACE: ns6
STATUS: deployed
REVISION: 1
TEST SUITE: None
NOTES:
1. Watch all containers come up.
$ kubectl get pods --namespace=ns6 -l app=metric-metricbeat -w
[root@vms61 efk]#
- Metric in the command is the name of the application, which can be written at will, and metric beat is the extracted folder.
After about 40 seconds, the corresponding pod will run:
[root@vms61 efk]# kubectl get pods
NAME READY STATUS RESTARTS AGE
...output...
metric-kube-state-metrics-76c5b9fdbf-4jmnr 1/1 Running 0 46s
metric-metricbeat-bbbxx 1/1 Running 0 46s
metric-metricbeat-metrics-696b596c6f-lwp74 1/1 Running 0 46s
metric-metricbeat-z7x7v 1/1 Running 0 46s
[root@vms61 efk]#
5. Download and install kibana
- download
[root@vms61 efk]# helm pull elastic/kibana
- Use the command tar zxvf kibana-7.9.1.tgzz to unzip the downloaded kibana-7.9.1.tgz to get a directory kibana.
- Similar to the previous method, Download all images at all nodes in advance, and change the service type to NodePort:
After saving and exiting, start the installation:
[root@vms61 efk]# helm install kb kibana
NAME: kb
LAST DEPLOYED: Sat Sep 12 18:58:36 2020
NAMESPACE: ns6
STATUS: deployed
REVISION: 1
TEST SUITE: None
[root@vms61 efk]#
- kb in the command is the name of the application, which can be written at will, and kibana is the extracted folder.
After about 2 minutes, the corresponding pod will run:
[root@vms61 efk]# kubectl get pods
NAME READY STATUS RESTARTS AGE
...output...
kb-kibana-d97c78c6-nqt5p 1/1 Running 0 2m1s
...output...
[root@vms61 efk]#
- Note that the configurations of the two worker s are: 8G memory and 4-core CPU respectively [this is the minimum configuration]
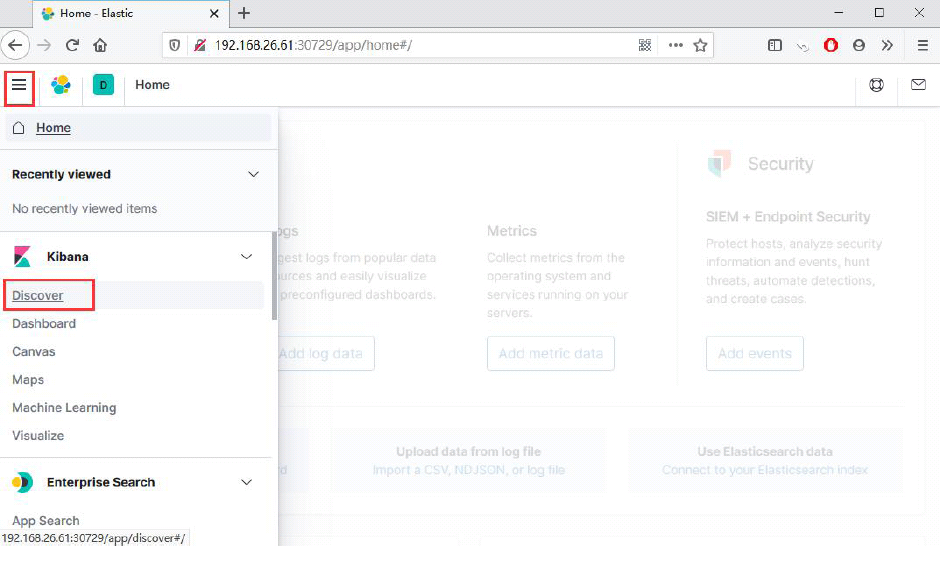
6. Visit kibana
Check that the NodePort corresponding to kibana is 30729 through kubectl get svc, and enter it in the browser
192.168.26.61:30729 enter