Catalog
1. Overview of Scipy Cluster kmeans
2. Example of clustered color extraction
(2) Cluster code implementation
1. Overview of Scipy Cluster kmeans
(1) Basic concepts
Clustering is the process of dividing a dataset into groups of similar data points, that is, dividing the data into a specified number of classes, so as to reveal the intrinsic nature and regularity of the data. Among them, the cluster is divided into two types: central cluster and hierarchical cluster.
The k-means clustering algorithm is an iterative solution clustering analysis algorithm. The step is to randomly select K objects as the initial clustering centers, then calculate the distance between each object and each seed clustering center, divide the elements that are close to each other into groups, and then group them.
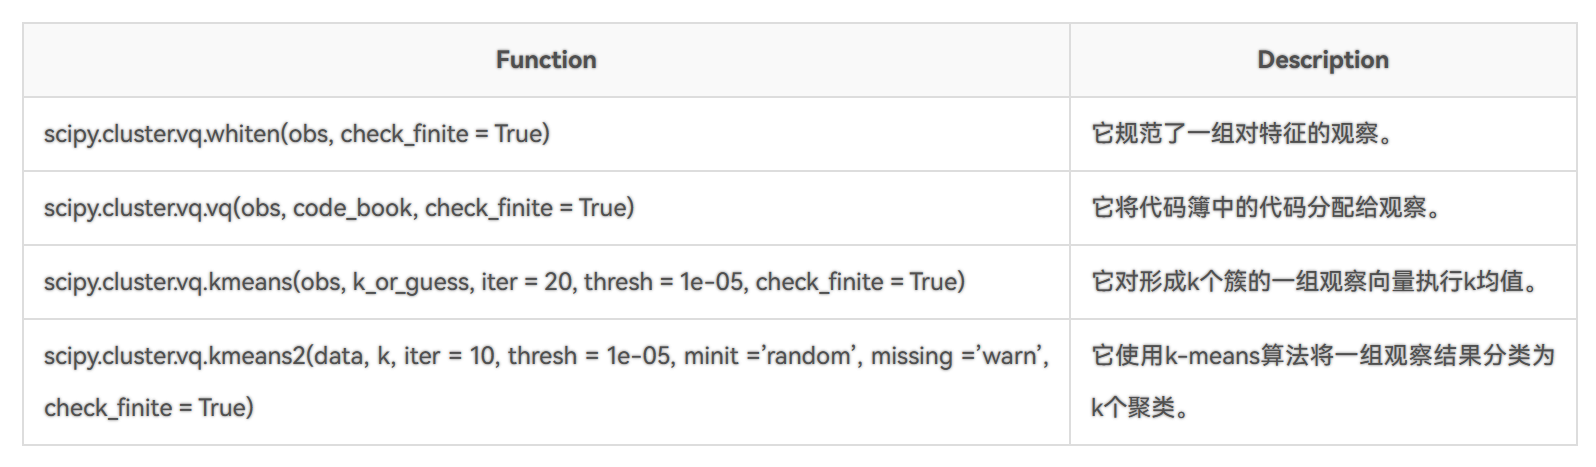
Scipy provides functions for K-mean clustering, generating codebooks from the K-mean model, and quantifying vectors by comparing them to the centroids in the codebook.
(2) Cluster code examples
Select a set of data and cluster it.
The code is as follows:
import numpy as np
from scipy.cluster.vq import vq, kmeans, whiten
import matplotlib.pyplot as plt
#Import Third Party Library
fe = np.array([[1.9,2.0],
[1.7,2.5],
[1.6,3.1],
[0.1,0.1],
[0.8,0.3],
[0.4,0.3],
[0.22,0.1],
[0.4, 0.3],
[0.4,0.5],
[1.8,1.9]])
#Define the set of variables to be clustered
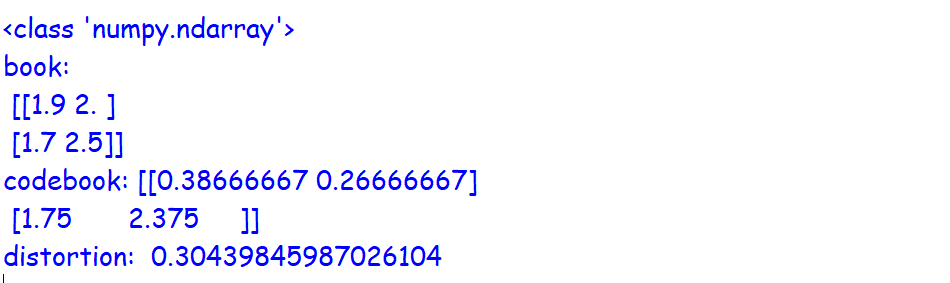
book = np.array((fe[0], fe[1]))
print(type(book))
print("book: \n",book)
codebook, distortion = kmeans(fe, book)
print("codebook:", codebook)
print("distortion: ", distortion)
plt.scatter(fe[:,0], fe[:,1], c='g')
plt.scatter(codebook[:, 0], codebook[:, 1], c='r')
plt.show()
#Displaying clustering results in a coordinate systemThe results are:
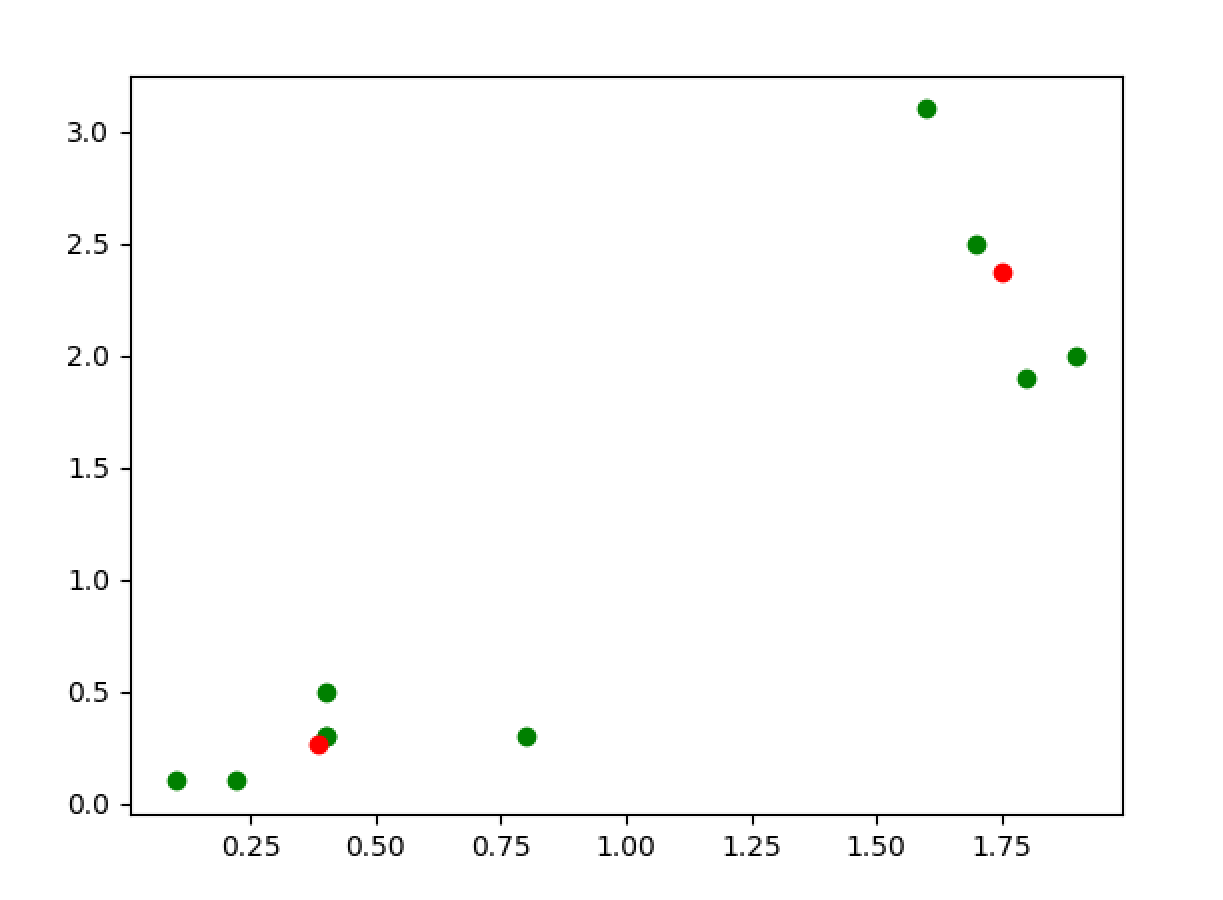
Where red is the cluster center.
2. Example of clustered color extraction
(1) PIL color extraction
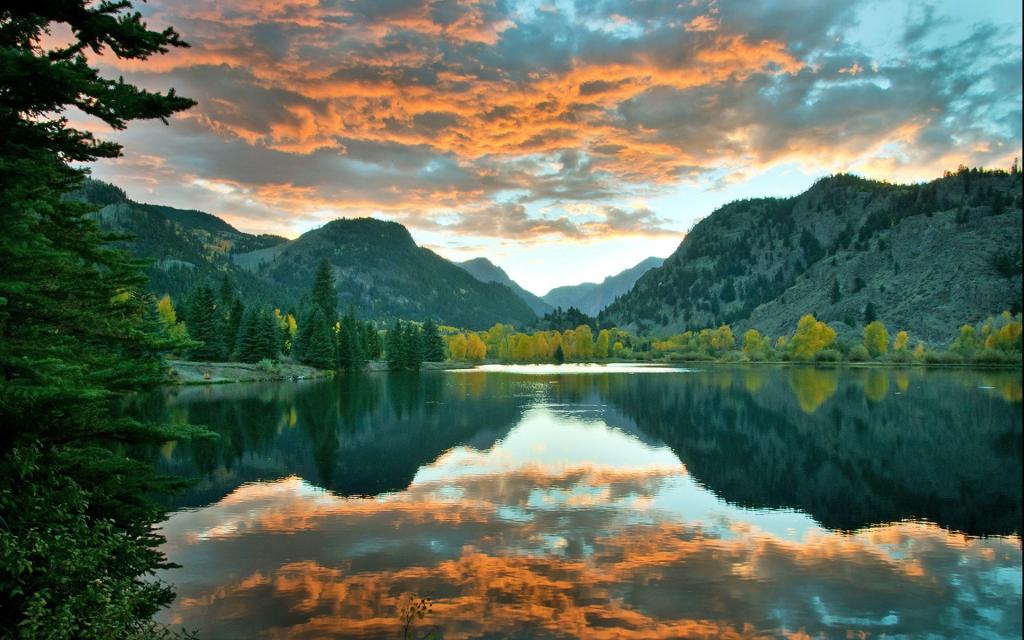
This code uses PIL to extract colors from pictures and sort the frequency of colors to output the colors of a specific sequence.
The pictures to be analyzed are as follows:
The code is as follows:
from PIL import Image, ImageDraw, ImageFont
#Introducing third-party libraries

def get_dominant_colors(infile):
    #Define a function to get the color of a picture
    image = Image.open(infile)
    #Read pictures

    small_image = image.resize((80, 80))
    #Reduce picture size, reduce computation

    result = small_image.convert("P", palette=Image.ADAPTIVE, colors=5)
    #Get five main colors in the picture

    palette = result.getpalette()
    color_counts = sorted(result.getcolors(), reverse=True)
    colors = list()
    #Sort colors

    for i in range(5):
        palette_index = color_counts[i][1]
        dominant_color = palette[palette_index * 3 : palette_index * 3 + 3]
        colors.append(tuple(dominant_color))
        #Define the format for color data output

    return colors

image_path = "pic.jpg"
color = get_dominant_colors(image_path)
#Enter a specific picture to process
print(color)
The results are as follows:

(2) Clustering pictures
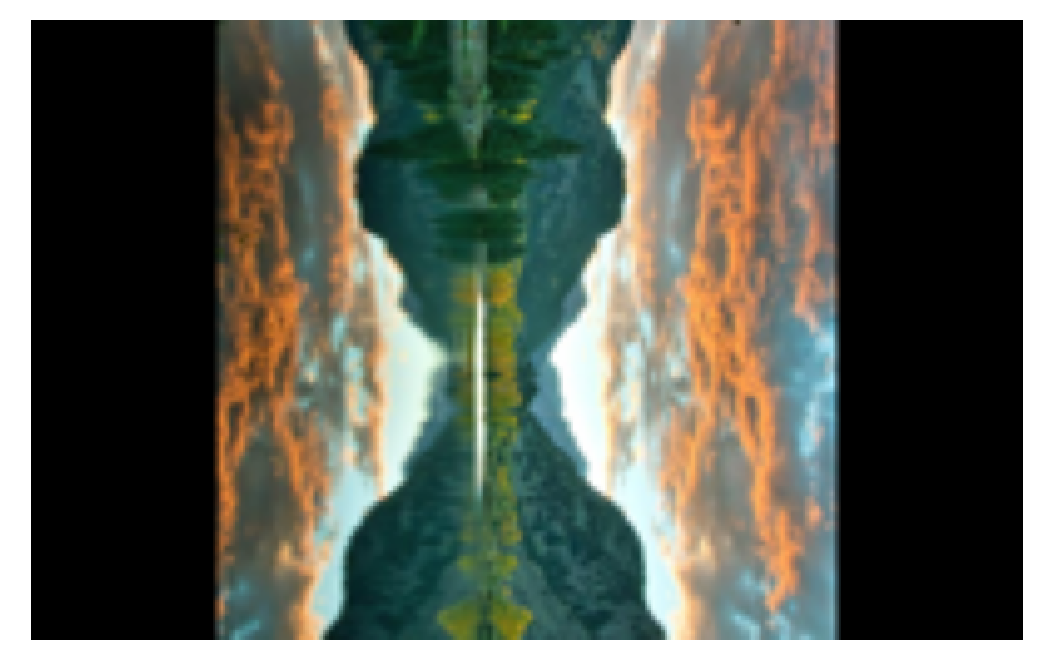
Pictures are first thumbnailed using PIL, then clustered on thumbnails.
The code is as follows:
import os
from PIL import Image
import matplotlib.pyplot as plt
import numpy as np
im=np.array(Image.open('pic.jpg'))
#Clustering with thumbnails
def colorz(filename,n=3):
img=Image.open(filename)
img=img.rotate(-90)
img.thumbnail((200,200))
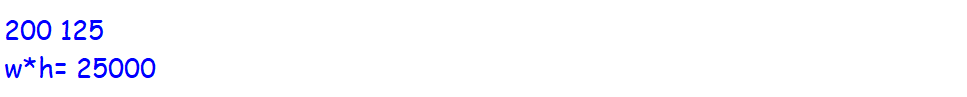
w,h=img.size
print(w,h)
print('w*h=',w*h)
plt.axis('off')
plt.imshow(img)
plt.show()
points=[]
for count,color in img.getcolors(w*h):
points.append(color)
return points
colorz('pic.jpg',3)
The results are as follows:
(3) Colour clustering
The code is as follows:
import numpy as np
from scipy.cluster.vq import vq, kmeans, whiten
import matplotlib.pyplot as plt
from PIL import Image
#Clustering with thumbnails
def colorz(filename,n=3):
img=Image.open(filename)
img=img.rotate(-90)
img.thumbnail((200,200))
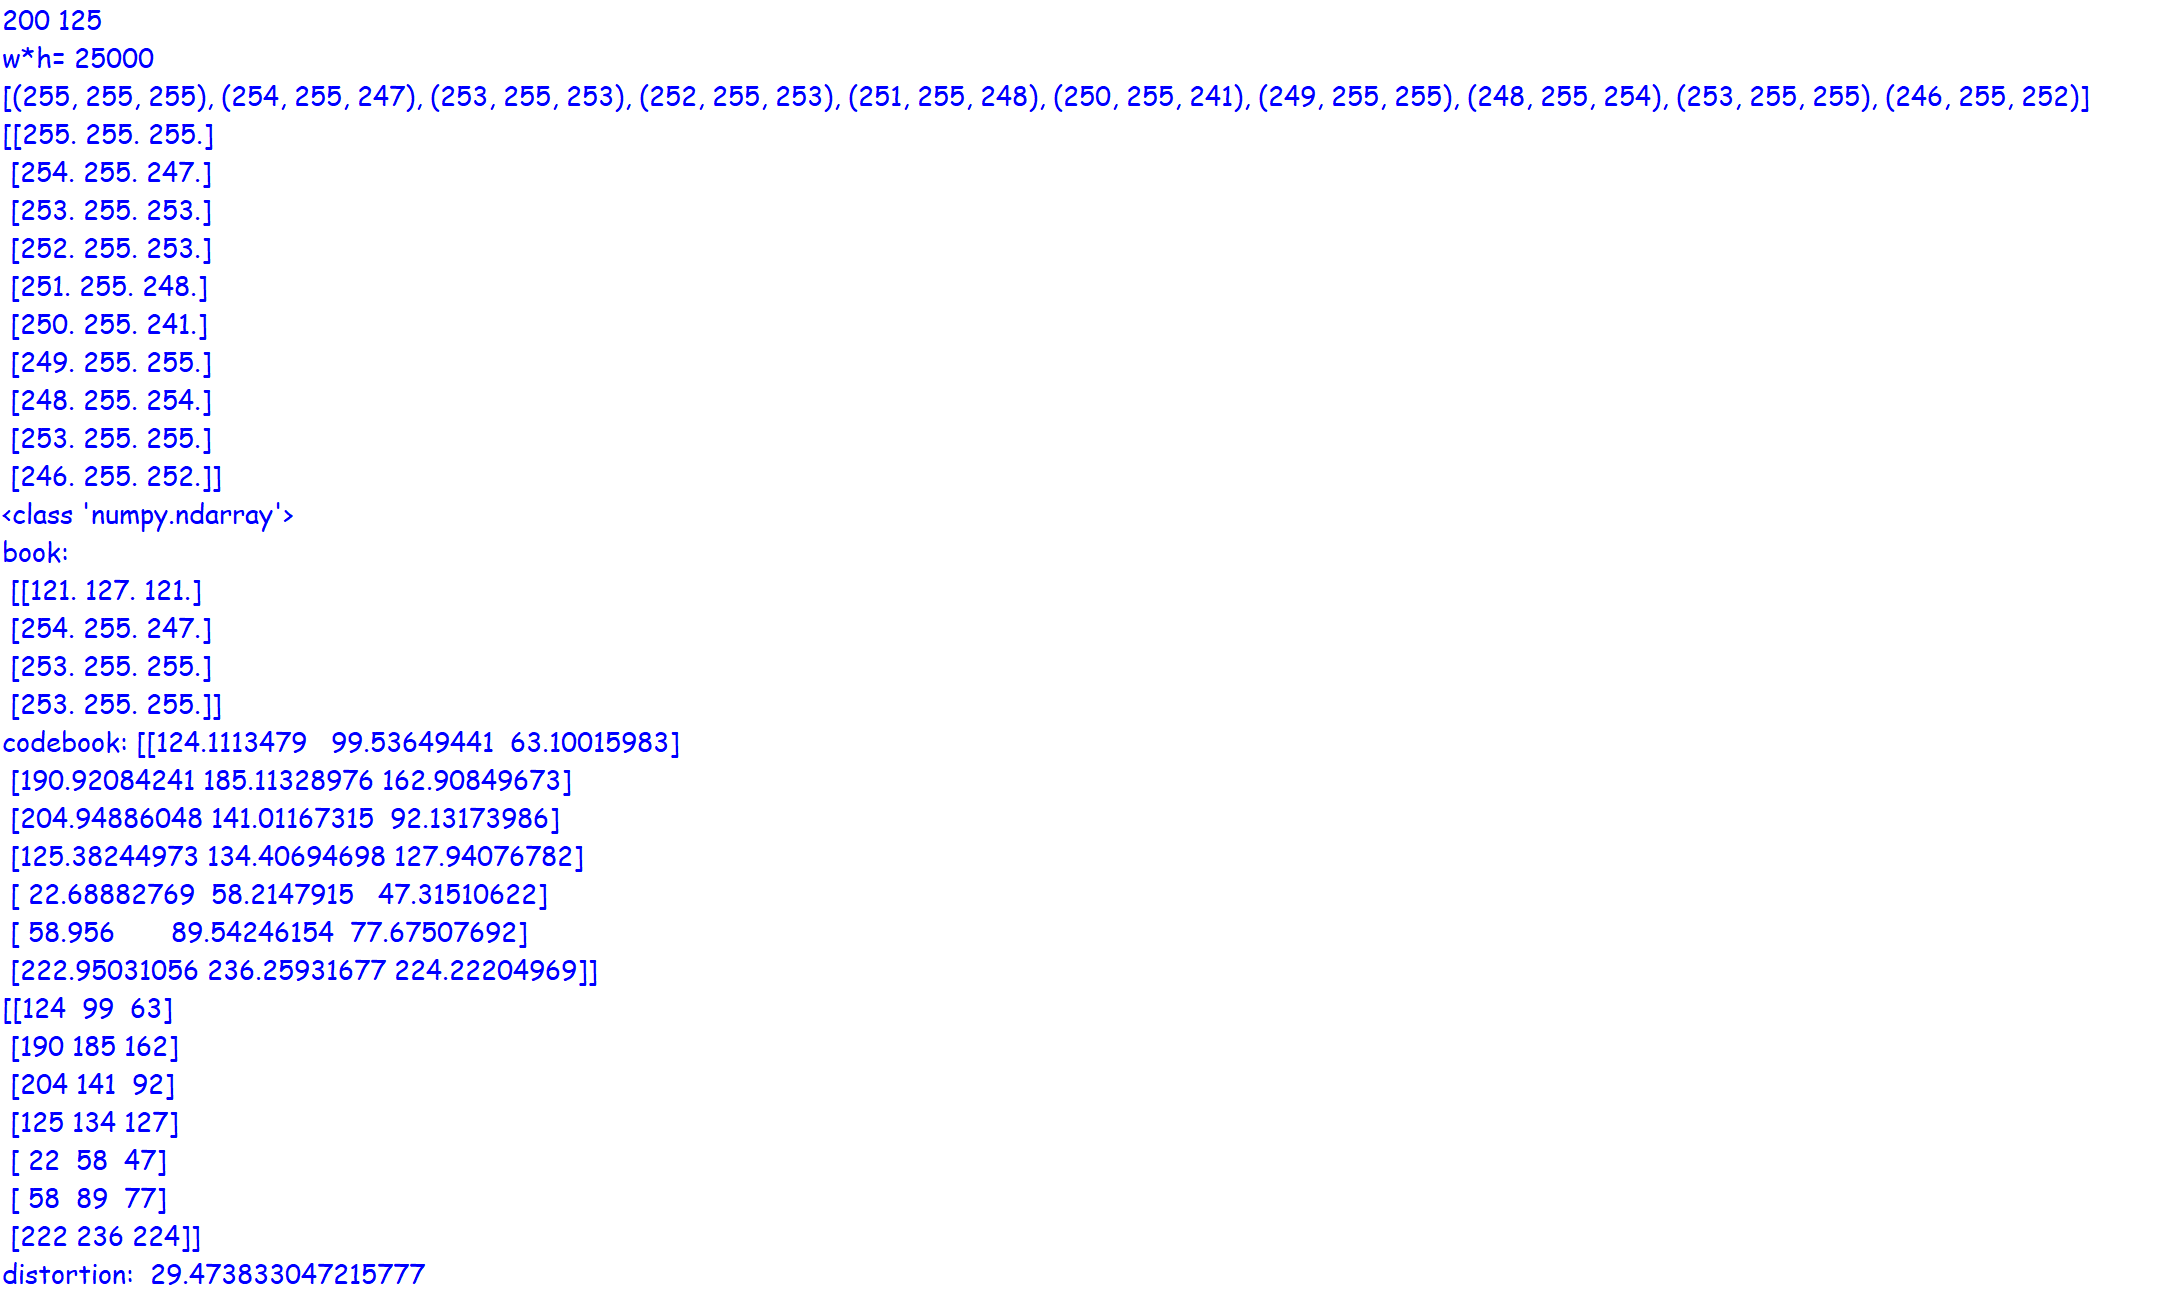
w,h=img.size
print(w,h)
print('w*h=',w*h)
plt.axis('off')
plt.imshow(img)
plt.show()
points=[]
for count,color in img.getcolors(w*h):
points.append(color)
return points
points=colorz('pic.jpg',3)
print(points[0:10])
fe = np.array(points,dtype=float) #Clustering needs to be Float or Double
print(fe[0:10])
book =np.array((fe[100],fe[1],fe[8],fe[8])) #Cluster center, initial value
print(type(book))
print("book: \n",book)
#codebook, distortion = kmeans(fe,book)
codebook, distortion = kmeans(fe,7) #7 is the number of cluster centers
# You can write kmeans(wf,2), 2 for both centroids, with the iter parameter enabled
print("codebook:", codebook) #Cluster Center
centers=np.array(codebook,dtype=int) #To change to color, you have to change to an integer
print(centers)
print("distortion: ", distortion)
fe=np.array(points)
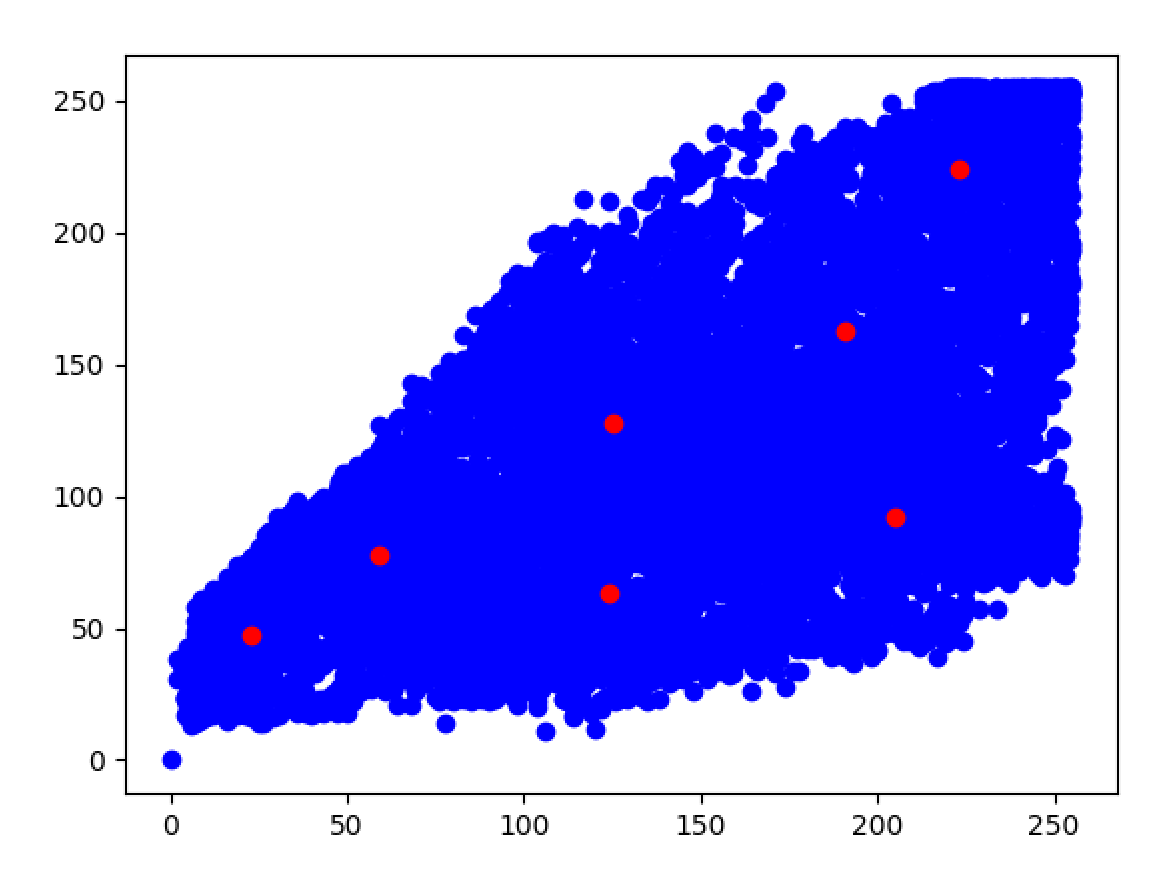
plt.scatter(fe[:,0], fe[:,2], c='b')
plt.scatter(codebook[:, 0], codebook[:,2], c='r') #Cluster Center
plt.show()The results are as follows:
3. Clustering+Flask
(1) Defining Web Page Styles
The code is as follows:
<br>
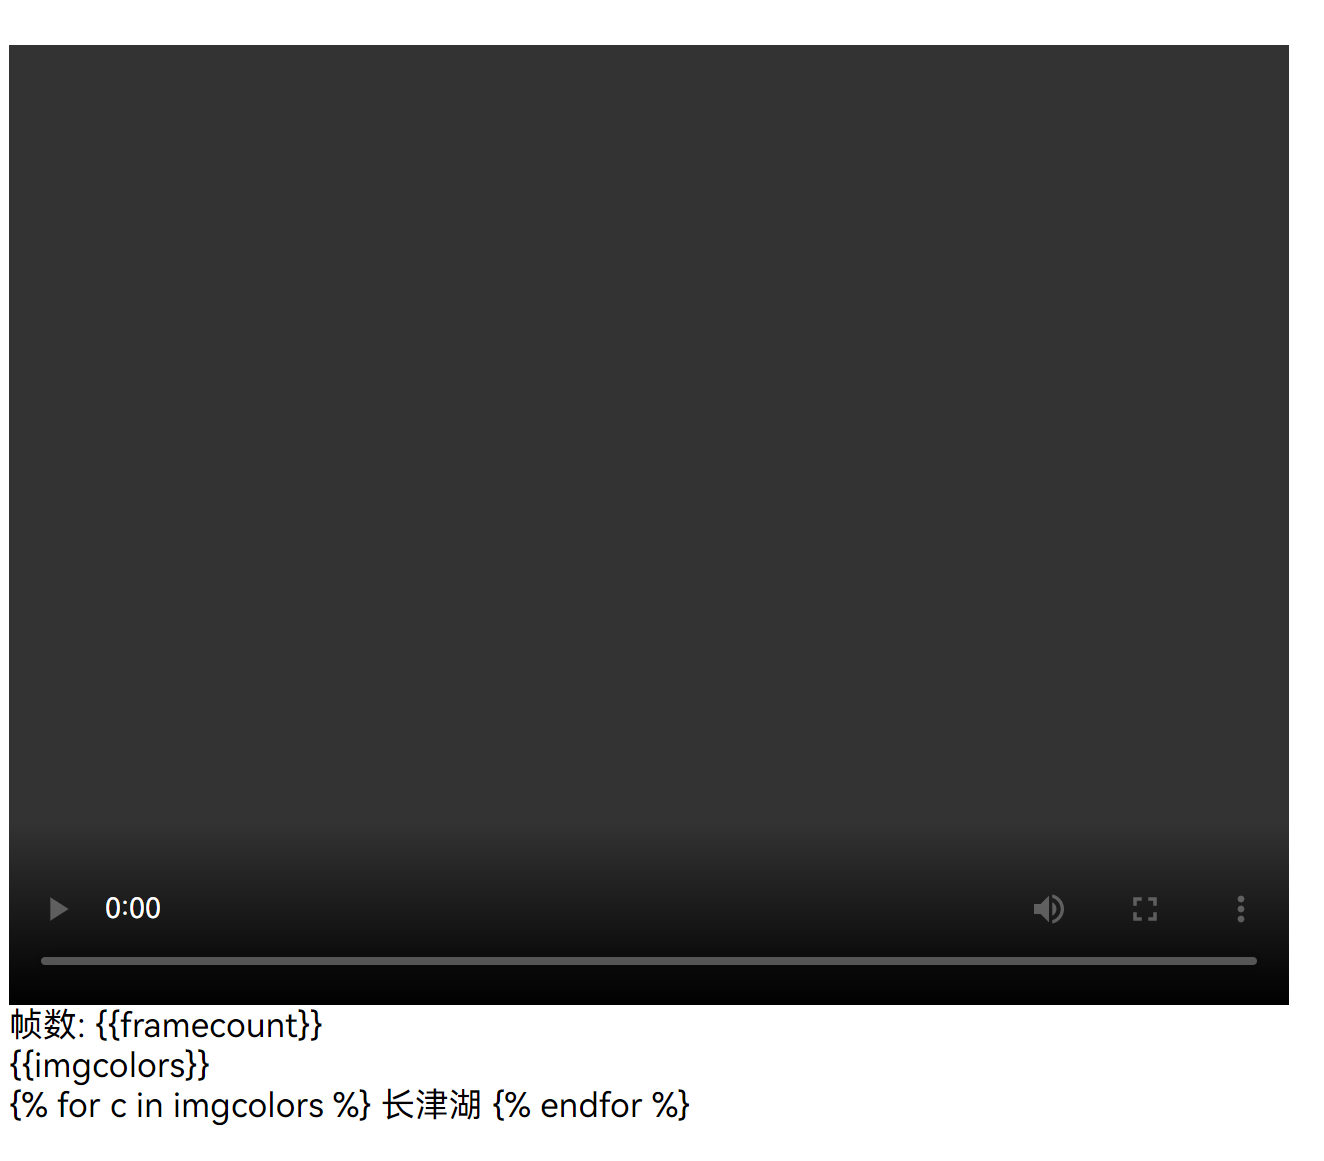
<video width="640" height="480" controls autoplay>
<source src="static/cjh-short.mp4" type="video/mp4">
<object data="static/cjh-short.mp4" width="640" height="480">
<embed width="640" height="480" src="static/cjh-short.mp4">
</object>
</video>
<br>
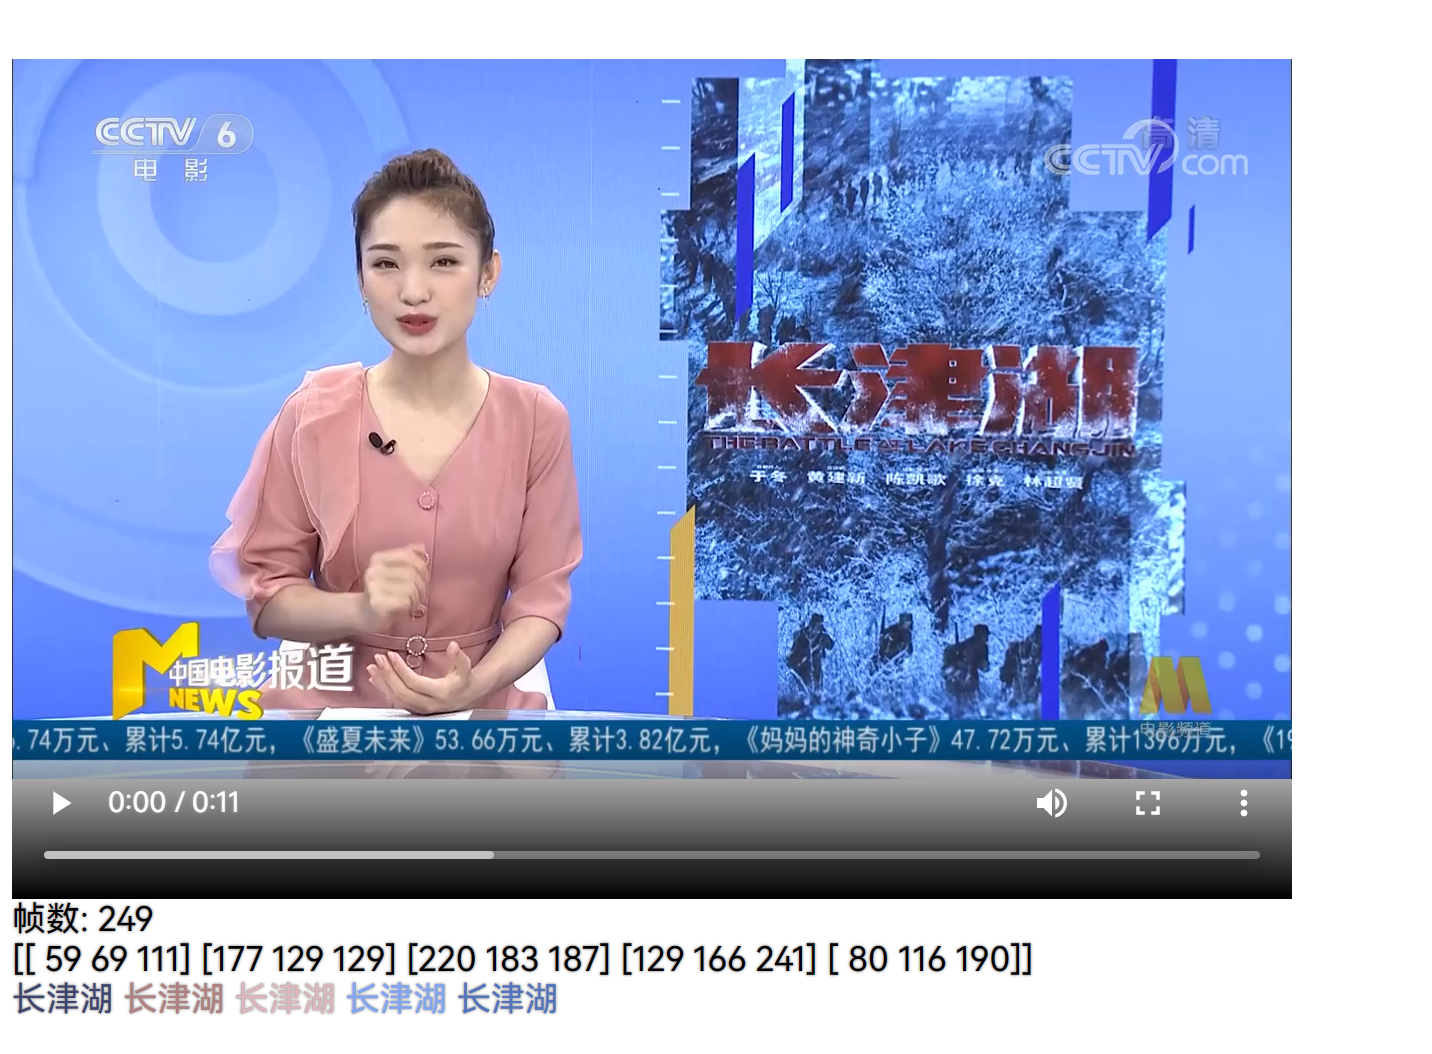
Number of frames: {{framecount}}<br>
{{imgcolors}}<br>
{% for c in imgcolors %}
<font styLe="color:rgb({{c[0]}}, {{c[1]}}, {{c[2]}})">Changjin Lake</font>
{% endfor %}
<br>The results are as follows:
(2) Cluster code implementation
The code is as follows:
import numpy as np
from PIL import Image
from scipy.cluster.vq import vq, kmeans, whiten
from flask import Flask,render_template,request
import imageColor
#Import Third Party Library
app=Flask(__name__)
def colorz(filename,n=3):
img=Image.open(filename)
img=img.rotate(-90)
img.thumbnail((200,200))
w,h=img.size
print(w,h)
print('w*h=',w*h)
points=[]
for count,color in img.getcolors(w*h):
points.append(color)
return points
#Defining color functions
def kmeansColor(img,n):
points=colorz(img,3)
fe = np.array(points,dtype=float)
codebook, distortion = kmeans(fe,n)
centers=np.array(codebook,dtype=int)
return centers
#Define Cluster Functions
@app.route('/')
def index():
#return "Hi,Flask!"
#genFrame()
pic='static/pic/image'
framecount=249
imgcolors=imageColor.kmeansColor('static/pic/image0.jpg',5)
return render_template('index.html',pic1=pic,framecount=framecount,imgcolors=imgcolors)
#Loading program results to the web
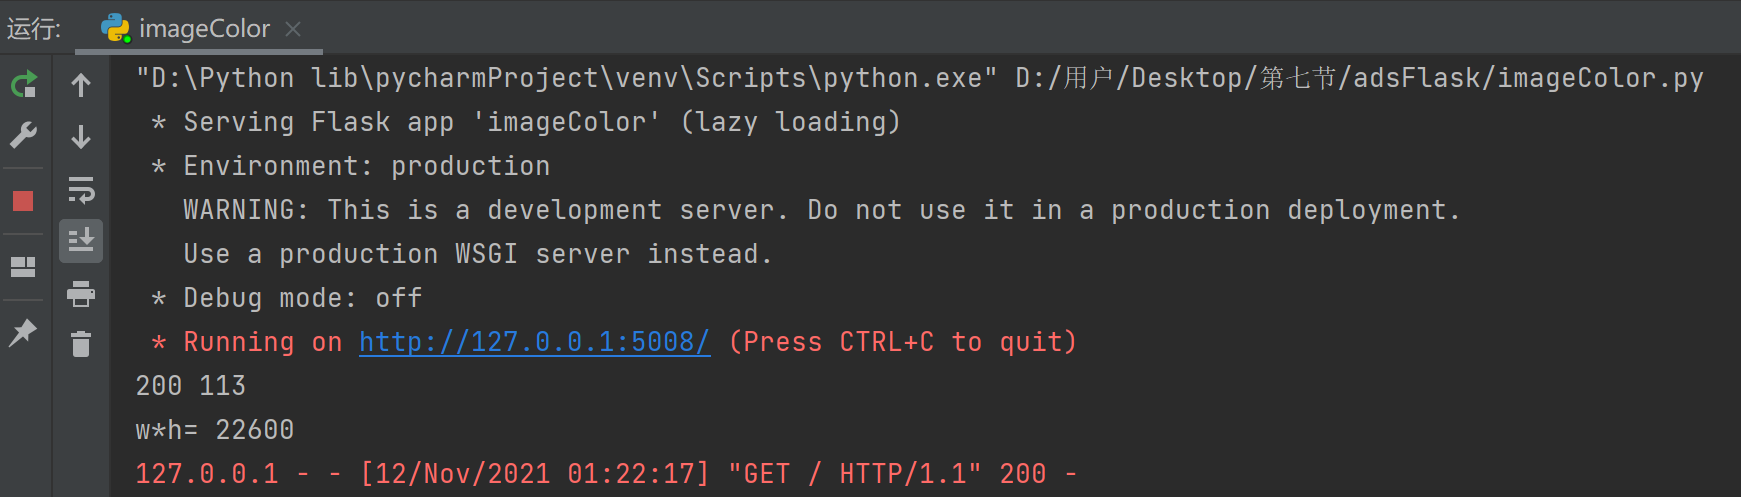
if "__main__"==__name__:
app.run(port="5008")
#Run the programThe results are as follows: