1, Introduction to spark structured streaming checkpoint location
Structured Streaming was introduced in spark version 2.0 in 2016. It is an extensible and fault-tolerant stream processing engine based on Spark SQL Engine. Compared with traditional Spark Streaming, due to the reuse of Spark SQL Engine, the code writing method is the same as batch processing API (based on Dataframe and Dataset API), and these APIs are very simple.
Structured Streaming also supports the use of event time to process delayed data by setting watermark; Spark Streaming can only be calculated based on process time, which is obviously not enough.
such as . withWatermark("timestamp", "10 minutes") Represents the data in the DataFrame timestamp Field as event time. If event time is more than 10 minutes behind process time, these data will not be processed.
Structured Streaming still uses micro batch mode to process data by default, but Spark 2.3 has provided a method called Continuous Processing The model can be semantic at least once, and the data end-to-end only takes 1ms.
However, the Web UI of Structured Streaming does not have the same monitoring indicators as Spark Streaming.
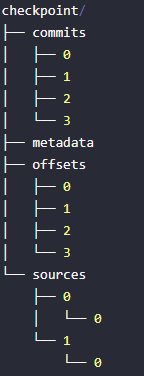
Structure of Checkpoint Directory:
1. Checkpoint location is in the source code call chain
Analyzing the source code and viewing the StructuredStreaming startup process, it is found that the DataStreamWriter#start method starts a StreamingQuery.
At the same time, pass the checkpoint location configuration parameter to StreamingQuery management.
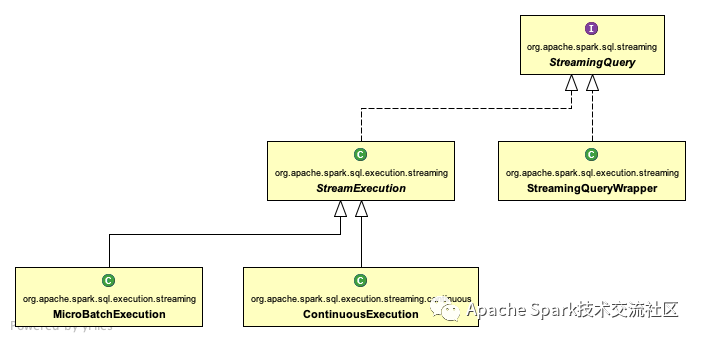
The implementation relationship of StreamingQuery interface is as follows:
-
The StreamingQueryWrapper wraps only one non serializable StreamExecution
-
StreamExecution manages the executor of Spark SQL queries
-
MicroBatchExecution microbatch executor
-
Continuous processing (streaming) actuator
So we only need to analyze checkpointLocation's call in StreamExecution.
Note: protected def checkpoint file (Name: String) in StreamExecution: the string method returns the path of $checkpoint file / name for all logic related to checkpoint location
2. MetadataLog (metadata log interface)
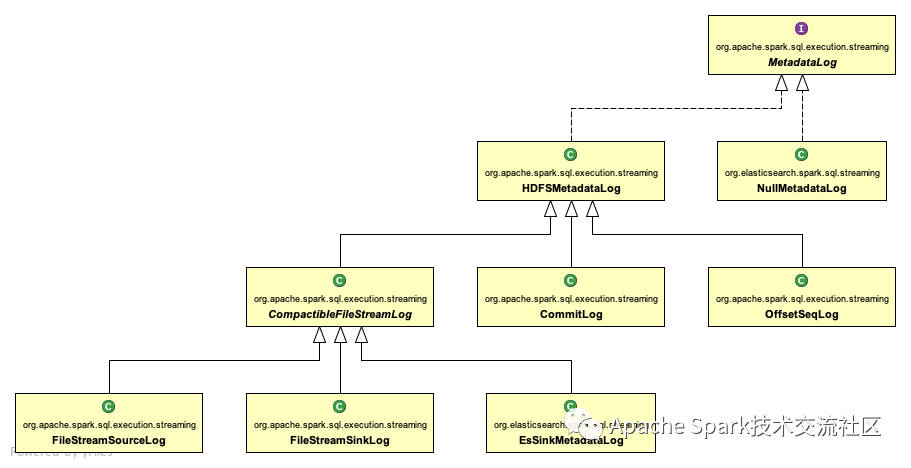
Spark provides the org.apache.spark.sql.execution.streaming.MetadataLog interface for unified processing of metadata log information.
The contents of the checkpoint location file are maintained using MetadataLog.
The analysis interface implementation relationship is as follows:
Class function description:
-
NullMetadataLog is an empty log, that is, it is discarded directly without outputting the log
-
HDFSMetadataLog uses HDFS as the metadata log output
-
CommitLog commit log
-
OffsetSeqLog offset log
-
Compatible filestreamlog encapsulates MetadataLog that supports merging and deleting history records by size
-
Logging when the StreamSourceLog file type is used as a data source
-
When the FileStreamSinkLog file type is used as the data receiving end, the log is recorded
-
EsSinkMetadataLog Es is used as the data receiver for logging
The analysis of compactablefilestreamlog#compact consolidation logic is briefly described as follows: suppose 0,1,2,3,4,5,6,7,8,9,10 batches arrive here, the consolidation size is 3, the current consolidation result is' 0,1,2.compact,3,4 ', and the next consolidation result is' 0,1,2.compact,3,4,5.compact', **Note: 5. Compact file content = 2.compact + 3 + 4**last.compact file size will increase infinitely with batch operation
Analyze the logic of deleting expired files by CompactibleFileStreamLog: when the CompactibleFileStreamLog#add method is called, it will determine whether the delete operation is supported by default. Override def add (batchid: long, logs: array [t]): Boolean = {val batchadded = if (iscompressionbatch (batchid, compactinterval)) {/ / merge compact (batchid, logs)} else {super.add (batchid, logs) }If (batchadded & & isdeletingexpiredlog) {/ / adding succeeds and deleting expired files is supported. / / judge whether the current batch is outside the spark.sql.streaming.minBatchesToRetain configuration and within the file retention time during deletion. / / for configuration items, refer to section 4 solution configuration instructions deleteexpiredlog (batchid)} batchadded}
3, Analyze the contents of the checkpoint location directory
At present, the content of checkpoint location mainly includes the following directories
-
offsets
-
commits
-
metadata
-
sources
-
sinks
3.1 offsets directory
Record the offset in each batch. To ensure that a given batch always contains the same data, write the data to this log record before processing it.
The nth record in this log indicates that it is currently being processed, and the N th-1 entry indicates which offsets have been processed.
// In StreamExecution, Val offsetlog = new offsetseqlog (sparksession, checkpoint file ("offsets"))
// The sample contents of the log are as follows: file path = checkpoint location / offsets / 560504v1{"batchwatermarkms": 0, "batchtimestampms": 1574315160001, "conf": {"spark. SQL. Streaming. Statestore. Providerclass": "org. Apache. Spark. SQL. Execution. Streaming. State. Hdfsbackedstatestoreprovider", "spark. SQL. Streaming. Flatmapgroupswithstate. Stateformatversion": "2", "spark.sql.streaming.multipleWatermarkPolicy":"min","spark.sql.streaming.aggregation.stateFormatVersion":"2","spark.sql.shuffle.partitions":"200"}}{"game_dc_real_normal":{"17":279843310,"8":318732102,"11":290676804,"2":292352132,"5":337789356,"14":277147358,"13":334833752,"4":319279439,"16":314038811,"7":361740056,"1":281418138,"10":276872234,"9 ":244398684,"3":334708621,"12":290208334,"15":267180971,"6":296588360,"0":350011707}}
3.2 commitLog directory
Record the completed batch, restart the task, check and compare the completed batch with the offsets batch record, and determine the next running batch
StreamExecution in val commitLog = new CommitLog(sparkSession, checkpointFile("commits"))// The sample contents of the log are as follows: file path = checkpoint location / commits / 560504v1{"nextbatchwatermarkms": 0}
3.3 metadata directory
Metadata is the metadata associated with the entire query. Currently, only the current job id is reserved
StreamExecution in val offsetLog = new OffsetSeqLog(sparkSession, checkpointFile("offsets"))// The sample contents of the log are as follows: file path = checkpoint location / metadata {"Id": "5314beeb-6026-485b-947a-cb088a9c9bac"}
3.4 sources directory
When the sources directory is the data source, read the details of each batch
3.5 sinks directory
When the sinks directory is the sink, write out the details of the batch
In addition, if there is a state calculation in the task, there will also be a state Directory: record status. When there are state operations, such as cumulative aggregation, de duplication, maximum and minimum, this directory will be used to record these state data. Directory structure: checkpoint/state/xxx.delta, checkpoint/state/xxx.snapshot. The new. Snapshot is a file generated by merging the old. Snapshot and. Delta. Structured Streaming periodically generates a. Snapshot file to record the status according to the configuration.
2, Spark Structured Streaming docking Grafana monitoring
Structured Streaming has a StreamingQueryListener For asynchronous reporting metrics, this is a Official example:
val spark: SparkSession = ...

spark.streams.addListener(new StreamingQueryListener() {
    override def onQueryStarted(queryStarted: QueryStartedEvent): Unit = {
        println("Query started: " + queryStarted.id)
    }
    override def onQueryTerminated(queryTerminated: QueryTerminatedEvent): Unit = {
        println("Query terminated: " + queryTerminated.id)
    }
    override def onQueryProgress(queryProgress: QueryProgressEvent): Unit = {
        println("Query made progress: " + queryProgress.progress)
    }
})
Meaning of StreamingQuery API:
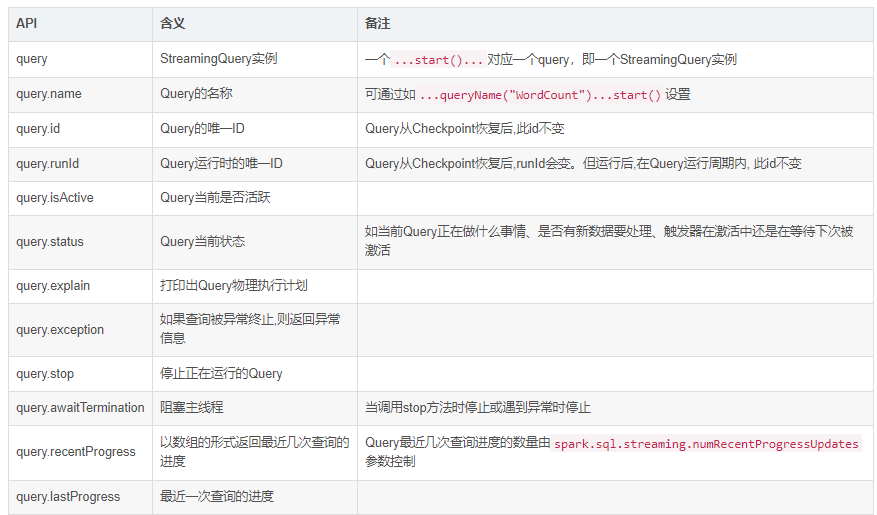
If we monitor, we mainly use onQueryProgress Method to report data to the monitoring system.
import com.codahale.metrics.graphite.{Graphite, GraphiteReporter}
import com.codahale.metrics.{Gauge, MetricFilter, MetricRegistry}
import org.apache.spark.sql.streaming.StreamingQueryListener

import java.net.InetSocketAddress
import java.util.concurrent.TimeUnit

class SparkStreamingGraphiteMetrics(prefix: String, graphiteHostName: String, graphitePort: Int) extends StreamingQueryListener {
  val metrics = new MetricRegistry()
  var inputRowsPerSecond = 0D
  var processedRowsPerSecond = 0D
  var numInputRows = 0D
  var triggerExecution = 0L
  var batchDuration = 0L
  var sourceEndOffset = 0L
  var sourceStartOffset = 0L

  override def onQueryStarted(event: StreamingQueryListener.QueryStartedEvent): Unit = {
    val graphite = new Graphite(new InetSocketAddress(graphiteHostName, graphitePort))
    val reporter: GraphiteReporter = GraphiteReporter
      .forRegistry(metrics)
      .prefixedWith(s"spark_structured_streaming_${prefix}") // Index name prefix, easy to use in Grafana
      .convertRatesTo(TimeUnit.SECONDS)
      .convertDurationsTo(TimeUnit.MILLISECONDS)
      .filter(MetricFilter.ALL)
      .build(graphite)
    reporter.start(30, TimeUnit.SECONDS)
    metrics.register(s"inputRowsPerSecond", new Gauge[Double] {
      override def getValue: Double = inputRowsPerSecond
    })
    metrics.register(s"processedRowsPerSecond", new Gauge[Double] {
      override def getValue: Double = processedRowsPerSecond
    })
    metrics.register("numInputRows", new Gauge[Double] {
      override def getValue: Double = numInputRows
    })
    metrics.register("triggerExecution", new Gauge[Long] {
      override def getValue: Long = triggerExecution
    })
    metrics.register("batchDuration", new Gauge[Long] {
      override def getValue: Long = batchDuration
    })
    metrics.register("sourceEndOffset", new Gauge[Long] {
      override def getValue: Long = sourceEndOffset
    })
    metrics.register("sourceStartOffset", new Gauge[Long] {
      override def getValue: Long = sourceStartOffset
    })
  }

  override def onQueryProgress(event: StreamingQueryListener.QueryProgressEvent): Unit = {
    // Assign and report each indicator
    inputRowsPerSecond = event.progress.inputRowsPerSecond
    processedRowsPerSecond = event.progress.processedRowsPerSecond
    numInputRows = event.progress.numInputRows
    triggerExecution = event.progress.durationMs.getOrDefault("triggerExecution", 0L)
    batchDuration = event.progress.batchDuration
    event.progress.sources.foreach(source => {
      sourceEndOffset = source.endOffset.toLong
      sourceStartOffset = source.startOffset.toLong
    })
  }

  override def onQueryTerminated(event: StreamingQueryListener.QueryTerminatedEvent): Unit = {
    println("onQueryTerminated")
  }
}
Add listening in the main program:
spark.streams.addListener(xxxxxx)
Graphite needs to be started_ Exporter, just find a server with two default ports:
- 9109 is used to report data, i.e. spark - > graphite_ exporter
- 9108 is Prometheus from graphite_ The exporter is used to pull data
You also need to create a profile in Prometheus prometheus.yml Read data is configured inside
scrape_configs:
- job_name: 'spark'
  static_configs:
  - targets: ['192.168.1.xx:9108']
Finally, after starting the spark program, you can configure the chart in Grafana.
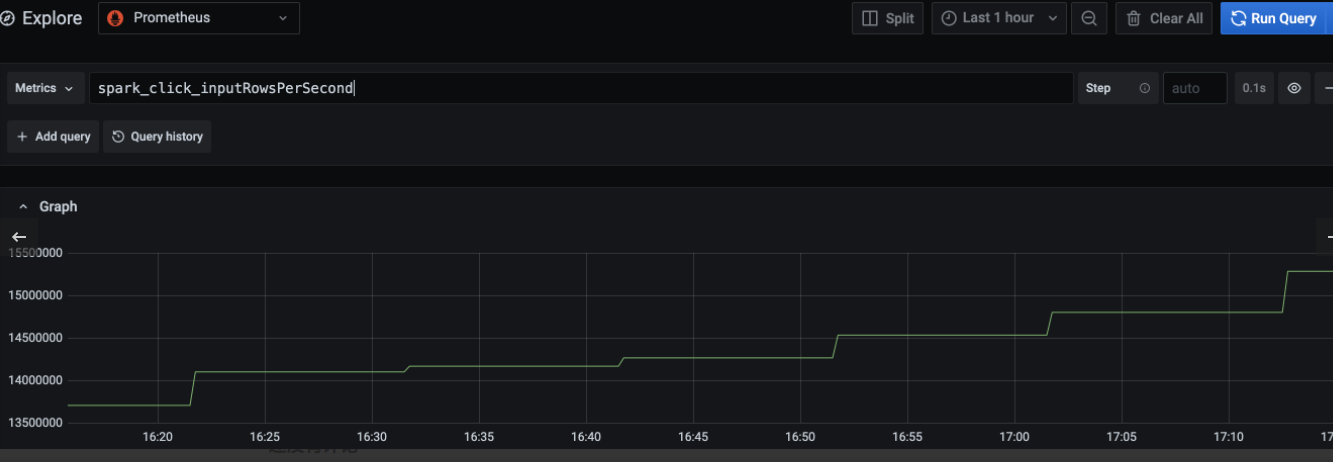
Configure Grafana chart
Like I set it up prefix yes Click, then the Explore module in Grafana can select the Prometheus data source and input indicators spark_click_inputRowsPerSecond , Click Query to get the reading rate, as shown in the figure below:
3, Submit Offset to Kafka based on StreamingQueryListener
We can submit offset to kafka on the basis of sparkstreaminggraphitemetry. As shown below
import com.fasterxml.jackson.databind.{DeserializationFeature, ObjectMapper}
import com.fasterxml.jackson.module.scala.DefaultScalaModule
import org.apache.kafka.clients.consumer.{KafkaConsumer, OffsetAndMetadata}
import org.apache.kafka.common.TopicPartition
import org.apache.spark.sql.streaming.StreamingQueryListener.QueryProgressEvent

import java.util
import java.util.Properties

class KafkaOffsetCommiter(prefix: String, graphiteHostName: String, graphitePort: Int, kafkaProperties: Properties) extends SparkStreamingGraphiteMetrics(prefix: String, graphiteHostName: String, graphitePort: Int) {

  val kafkaConsumer = new KafkaConsumer[String, String](kafkaProperties)

  // Submit Offset
  override def onQueryProgress(event: QueryProgressEvent): Unit = {
    super.onQueryProgress(event)
    // Traverse all sources
    event.progress.sources.foreach(source => {

      val objectMapper = new ObjectMapper()
        .configure(DeserializationFeature.FAIL_ON_UNKNOWN_PROPERTIES, false)
        .configure(DeserializationFeature.USE_LONG_FOR_INTS, true)
        .registerModule(DefaultScalaModule)

      val endOffset = objectMapper.readValue(source.endOffset, classOf[Map[String, Map[String, Long]]])

      // Traverse each Topic in the Source
      for ((topic, topicEndOffset) <- endOffset) {
        val topicPartitionsOffset = new util.HashMap[TopicPartition, OffsetAndMetadata]()

        //Traverse each Partition in the Topic
        for ((partition, offset) <- topicEndOffset) {
          val topicPartition = new TopicPartition(topic, partition.toInt)
          val offsetAndMetadata = new OffsetAndMetadata(offset)
          topicPartitionsOffset.put(topicPartition, offsetAndMetadata)
        }
        kafkaConsumer.commitSync(topicPartitionsOffset)
      }
    })
  }
}