catalogue
- What are the types of Native crashes
- How to capture and collect Native crashes
- How to analyze and locate Native crashes
- data
- harvest
We know that Java crash is caused by uncapped exceptions in Java code, resulting in program abnormal exit. Common exceptions include NPE, OOM, ArrayIndexOutOfBoundsException, IllegalStateException, ConcurrentModificationException, etc. There is another kind of crash that we have to pay attention to, that is, the Native layer crash. This kind of crash does not clearly see the stack information and specific crashes like the Java layer crash. Whenever you encounter problems, you should find and analyze them. The purpose of writing this article is to help you make records and hope to help you with similar problems. Let's start learning and practice together. The demo of learning and practice in this paper is based on the experience in Zhang Shaowen's Android Development Master course example conduct.
1, What are the types of Native crashes
Let's create a Native crash first. Let's take a look at the Native crash information
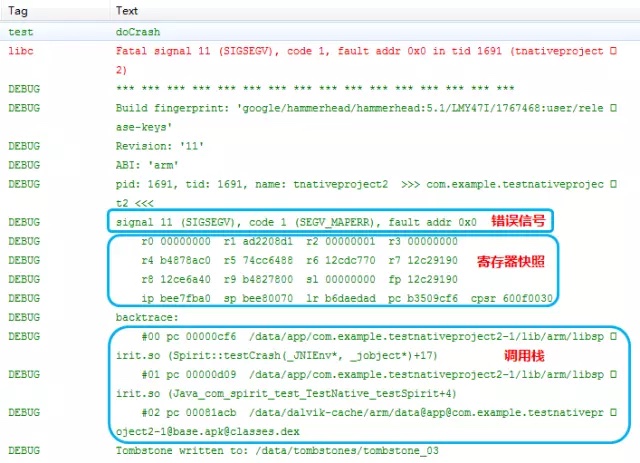
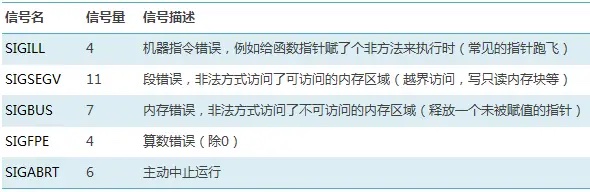
Picture from: Blade iron: common Android Native crashes and error causes We can see three related information Signal xx: represents the error type. We can initially judge the type of crash from the error type. The common Native crashes are as follows. The probability of SIGSEGV is basically the highest.
The next step is the register snapshot, which can not directly see the problem, and fault addr is a key information, which will be used in the subsequent analysis and positioning.
The next step is to call the stack, which is also very important. It can directly help us see the stack information of Crash, but the so of the signed table can be converted to the corresponding function name and number of rows, otherwise it is difficult to understand.
2, How to capture and collect Native crashes
Common Native crash capture tools: BreakPad of Chromium and bugly of Tencent Let's practice through learning Breakpad To collect Natvie crashes. Breakpad is a cross platform open source project. In this section, we will learn how to compile and use it in practice
2.1 let's first look at the working principle of Breakpad
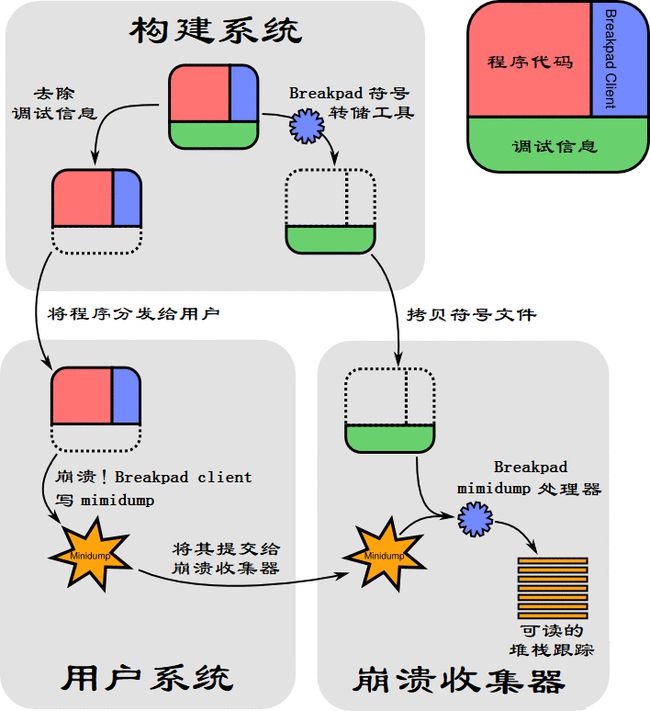
Picture from: Learn this unique skill and let C + + Crash!
2.2 the compilation and installation process is as follows:
- Download [Breakpad] source code( https://chromium.googlesource.com/breakpad/breakpad/+/master)
- Download and configure depot_tools
- Breakpad relies on LSS and downloads it( https://github.com/adelshokhy112/linux-syscall-support )And put the linux_syscall_support.h file in LSS into the directory of breakpad/src/third_party/lss /;
- Compile breakpad. / configure & & make & & sudo make install
After the compilation and installation are successful, you can see the generated / usr/local/bin/minidump_dump and / usr/local/bin/minidump_stackwalk tools. These command tools will be used in the later positioning analysis
2.3 integrating Breakpad into Android project
Copy the src folder in the source code of Google breakpad to the src/main/cpp directory of the project; Configure cmake or makefile. Here we use cmake cmake_minimum_required(VERSION 3.4.1)
#Set the breakpad root path
set(BREAKPAD_ROOT ${CMAKE_CURRENT_SOURCE_DIR})

#Set the path to the header file
include_directories(${BREAKPAD_ROOT}/src ${BREAKPAD_ROOT}/src/common/android/include)

#A file that categorizes the cpp code to compile
file(GLOB BREAKPAD_SOURCES_COMMON
        ${BREAKPAD_ROOT}/src/client/linux/crash_generation/crash_generation_client.cc
        ${BREAKPAD_ROOT}/src/client/linux/dump_writer_common/thread_info.cc
        ${BREAKPAD_ROOT}/src/client/linux/dump_writer_common/ucontext_reader.cc
        ${BREAKPAD_ROOT}/src/client/linux/handler/exception_handler.cc
        ${BREAKPAD_ROOT}/src/client/linux/handler/minidump_descriptor.cc
        ${BREAKPAD_ROOT}/src/client/linux/log/log.cc
        ${BREAKPAD_ROOT}/src/client/linux/microdump_writer/microdump_writer.cc
        ${BREAKPAD_ROOT}/src/client/linux/minidump_writer/linux_dumper.cc
        ${BREAKPAD_ROOT}/src/client/linux/minidump_writer/linux_ptrace_dumper.cc
        ${BREAKPAD_ROOT}/src/client/linux/minidump_writer/minidump_writer.cc
        ${BREAKPAD_ROOT}/src/client/minidump_file_writer.cc
        ${BREAKPAD_ROOT}/src/common/convert_UTF.c
        ${BREAKPAD_ROOT}/src/common/md5.cc
        ${BREAKPAD_ROOT}/src/common/string_conversion.cc
        ${BREAKPAD_ROOT}/src/common/linux/elfutils.cc
        ${BREAKPAD_ROOT}/src/common/linux/file_id.cc
        ${BREAKPAD_ROOT}/src/common/linux/guid_creator.cc
        ${BREAKPAD_ROOT}/src/common/linux/linux_libc_support.cc
        ${BREAKPAD_ROOT}/src/common/linux/memory_mapped_file.cc
        ${BREAKPAD_ROOT}/src/common/linux/safe_readlink.cc

        )
#Categorize assembly files to compile
file(GLOB BREAKPAD_ASM_SOURCE ${BREAKPAD_ROOT}/src/common/android/breakpad_getcontext.S
        )

set_source_files_properties(${BREAKPAD_ASM_SOURCE} PROPERTIES LANGUAGE C)

#Set the compiled files needed to generate the static library
add_library(breakpad STATIC ${BREAKPAD_SOURCES_COMMON} ${BREAKPAD_ASM_SOURCE})
#link
target_link_libraries(breakpad log)
2.4 add callback of breakpad
Uncaught exceptions in the java layer can be handled by UncaughtExceptionHandler. How to catch exceptions in the Native layer using Breakpad?
 google_breakpad::MinidumpDescriptor descriptor(path);
    static google_breakpad::ExceptionHandler eh(descriptor, NULL, DumpCallback, NULL, true, -1);
The details are as follows:
#include <stdio.h>
#include <jni.h>

#include "client/linux/handler/exception_handler.h"
#include "client/linux/handler/minidump_descriptor.h"


void onNativeCrash(const char* info) {
    JNIEnv *env = 0;
    jclass crashPinClass = env->FindClass(
            "com/test/crash/TestCrash");
    if (crashPinClass == NULL){
        return;
    }
    jmethodID crashReportMethod = env->GetStaticMethodID(crashPinClass,
            "onNativeCrash", "(Ljava/lang/String;)V");
    if (crashReportMethod == NULL) {
      return;
    }
    jstring crashInfo = env->NewStringUTF(info);
    env->CallStaticVoidMethod(crashPinClass, crashReportMethod, crashInfo);
}

//Crash callback
bool DumpCallback(const google_breakpad::MinidumpDescriptor &descriptor,
                  void *context,
                  bool succeeded) {
    onNativeCrash("");
    return succeeded;
}

extern "C"
JNIEXPORT void JNICALL
Java_com_sample_breakpad_BreakpadInit_initBreakpadNative(JNIEnv *env, jclass type, jstring path_) {
    const char *path = env->GetStringUTFChars(path_, 0);

    google_breakpad::MinidumpDescriptor descriptor(path);
    static google_breakpad::ExceptionHandler eh(descriptor, NULL, DumpCallback, NULL, true, -1);

    env->ReleaseStringUTFChars(path_, path);
}
Then load so and set the storage path of the dmp file generated after the crash. How should we analyze the collected crashes? In the following sections, we will continue to study and practice.
3, How to analyze and locate Native crashes
Before explaining several common analysis tools, let's first understand the difference between compiling and generating so with signed table and so without signed table.

We can see the difference between them through the file command
file cmake/debug/obj/arm64-v8a/libcrash-lib.so
 ELF 64-bit LSB shared object, ARM aarch64, version 1 (SYSV), dynamically linked, BuildID[sha1]=c776759b526457b5777fc8833f7fc0fcc46055cc, with debug_info, not stripped -->Not stripped debug Information, i.e. signed table
file transforms/stripDebugSymbol/debug/0/lib/arm64-v8a/libcrash-lib.so
ELF 64-bit LSB shared object, ARM aarch64, version 1 (SYSV), dynamically linked, BuildID[sha1]=c776759b526457b5777fc8833f7fc0fcc46055cc, stripped -->Strip debug Information, i.e. no symbol table
If we develop and compile our own so, we should back up or upload the so with symbol table when publishing, so as to facilitate the analysis and location of native crash. It should be noted that the md5 of so printed by different machines is different, so the corresponding so with symbolic table (so of different architectures in obj directory) should be saved after publishing
Now let's learn some common tools
3.1 minidump_stackwalk export crash stack information
This is the command tool we compiled in the above section. The usage is as follows:
minidump_stackwalk fd311404-a968-4ce0-17d5fa8a-61a8fdf1.dmp libcrash-lib.so >crash.log
The generated crash.log is as follows
CPU: arm64 8 CPUs

GPU: UNKNOWN

Crash reason:  SIGSEGV /SEGV_MAPERR
Crash address: 0x0
Process uptime: not available

Thread 0 (crashed)
 0  libcrash-lib.so + 0x5e0 -->Wrong address
     x0 = 0x0000007b14ac4e00    x1 = 0x0000007fedde9894
     x2 = 0x0000000000000000    x3 = 0x0000007b14a56c00
     x4 = 0x0000007feddeaa00    x5 = 0x0000007a7e1a7965
@
"crash.log" 2226L, 114492B
I need the next tool to continue the analysis. addr2line can convert the address to the corresponding function name and line number.
3.2 addr2line
The basic usage is as follows
Usage: aarch64-linux-android-addr2line [option(s)] [addr(s)]
 Convert addresses into line number/file name pairs.
 If no addresses are specified on the command line, they will be read from stdin
 The options are:

  -e --exe=<executable>  Set the input file name (default is a.out) Specify input file
  -f --functions         Show function names    Display function name
The path of the addr2line command is as follows. You can select the corresponding addr2line according to the cpu architecture of the device in the crash information.
arm: $NDK_PATH/toolchains/arm-linux-androideabi-4.9/prebuilt/darwin-x86_64/bin
arm64: $NDK_PATH/toolchains/aarch64-linux-android-4.9/prebuilt/darwin-x86_64/bin
Example We can see that the crash information in dump in Section 3.1 is arm64 and the crash address is 0x5e0. Let's use add2line for analysis
/Users/yangbin/Library/Android/android-ndk-r16b/toolchains/aarch64-linux-android-4.9/prebuilt/darwin-x86_64/bin/aarch64-linux-android-addr2line -f -e /Users/yangbin/work/avwork/thirdparty/nativecrash/Chapter01/sample/build/intermediates/cmake/debug/obj/arm64-v8a/libcrash-lib.so 0x5e0
_Z5Crashv
/Users/yangbin/work/avwork/thirdparty/nativecrash/Chapter01/sample/.externalNativeBuild/cmake/debug/arm64-v8a/../../../../src/main/cpp/crash.cpp:10
You can see that the corresponding error class and line number are output. Combined with the error cause, SIGSEGV can quickly analyze the specific cause.
3.3 script the above process
Create a new script dumptool.sh as follows: The usage is as follows: dumptool.sh. / test / TMP / fd311404-a968-4ce0-17d5fa8a-61a8fdf1.dmp crash.log Script from: Learn this unique skill and let C + + Crash!
#!/bin/bash

if [ $# != 3 ] ; then
echo "USAGE: $0 TARGET_NAME DMP_NAME OUTPUT_NAME"
echo " e.g.: $0 test fd311404-a968-4ce0-17d5fa8a-61a8fdf1.dmp crash.log"
exit 1;
fi

#Get input parameters
target_file_name=$1
dmp_file_name=$2
output_file_name=$3


getStackTrace() {
echo "@getStackTrace: start get StackTrace"
sym_file_name=$target_file_name'.sym'

#Gets the first line in the symbol file
line1=`head -n1 $sym_file_name`

#Gets the version number from the first line of string
OIFS=$IFS; IFS=" "; set -- $line1; aa=$1;bb=$2;cc=$3;dd=$4; IFS=$OIFS

version_number=$dd

#Create a specific directory structure and move the symbol file in
mkdir -p ./symbols/$target_file_name/$version_number
mv $sym_file_name ./symbols/$target_file_name/$version_number

#Redirect stack trace information to a file
minidump_stackwalk $dmp_file_name ./symbols > $output_file_name
}

main() {
getSymbol
if [ $? == 0 ]
then
getStackTrace
fi
}
3.4 ndk-stack
NDK stack is also a very useful tool. It needs to be analyzed in combination with the Tombstone (Tombstone file) at the time of crash.
The usage of NDK stack is as follows
usage: ndk-stack.py [-h] -sym SYMBOL_DIR [-i INPUT]

Symbolizes Android crashes.

optional arguments:
  -h, --help            show this help message and exit
  -sym SYMBOL_DIR, --sym SYMBOL_DIR
                        directory containing unstripped .so files
  -i INPUT, -dump INPUT, --dump INPUT
                        input filename

ndk-stack -sym $PROJECT_PATH/obj/local/armeabi-v7a -dump tombstone.txt
Tombstone files can be obtained through adb bugreport. Next, let's take a look at the process of getting the tombstone file through the command adb bugreport, and then combined with NDK stack analysis
adb bugreport .
unzip bugreport-OnePlus5T-QKQ1.191014.012-2021-11-28-14-49-22.zip
cd FS/data/tombstones
 You can see multiple tombstone files. Let's take the latest one for analysis

ndk-stack -sym /Users/yangbin/work/avwork/thirdparty/nativecrash/Chapter01/sample/build/intermediates/cmake/debug/obj/arm64-v8a -dump tombstone_09
3.5 IDA Pro
If there is no so with symbol table, you can try to use ida, a so reverse analysis tool, to analyze positioning analysis. For example, we can use ida to open libcrash-lib.so without symbol table, and then query the problem through the wrong address
The specific steps are as follows. First, open libcrash-lib.so with the symbolic table with ida, and then jump to the address 0x5e0
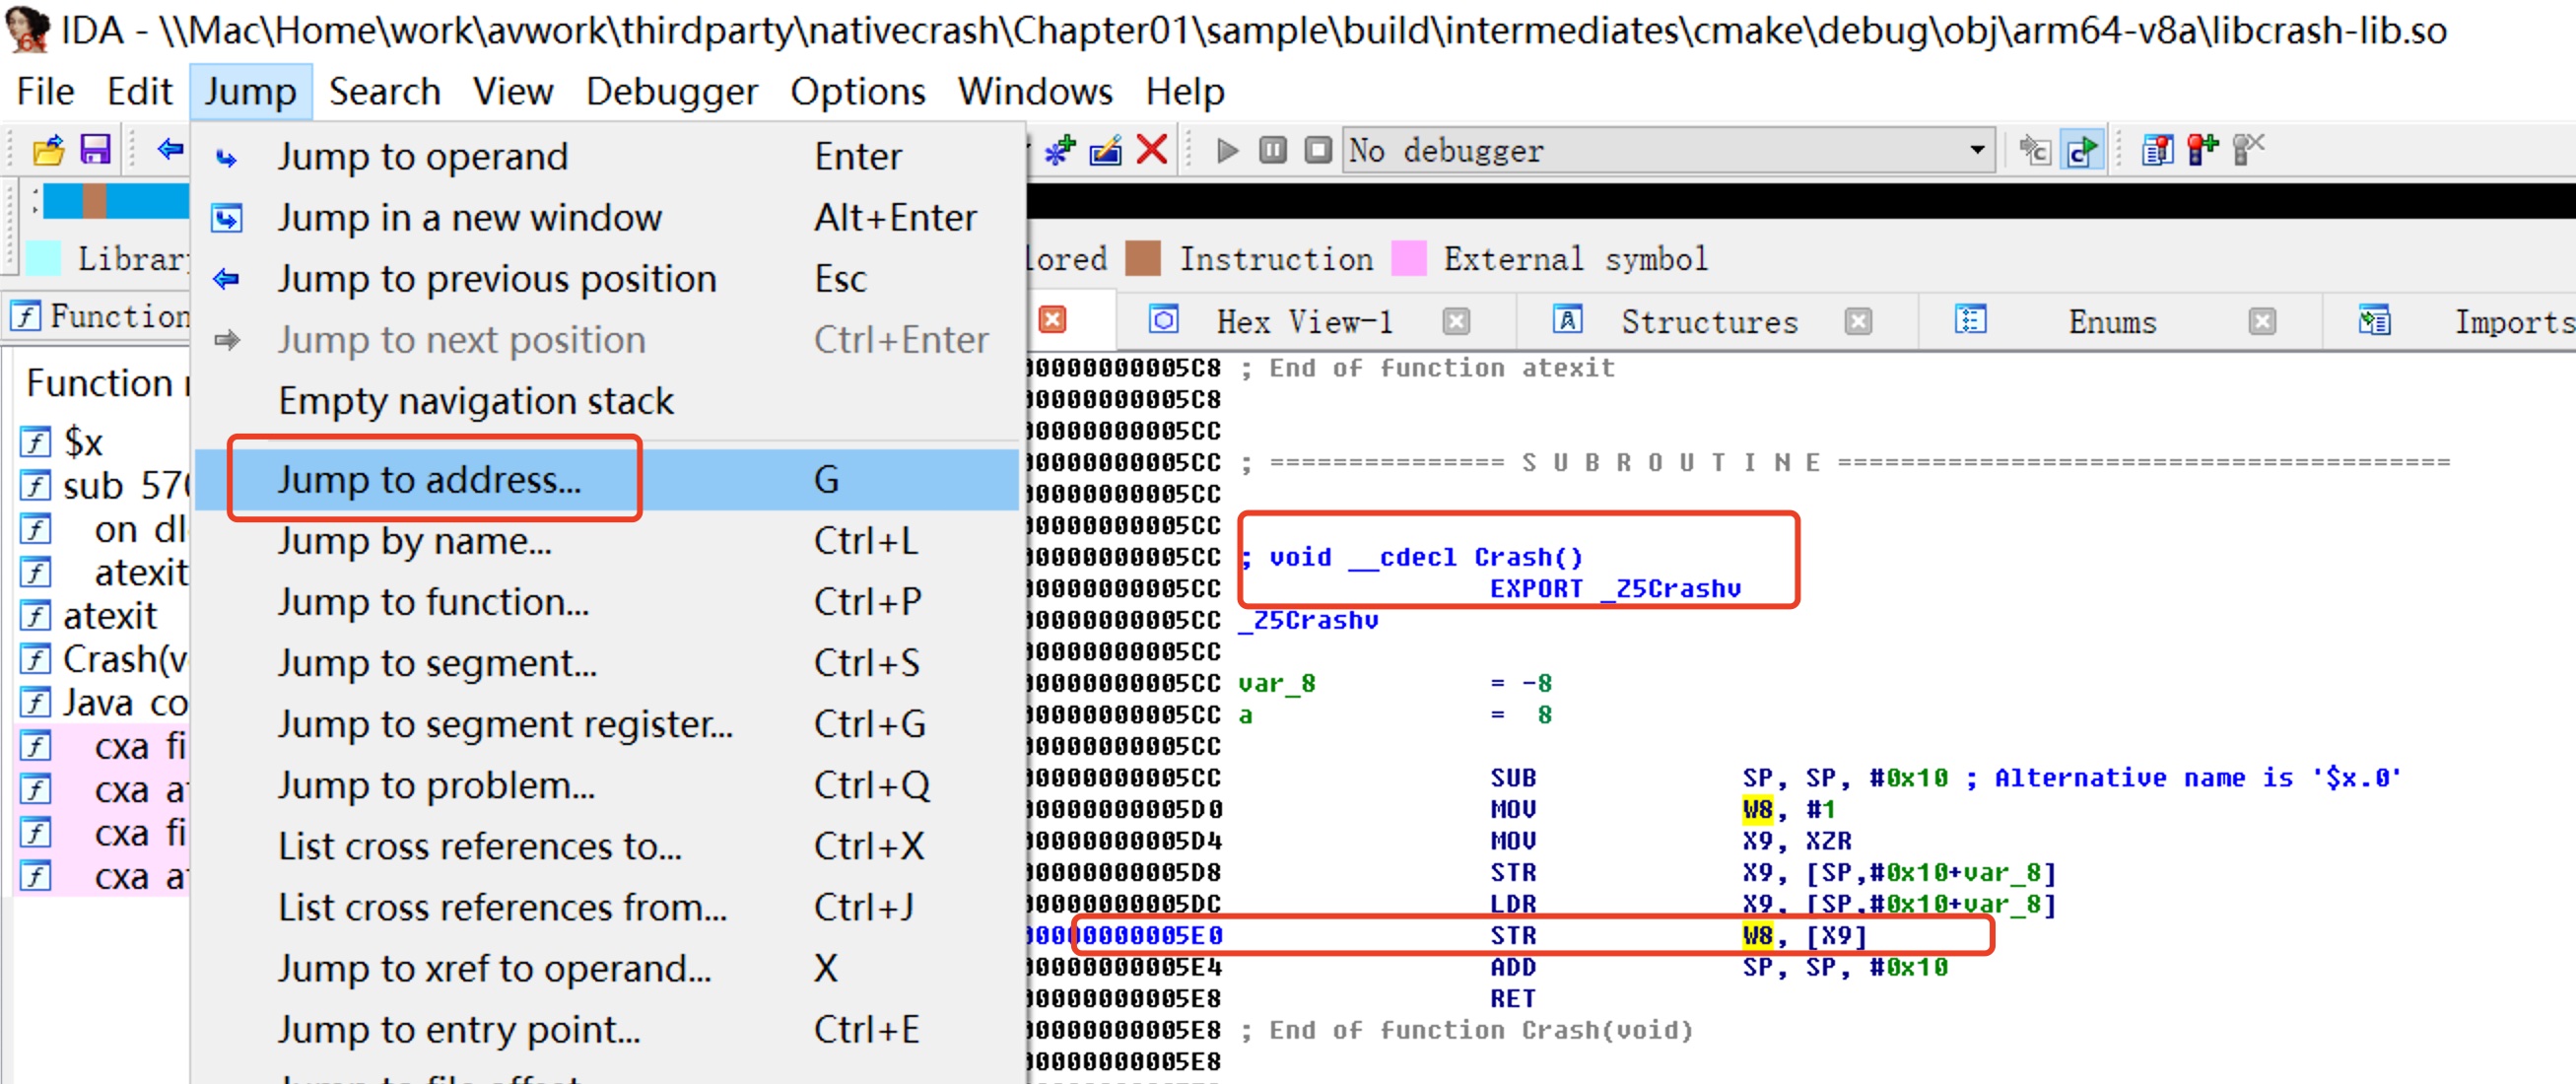
Let's take a look at libcrash-lib.so without a symbol table
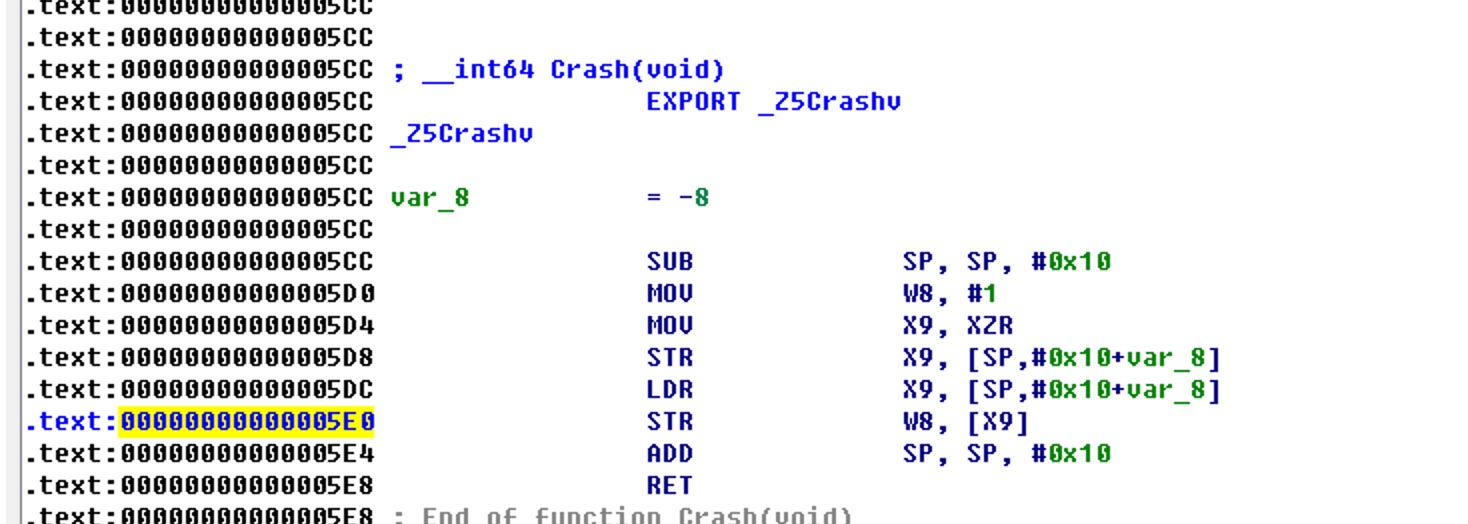
You can see that you can also locate the corresponding classes. However, they are all assembly languages that need to be understood. Similarly, through another tool objdump, you can also find the corresponding assembly information and continue to analyze.
This article is basically here. The article has been broken for two months. In these two months, we are familiar with job changes. The more important reason is that the goal has been achieved and suddenly relaxed. In fact, this is the starting point. Through these two months of work, we are familiar with audio and video. The knowledge and applications involved in audio and video are really extensive, such as encoding and decoding, rendering, transmission, protocol, player, graphics, AI, etc. Come on, boy, let's enter the series of ffmpeg source code analysis at the beginning of the next article. Try to write at least one article a week and study together
4, Information
- Crash optimization (Part 1): about "crash"
- Crash capture mechanism and implementation of Native code on Android platform
- Learn this unique skill and let C + + Crash!
- Android uses Google Breakpad for crash log management
- Native crash log analysis method developed by Android NDK & JNI
- Exception handling - Crash capture mechanism and implementation of Native layer
- Android NDK Tombstone/Crash analysis
- Android Native crash location
- Android NDK tombstone / crash analysis
- How to analyze and locate Android Native Crash
- Dry goods | Android APP crash capture scheme - xCrash Corresponding open source project[ https://github.com/iqiyi/xCrash]
- Crash capture mechanism and implementation of Native code on bugly Android platform
- Blade iron: common Android Native crashes and error causes
5, Harvest
Through the study of this chapter, you are familiar with how to capture and analyze native crashes. The summary is as follows:
- Learn and practice the capture and collection of native crashes through breakpad
- minidump_stackwalk turns the dump file generated by the breakpad into a native crash information file, and then uses add2line and the corresponding so with a symbolic table to parse the crash class and the corresponding number of rows
- Practice the acquisition of tombstone file and natvie crash stack parsing combined with ndk_stack
- The so of unsigned table is analyzed by IDA pro
Thank you for reading
In the next article, we will enter the ffmpeg series again and learn parsing at the source level.