Welcome to pay attention to me, IT industry, focus on Python!

Time series problem is one of the most difficult problems in data science. Traditional processing methods such as ARIMA and SARIMA are very good, but it is difficult to achieve satisfactory prediction results when dealing with nonlinear or non-stationary time series problems.
In order to obtain better prediction results and complete tasks simply and efficiently, in this article, I will share with you seven Python toolkits for dealing with time series problems. I have gained some results, like support, and welcome to collect and learn.
1,tsfresh
tsfresh is a great python package. It can automatically calculate a large number of time series characteristics, including many feature extraction methods and powerful feature selection algorithms.
Let's take the standard data set of airline passengers as an example to understand tsfresh
# Importing libraries
import pandas as pd
from tsfresh import extract_features, extract_relevant_features, select_features
from tsfresh.utilities.dataframe_functions import impute, make_forecasting_frame
from tsfresh.feature_extraction import ComprehensiveFCParameters, settings
# Reading the data
data = pd.read_csv('../input/air-passengers/AirPassengers.csv')
# Some preprocessing for time component:
data.columns = ['month','Passengers']
data['month'] = pd.to_datetime(data['month'],infer_datetime_format=True,format='%y%m')
data.index = data.month
df_air = data.drop(['month'], axis = 1)
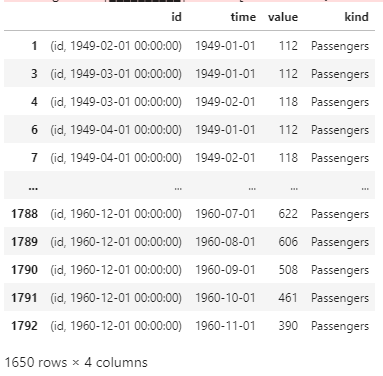
# Use Forecasting frame from tsfresh for rolling forecast training
df_shift, y_air = make_forecasting_frame(df_air["Passengers"], kind="Passengers", max_timeshift=12, rolling_direction=1)
print(df_shift)
The data needs to be formatted as follows:
# Getting Comprehensive Features
extraction_settings = ComprehensiveFCParameters()
X = extract_features(df_shift, column_id="id", column_sort="time", column_value="value", impute_function=impute,show_warnings=False,default_fc_parameters=extraction_settings)
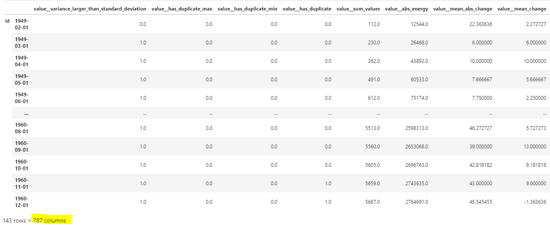
From the above output, we can see that about 800 features have been created. Tsfresh also facilitates feature selection based on p values. For more details, see Github: https://github.com/blue-yonder/tsfresh
Official documents https://tsfresh.readthedocs.io/en/latest/index.html
2,autots

AutoTS is an automatic time series prediction library, which can train multiple time series models with simple code. Some of the best functions of this library include:
- Genetic programming optimization method is used to find the optimal time series prediction model.
- Provide the lower and upper limits of the predicted value of the confidence interval.
- It trains a variety of models, such as statistical, machine learning and deep learning models
- It can also perform automatic integration of the best models
- It can also deal with chaotic data by learning optimal NaN interpolation and outlier removal
- It can run univariate and multivariate time series
Let's take Apple stock dataset as an example to learn more about:
# Loading the package
from autots import AutoTS
import matplotlib.pyplot as plt
import pandas as pd

# Reading the data
df = pd.read_csv('../input/apple-aapl-historical-stock-data/HistoricalQuotes.csv')

# Doing some preprocessing
def remove_dollar(x):
    return x[2:]
df[' Close/Last'] = df[' Close/Last'].apply(remove_dollar)
df[' Close/Last']  = df[' Close/Last'].astype(float)
df['Date'] = pd.to_datetime(df['Date'])

# Plot to see the data:
df = df[["Date", " Close/Last"]]
df["Date"] = pd.to_datetime(df.Date)
temp_df = df.set_index('Date')
temp_df[" Close/Last"].plot(figsize=(12, 8), title="Apple Stock Prices", fontsize=20, label="Close Price")
plt.legend()
plt.grid()
plt.show()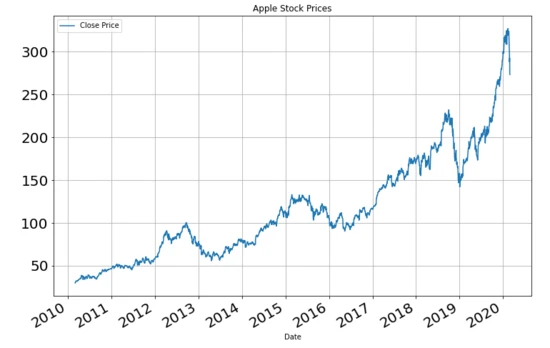
model = AutoTS(forecast_length=40, frequency='infer', ensemble='simple', drop_data_older_than_periods=100)
model = model.fit(df, date_col='Date', value_col=' Close/Last', id_col=None)
This will run hundreds of models. You will see the various models running in the output pane. Let's see how the model predicts:
prediction = model.predict()
forecast = prediction.forecast
print("Stock Price Prediction of Apple")
print(forecast)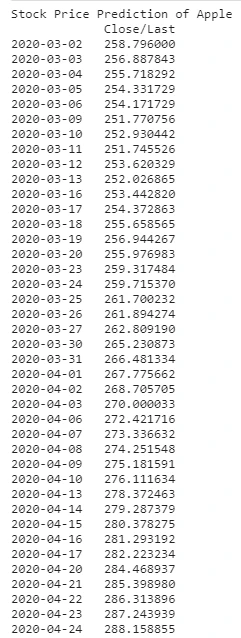
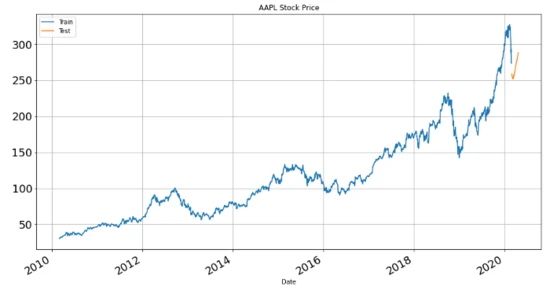
temp_df[' Close/Last'].plot(figsize=(15,8), title= 'AAPL Stock Price', fontsize=18, label='Train')
forecast[' Close/Last'].plot(figsize=(15,8), title= 'AAPL Stock Price', fontsize=18, label='Test')
plt.legend()
plt.grid()
plt.show()
For more details, see Github: https://github.com/winedarksea/AutoTS
Official website documents: https://winedarksea.github.io/AutoTS/build/html/source/tutorial.html
3,Prophet
Prophet is a well-known time series software package developed by Facebook research team. It was first released in 2017 and is applicable to data with strong seasonal impact and historical data of multiple seasons. It is highly user-friendly and customizable with minimal setup.
Let's take a simple example:
# Loading the library
import pandas as pd
import matplotlib.pyplot as plt
from fbprophet import Prophet
# Loading the data from the repo:
df = pd.read_csv("https://raw.githubusercontent.com/facebook/prophet/master/examples/example_wp_log_peyton_manning.csv")
# Fitting the model
model = Prophet()
model.fit(df) #fit the model.
# Predict
future = model.make_future_dataframe(periods=730) # predicting for ~ 2 years
forecast = model.predict(future) # Predict future
# Plot results
fig1 = model.plot(forecast) # Plot the fit to past data and future forcast.
fig2 = model.plot_components(forecast) # Plot breakdown of components.
plt.show()
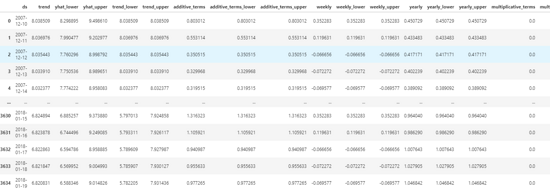
forecast # Displaying various results in table format.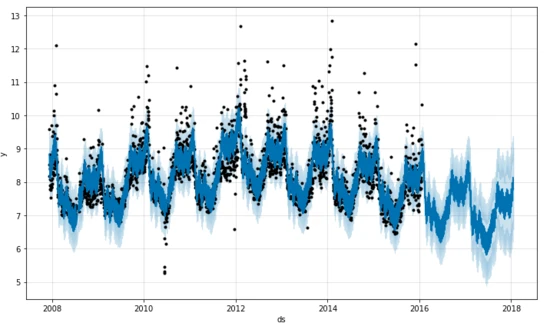
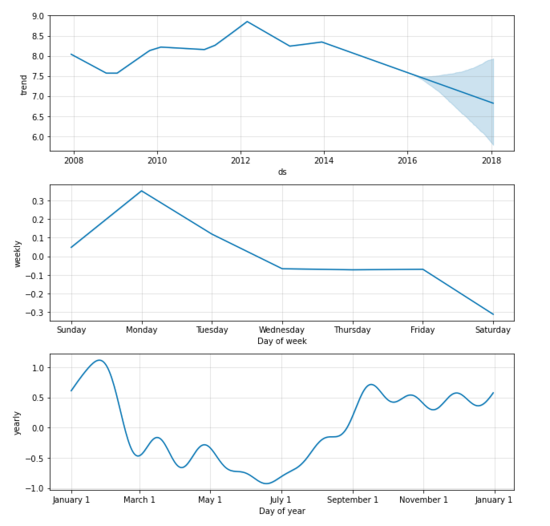
The trend chart and seasonal chart are as follows:
We can also see the prediction and all the confidence intervals
For more details, see Github: https://github.com/facebook/prophet
file: https://facebook.github.io/prophet/
4,darts:
Darts is another Python package that facilitates the operation and prediction of time series. The syntax is "sklearn friendly" and uses the fit and predict functions to achieve the goal. In addition, it also includes various models from ARIMA to neural network.

The best part of the package is that it supports not only univariate, but also multivariable time series and models. The library can also conveniently carry out backtracking test on models, and combine the prediction and external regression of multiple models. Let's take a simple example to understand its working principle:
#Loading the package
from darts import TimeSeries
from darts.models import ExponentialSmoothing
import matplotlib.pyplot as plt

# Reading the data
data = pd.read_csv('../input/air-passengers/AirPassengers.csv')
series = TimeSeries.from_dataframe(data, 'Month', '#Passengers')
print(series) 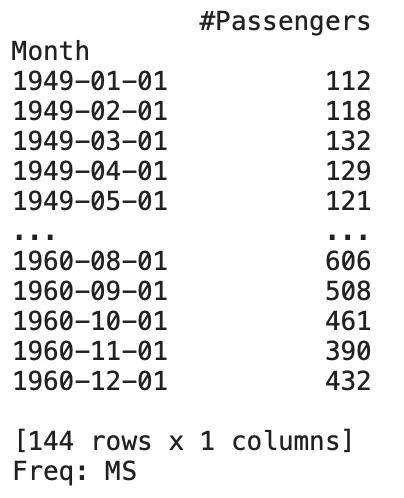
# Splitting the series in train and validation set
train, val = series.split_before(pd.Timestamp('19580101'))

# Applying a simple Exponential Smoothing model
model = ExponentialSmoothing()
model.fit(train)

# Getting and plotting the predictions
prediction = model.predict(len(val))series.plot(label='actual')
prediction.plot(label='forecast', lw=3)
plt.legend() 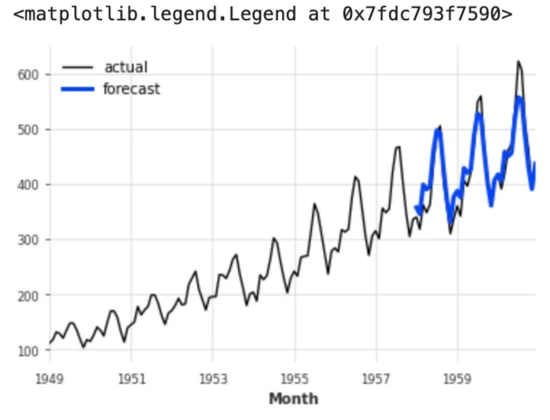
For more details, see Github: https://github.com/unit8co/darts
file: https://unit8co.github.io/darts/README.html
5,AtsPy
AtsPy represents the automatic time series model in Python. The goal of the library is to predict univariate time series. You can load data and specify the model to run, as shown in the following example:
# Importing packages
import pandas as pd
from atspy import AutomatedModel
# Reading the data:
data = pd.read_csv('../input/air-passengers/AirPassengers.csv')
# Preprocessing data
data.columns = ['month','Passengers']
data['month'] = pd.to_datetime(data['month'],infer_datetime_format=True,format='%y%m')
data.index = data.month
df_air = data.drop(['month'], axis = 1)
# Select the models you want to run:
models = ['ARIMA','Prophet']
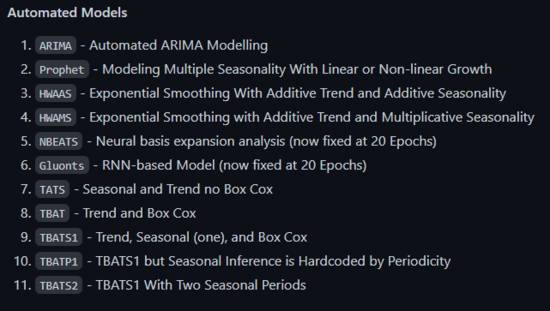
run_models = AutomatedModel(df = df_air, model_list=models, forecast_len=10)The package provides a set of different models that are fully automated. The following is a screenshot of the available models:
Github: https://github.com/firmai/atspy
6,kats:
Kats is another library recently developed by the Facebook research team to deal with time series data. The goal of the framework is to provide a complete solution to the time series problem. Using this library, we can do the following:
- Time series analysis
- Pattern detection, including seasonality, outliers and trend changes
- Feature engineering module generating 65 features
- Establish prediction models for time series data, including Prophet, ARIMA, Holt Winters, etc.
It has just released its first version. Some tutorials can be found here
https://github.com/facebookresearch/Kats/tree/master/tutorials
7,sktime:
Sktime library is a unified python library, which is suitable for time series data and compatible with scikit learn. It has time series prediction, regression and classification models. The main goal of development is to interoperate with scikit learn.
Take a prediction example to introduce the use of sktime
from sktime.datasets import load_airline
from sktime.forecasting.base import ForecastingHorizon
from sktime.forecasting.model_selection import temporal_train_test_split
from sktime.forecasting.theta import ThetaForecaster
from sktime.performance_metrics.forecasting import mean_absolute_percentage_error

y = load_airline()
y_train, y_test = temporal_train_test_split(y)
fh = ForecastingHorizon(y_test.index, is_relative=False)
forecaster = ThetaForecaster(sp=12)  # monthly seasonal periodicity
forecaster.fit(y_train)
y_pred = forecaster.predict(fh)
mean_absolute_percentage_error(y_test, y_pred)
>>> 0.08661467738190656
Technical exchange
Welcome to reprint, collect, gain, praise and support!