Node side rendering F2
Although F2 is used for charting based on Html5 Canvas by default, for the current runtime environment, F2 can also be used for charting as long as it can provide the same context interface as the Html5 Canvas context environment.
The following table shows the functional comparison of F2 available in each operating environment:
| -- | Html5 | Node | Applet (wechat & & applet) |
| Chart drawing | ✔︎ | ✔︎ | ✔︎ |
| Legend component | ✔︎ | ✔︎ | ✔︎ |
| Tooltip component | ✔︎ | ✔︎ | |
| Events (interaction of events on Tooltip and Legend) | ✔︎ | ✔︎ | |
| animation | ✔︎ | ✔︎ |
Node side rendering description
Running F2 on the background service of node can provide powerful server-side ability to render visual charts, which can be applied to generate offline reports, graphic pdf and other scenes.
At present, F2 can provide complete chart drawing ability in the node environment, but it cannot provide event, interaction and animation functions (so please delete the code related to chart.tooltip() and. Animation() when testing the demo on the official website). The specific application methods are as follows:
- First install the module, node-canvas
This module provides the ability to realize canvas rendering in node. Combined with this module, F2 chart rendering on node can be realized
npm install canvas
- When importing F2, it should be noted that the node does not support animation, events and tooltips, so please select F2 when importing F2 On demand import To avoid the introduction of the above modules, it can also make the code volume of F2 smaller. In order to make it easier to use, it is recommended to package the following code into a general module.
const F2 = require('@antv/f2/lib/core'); // Introducing core packages

require('@antv/f2/lib/geom/'); // Geometric marker object
require('@antv/f2/lib/geom/adjust/'); // Data adjustment

require('@antv/f2/lib/coord/polar'); // Polar coordinate system
require('@antv/f2/lib/component/axis/circle'); // Arc length axis in polar coordinate system

require('@antv/f2/lib/scale/time-cat'); // Metrics of type timeCat

require('@antv/f2/lib/component/guide'); // Load guide component
const Guide =  require('@antv/f2/lib/plugin/guide'); // Guide plug-in
const Legend =  require('@antv/f2/lib/plugin/legend'); // Legend plug-in
F2.Chart.plugins.register([ Legend, Guide ]); // Register the above plug-ins- Create a canvas object
const Canvas = require('canvas');
const canvas = Canvas.createCanvas(400, 267);- When F2 is used to draw a Chart, it should be noted that the attributes passed in when creating the Chart object. The width and height attributes must be set in the following two ways
// The first way is to pass in canvas directly
const chart = new F2.Chart({
  el: canvas, // Pass in the canvas object created in step 3
  width: 400, // Required. The chart width is the same as that of canvas
  height: 267 // Required. The height of the chart is the same as that of the canvas
});

// The second way is to pass in the context
const chart = new F2.Chart({
  context: canvas.getContext('2d'), // Pass in the context of the canvas object created in step 3
  width: 400, // Required. The chart width is the same as that of canvas
  height: 267 // Required. The height of the chart is the same as that of the canvas
});
The following is the complete code for F2 to draw a pie chart on the node side:
const fs = require('fs');
const path = require('path');
const Canvas = require('canvas'); // Introducing node canvas
// Introducing F2: start
const F2 = require('@antv/f2/lib/core'); // Introducing core packages
require('@antv/f2/lib/geom/'); // Geometric marker object
require('@antv/f2/lib/geom/adjust/'); // Data adjustment
require('@antv/f2/lib/coord/polar'); // Polar coordinate system
require('@antv/f2/lib/component/axis/circle'); // Arc length axis in polar coordinate system
require('@antv/f2/lib/scale/time-cat'); // Metrics of type timeCat
require('@antv/f2/lib/component/guide'); // Load guide component
const Guide = require('@antv/f2/lib/plugin/guide'); // Guide plug-in
const Legend = require('@antv/f2/lib/plugin/legend'); // Legend plug-in
F2.Chart.plugins.register([ Legend, Guide ]); // Register the above plug-ins
// Import F2: end
const canvas = Canvas.createCanvas(375, 260); // Create canvas object
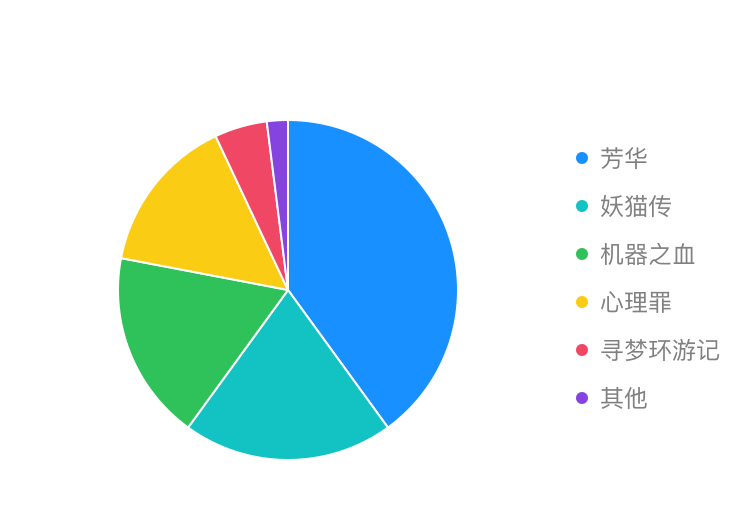
// Use F2 to draw a pie chart
function drawPie() {
const data = [
{ name: 'youth', percent: 0.4, a: '1' },
{ name: 'Demon cat biography', percent: 0.2, a: '1' },
{ name: 'Machine blood', percent: 0.18, a: '1' },
{ name: 'Psychological crime', percent: 0.15, a: '1' },
{ name: 'Dream seeking travel notes', percent: 0.05, a: '1' },
{ name: 'other', percent: 0.02, a: '1' }
];
const chart = new F2.Chart({
el: canvas,
width: 375,
height: 260,
padding: [ 45, 'auto', 'auto' ]
});
chart.source(data, {
percent: {
formatter(val) {
return val * 100 + '%';
}
}
});
chart.legend({
position: 'right'
});
chart.coord('polar', {
transposed: true,
radius: 0.85
});
chart.axis(false);
chart.interval()
.position('a*percent')
.color('name', [ '#1890FF', '#13C2C2', '#2FC25B', '#FACC14', '#F04864', '#8543E0' ])
.adjust('stack')
.style({
lineWidth: 1,
stroke: '#fff',
lineJoin: 'round',
lineCap: 'round'
});
chart.render();
}
drawPie();
canvas.createPNGStream().pipe(fs.createWriteStream(path.join(__dirname, 'pie.png'))) // Export picture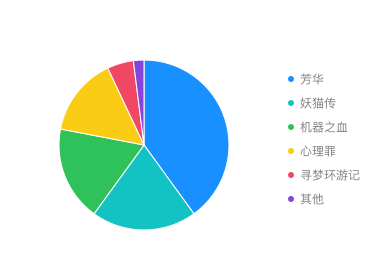
Different equipment resolution adaptation schemes
The adaptation scheme is very simple. Assuming that the pixel ratio of the current device is 2, when creating the F2 chart, set the pixelRatio attribute:
const chart = new F2.Chart({
  el: canvas,
  width: 375,
  height: 260,
  padding: [ 45, 'auto', 'auto' ],
  pixelRatio: 2
});
Here, we set the canvas width and height to 375 * 260. After setting pixelRatio: 2, the width and height of the generated chart will be enlarged twice, and the size will be 750 520. At this time, when displaying the picture, set the actual display size of the picture to 375 * 260 to ensure the clear display of the picture, as shown in the following figure:
- Screen resolution: 2
- Actual picture size: 750 * 520
- Picture style (display size): style="width: 375px;height: 260px;"