Today, I'll teach you how to use python to make the dynamic map of Beijing, Shanghai, Guangzhou and Shenzhen - subway line, which may be the most complete and detailed tutorial in the whole network.
Collection of coordinate points
Xiaowu has done similar geographic visualization before, but they all use json data collected on the network. But a lot of data is outdated, even wrong / incomplete. So we'd better do it ourselves and have plenty of food and clothing. Open the subway page of Gaode map, map.amap.com/subway/inde...
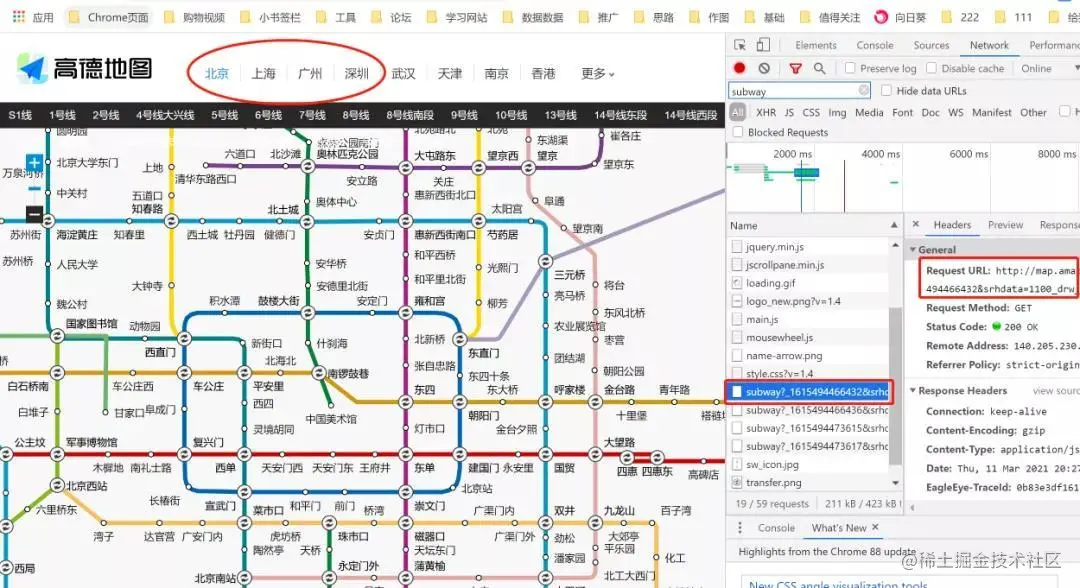
You can easily get the interface of Beijing subway data. Similarly, you can copy the URLs of the other three cities. With the api, you can parse json to get the data 👇
url = 'http://map.amap.com/service/subway?_1615466846985&srhdata=1100_drw_beijing.json'
response = requests.get(url)
result = json.loads(response.text)
stations = []
for i in result['l']:
    station = []
    for a in i['st']:
        station.append([float(b) for b in a['sl'].split(',')])
    stations.append(station)
pprint.pprint(stations)
pprint formats the print results for easy preview
Transformation of coordinate system
In fact, I've seen similar geographic visualization articles before. As a result, I found that it's OK to zoom in. When I zoom in, I'll find that the coordinate points float out of the ground for two miles 😂 Just take the coordinate points obtained above to show you the geographical location of the same latitude and longitude in different maps 👇
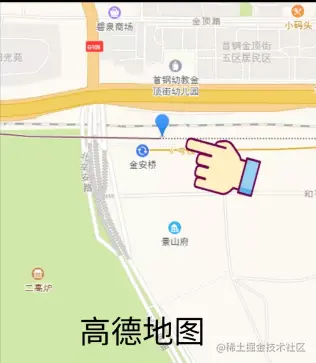
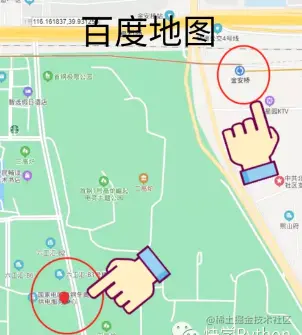
👆 You can see that the latitude and longitude in Gaode map refers to Jin'anqiao subway station, but in Baidu map, the geographical location points to a building a few kilometers away. Why is this problem? In fact, it is caused by the geographical coordinate system of different map products.
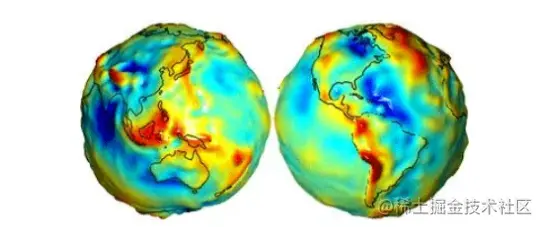
Let's talk about the common geographical coordinate system: the earth coordinate system is an international general coordinate system, which is more suitable for international map visualization. However, in China, it is generally not used directly, but the Mars coordinate system encrypted by the National Bureau of Surveying and mapping on its basis. In addition, some companies will conduct secondary encryption on the Mars coordinate system, such as Baidu coordinate system, Sogou coordinate system, etc. I found a picture on the Internet:
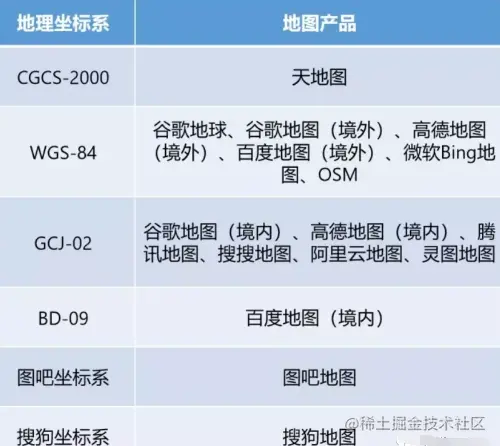
The above figure can be used as a reference. We won't study the specific reasons in detail. What is the key point and how to use python to transform the coordinate system? For example, in this paper, we use the GCJ-02 coordinate system to obtain the coordinate point set in Gaode map. The following visualization will call the interface of Baidu map, that is, it needs to be visualized in BD-09 coordinate system. Fortunately, I found the formula from GCJ-02 to BD-09 on the Internet and implemented it in python:
#Set the two constants you need first
pi = 3.1415926535897932384 #π
r_pi = pi * 3000.0/180.0

def gcj02_bd09(lon_gcj02,lat_gcj02):
    b = math.sqrt(lon_gcj02 * lon_gcj02 + lat_gcj02 * lat_gcj02) + 0.00002 * math.sin(lat_gcj02 * r_pi)
    o = math.atan2(lat_gcj02 , lon_gcj02) + 0.000003 * math.cos(lon_gcj02 * r_pi)
    lon_bd09 = b * math.cos(o) + 0.0065
    lat_bd09 = b * math.sin(o) + 0.006
    return [lon_bd09,lat_bd09]
In this way, we have written a python function to convert GCJ-02 coordinate system into BD-09. By calling this function, we can convert all the coordinate point sets obtained by Gaode map into Baidu coordinate system.
result = []
for station in stations:
    result.append([gcj02_bd09(*point) for point in station])
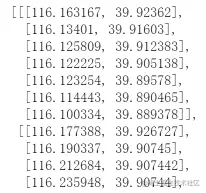
Take one of the coordinate points as an example:
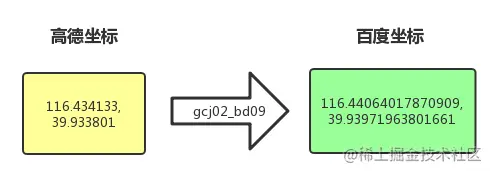
So far, our preliminary data work is finally ready. Of course, if the data we get at the beginning is BD_ 09 (Baidu map) coordinate system, this step can be directly omitted~
Geographic visualization
Next, we will use BMap in pyecharts to visualize, but we need to obtain the key of Baidu open platform first. Baidu map open platform 👉 lbsyun.baidu.com/apiconsole/...
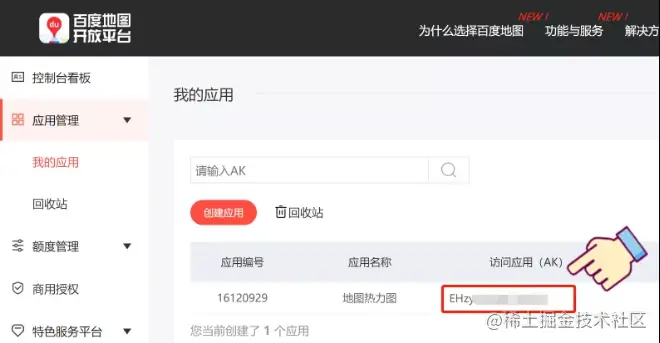
copy 👆 Save the access application (AK) in the figure above, which will be used in subsequent visualization. We use BMap in pyecarts to import the module first
from pyecharts.charts import BMap
from pyecharts import options as opts
from pyecharts.globals import BMapType, ChartType
After importing the data (that is, the longitude and latitude data result converted above), you can adjust the parameters and add some controls. 👇 Key parameters are annotated for easy viewing (Baidu appkey remembers to replace it with its own)
map_b = (
    BMap(init_opts = opts.InitOpts(width = "800px", height = "600px"))
    .add_schema(
        baidu_ak = '****************', #Baidu map development application appkey
        center = [116.403963, 39.915119], #Center point of current view
        zoom = 10, #Scale of the current viewing angle
        is_roam = True, #Turn on mouse zoom and pan walk
    )
    .add(
        series_name = "",
        type_ = ChartType.LINES, #Set Geo chart type
        data_pair = result, #data item
        is_polyline = True, #Is it a polyline, drawing lines Figure case#
        linestyle_opts = opts.LineStyleOpts(color = "blue", opacity = 0.5, width = 1), # Line style configuration item
    )
    .add_control_panel(
        maptype_control_opts = opts.BMapTypeControlOpts(type_ = BMapType.MAPTYPE_CONTROL_DROPDOWN), #Switch map type controls
        scale_control_opts = opts.BMapScaleControlOpts(), #Scale bar control
        overview_map_opts = opts.BMapOverviewMapControlOpts(is_open = True), #Add thumbnail map
        navigation_control_opts = opts.BMapNavigationControlOpts() #Pan zoom controls for maps
    )
)

map_b.render(path = 'subway_beijing.html')
Note: because it is a map of Beijing, the longitude and latitude of Tiananmen Square [116.403963, 39.915119] is set as the viewing angle center.
Let's take a look at the visualization results:

👆 The four corners in the figure above have controls, which are the control parameters we added to the code. They are: pan and zoom control of map, control of switching map type, thumbnail map and scale bar control. Is it still broad

Other effect display
The above has basically realized the production of subway line dynamic map with python. However, if we all use the same color background to make dynamic pictures, it will be too monotonous. It happens that we have to draw the subway map of the other three cities. Then adjust some parameters to see what effect can be obtained?
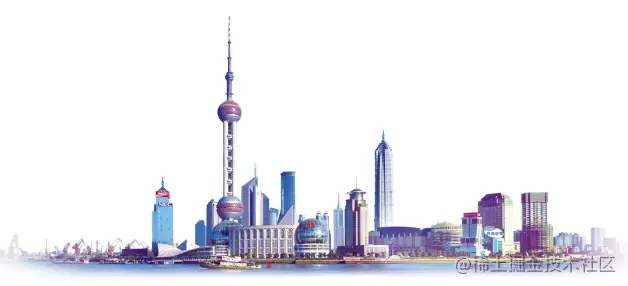
Shanghai - Discoloration
The data interfaces in Shanghai are:
http://map.amap.com/service/subway?_1615467204533&srhdata=3100_drw_shanghai.json
For the subway map of Shanghai, we can change the color of line in the parameter linestyle_ Modify color in opts. 👇 The line color in the figure below is lilac - light purple

Guangzhou - satellite map

The data interface of Guangzhou is:
http://map.amap.com/service/subway?_1615494419554&srhdata=4401_drw_guangzhou.json
In fact, we can also adjust the visual background to satellite images. However, there is no need to write additional code for this operation, because as mentioned above, I added four controls when adjusting parameters, of which the one in the upper right corner can directly switch the map type. See the following figure for specific operations.
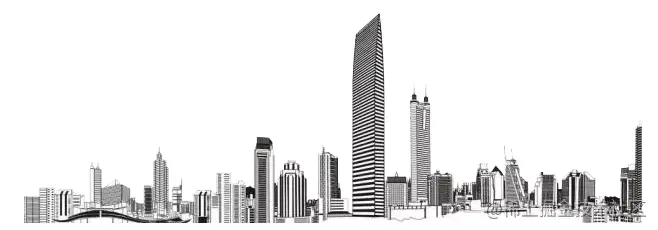
Shenzhen - personalized color matching
The data interface of Shenzhen is:
http://map.amap.com/service/subway?_1615494473615&srhdata=4403_drw_shenzhen.json
If we are not satisfied with the map background set by Baidu map, we can also personalize mapStyle and adjust our color matching stylejason.
Summary
Today, I took you to learn how to use python to draw the dynamic map of subway lines in first tier cities. It is mainly divided into four parts: the collection of coordinate points, the transformation of coordinate system, the use of pyechards geographic visualization and other effect display.