1, Picture conversion
(1) Original drawing
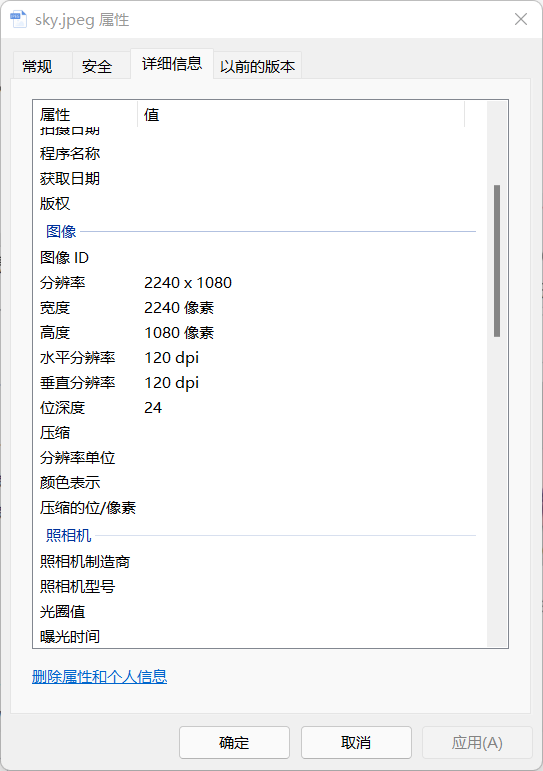
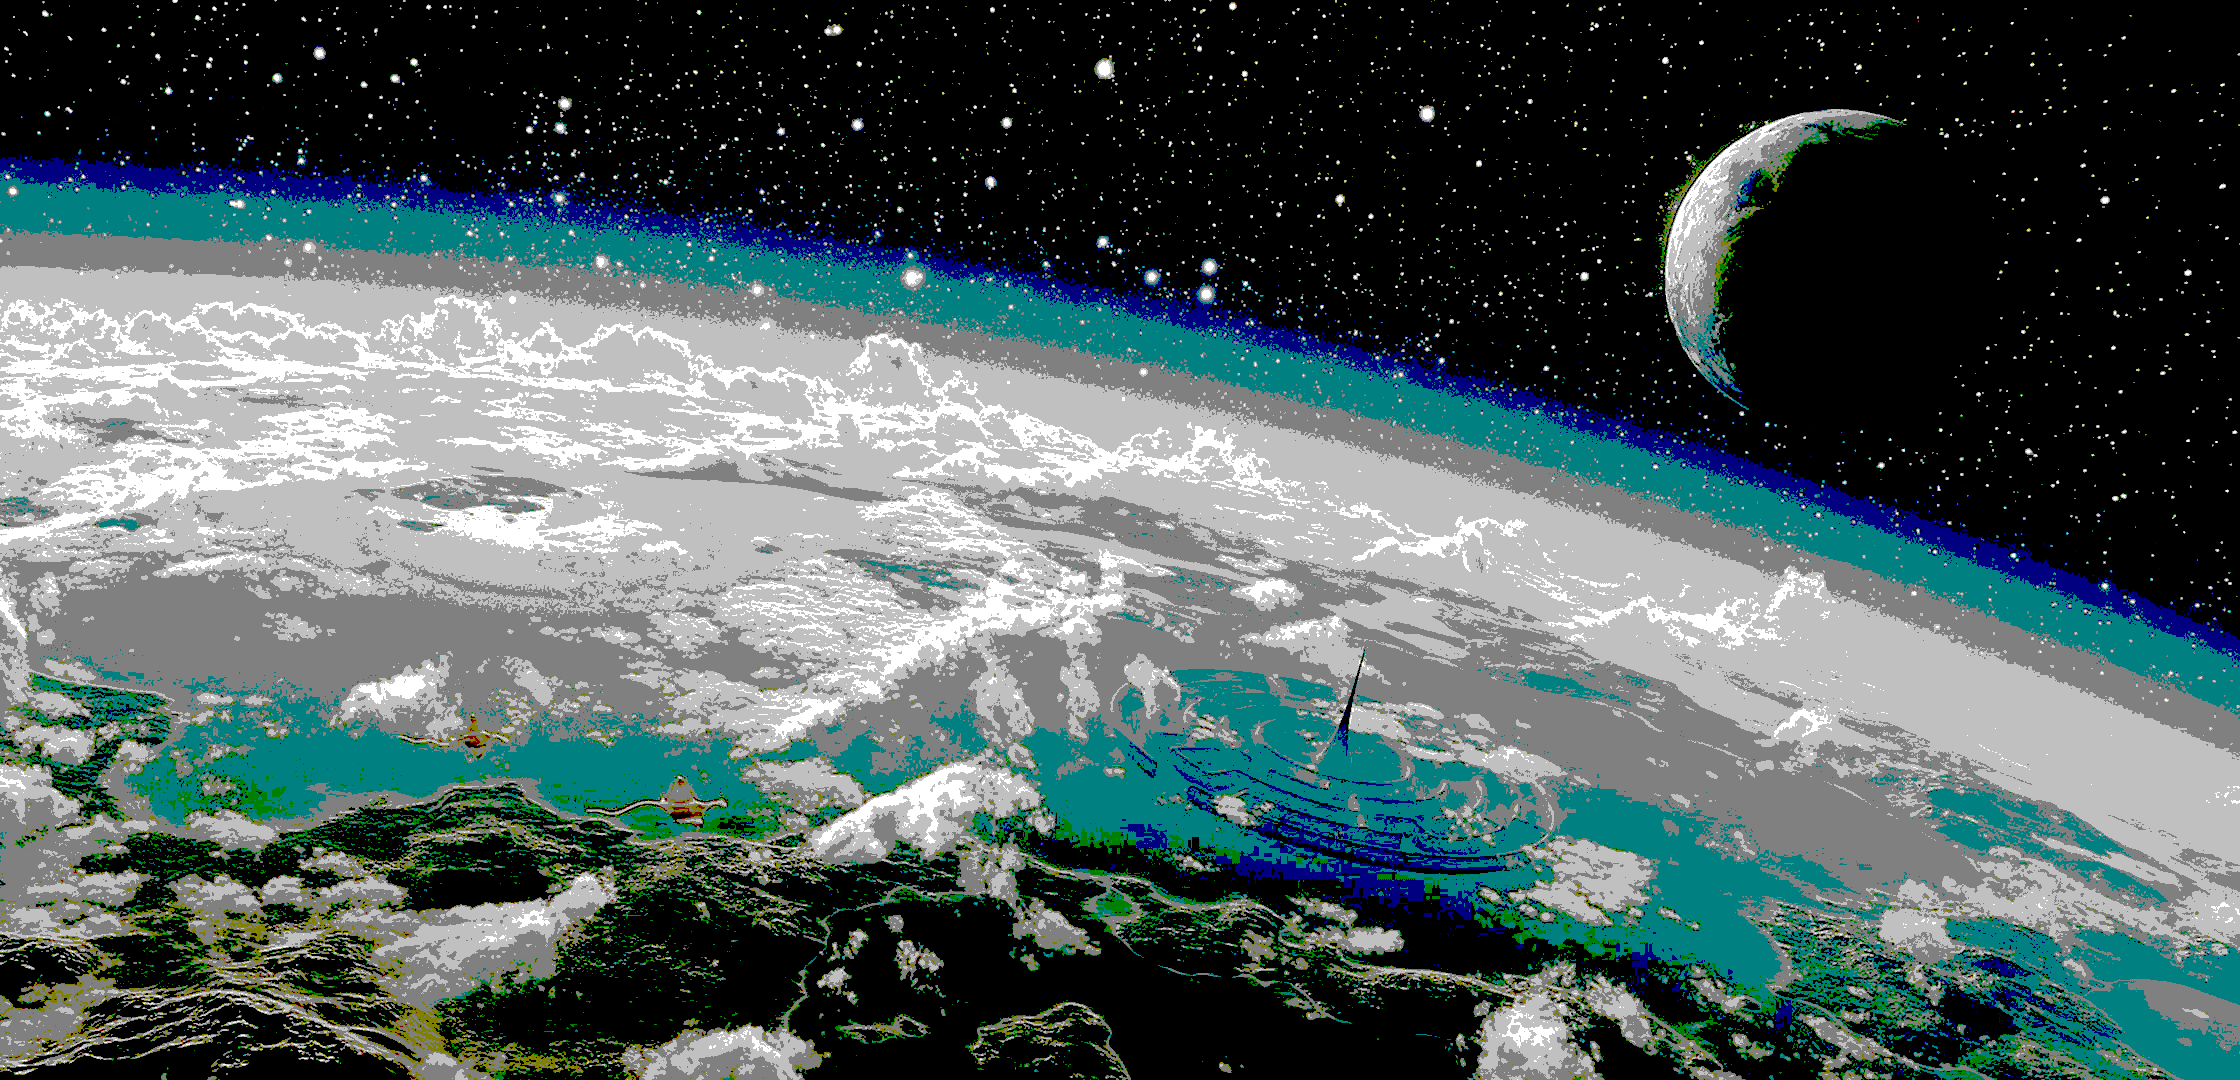
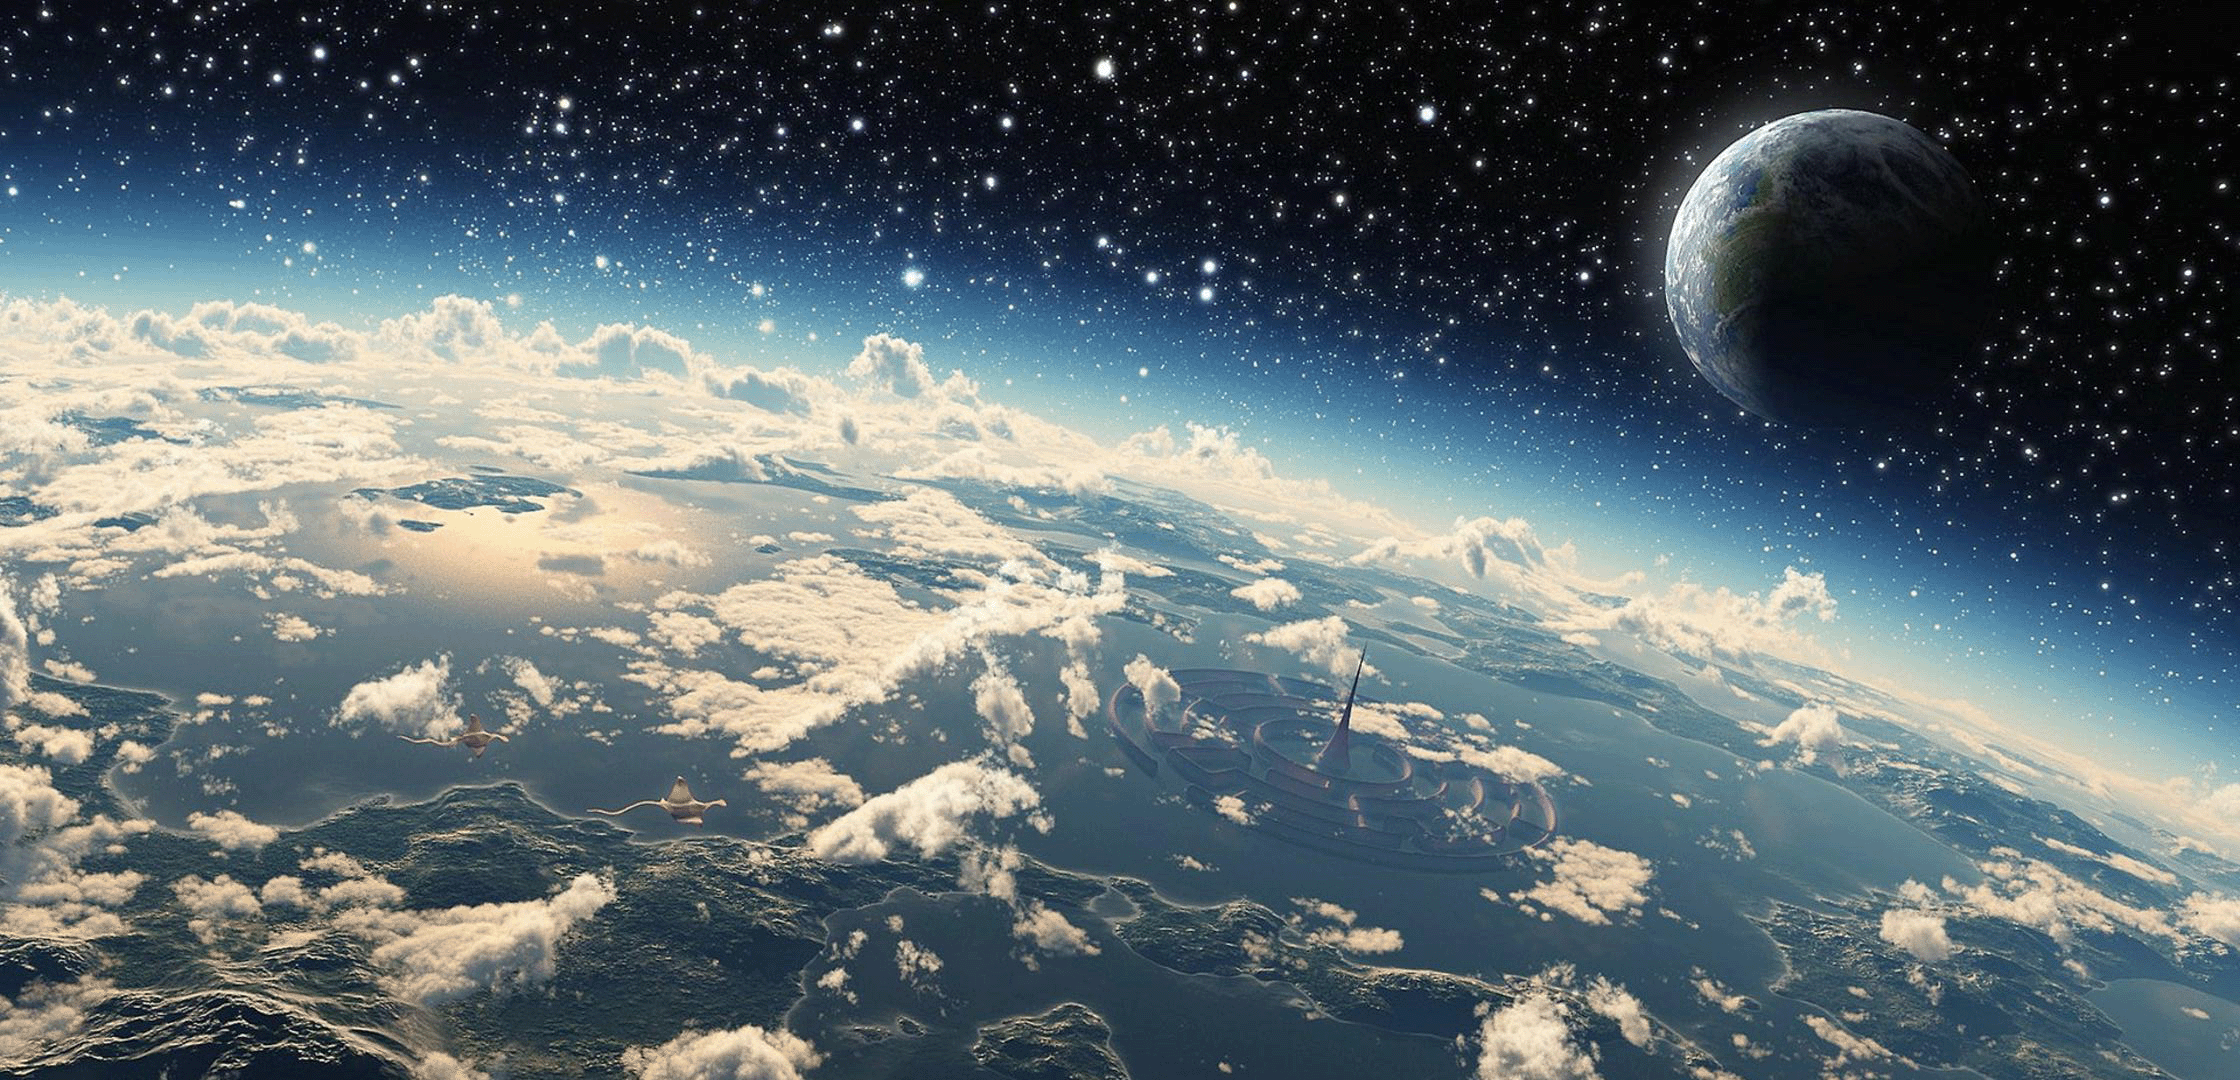
1. Original sky jpeg(2240*1080)
 2. Original drawing information
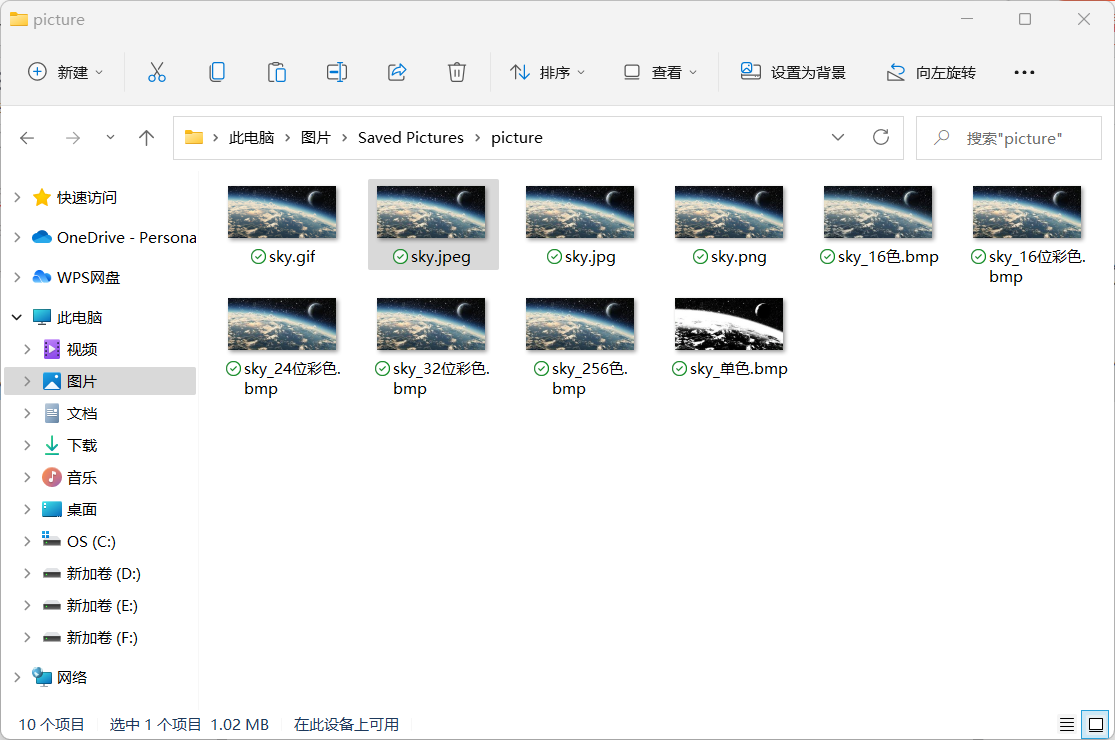
(2) Convert to bitmap
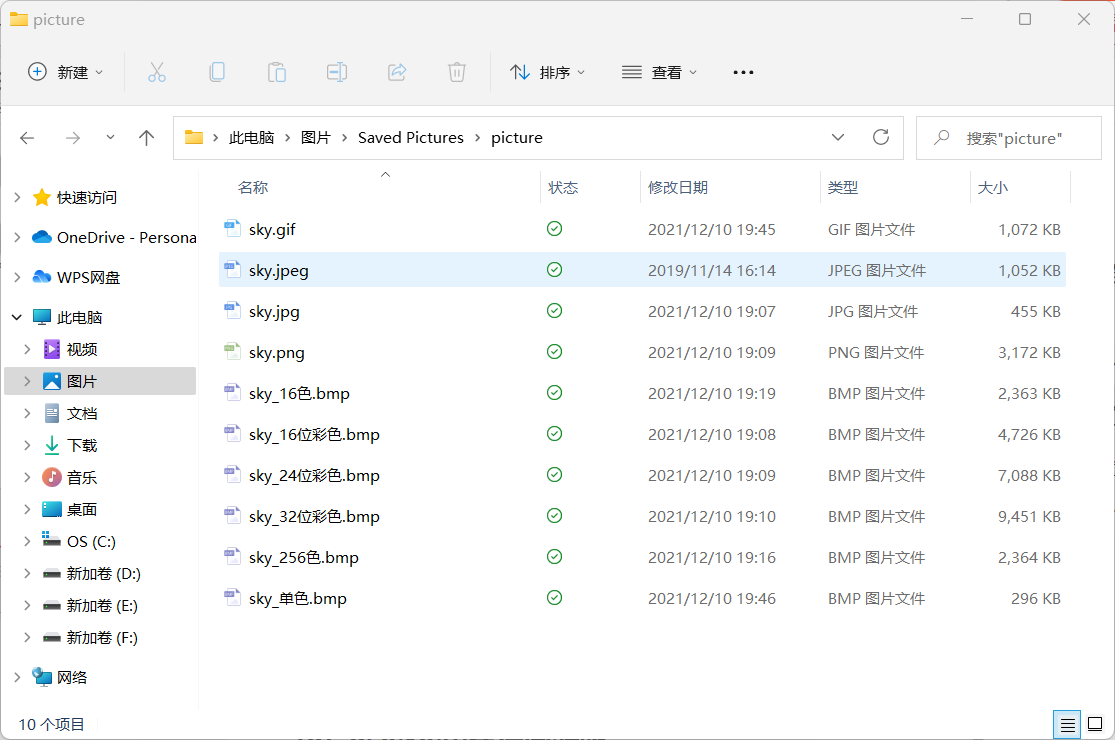
1. Use Photoshop and the drawing tool provided by the computer or IrfanView to change the color format and bit depth of the picture, and convert the original picture into the following pictures, including 32-bit, 24 bit, 16 bit color and 256 color, 16 color and monochrome bitmap (BMP) files, png, gif, jpg, bmp (all above):
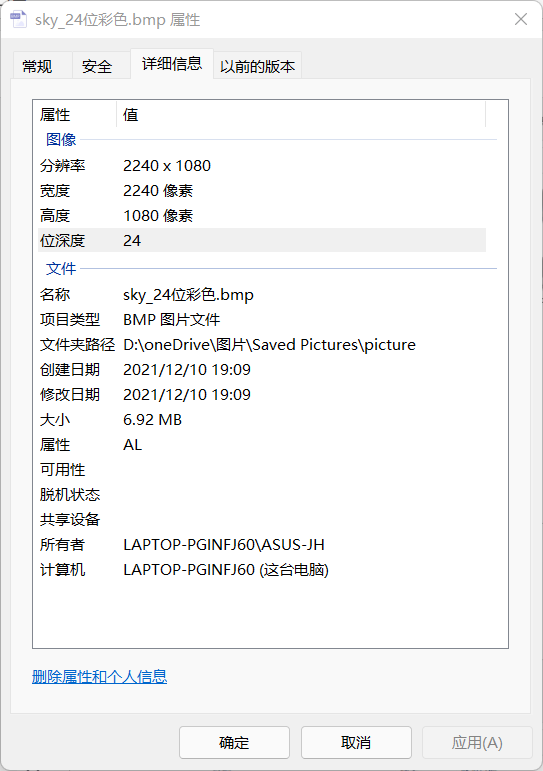
2. Bitmap calculation method (take sky_24 bit color as an example): 2240108024/8/1024=7087.5KB/1024 ≈ 6.92MB. Other bitmaps can also be calculated in this way. Width height bit depth / 8 bits per byte / 1024 = how many KB
3. Taking sky_24 bit color as an example, UltraEdit views the picture header file information as follows
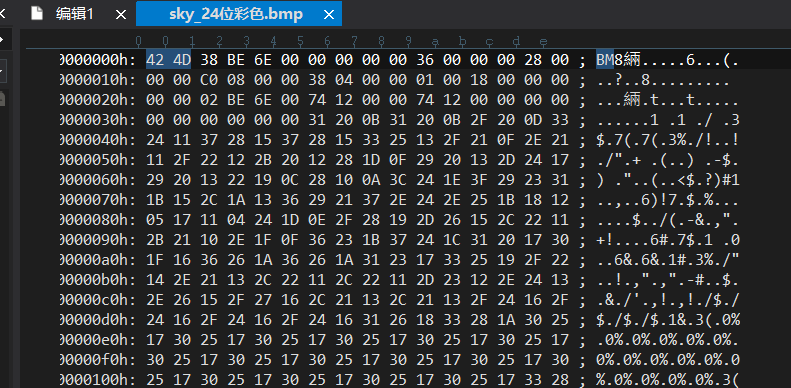
4. The bitmap file header is divided into four parts, with a total of 14 bytes:
bfType	2 byte	Logo, that is“ BM"Two words	BM

bfSize	4 byte	whole BMP File size	0x000C0036(786486)[It is the same as the size value in the image attribute by right clicking]

bfReserved1/2	4 byte	Reserved words, useless	0

bfOffBits	4 byte	Offset number, i.e. bit map file header+Bitmap header+The size of the palette	0x36(54)
5. Both color format and picture file format affect picture size:
(3) Compression ratio
1. The original image is sky.jpeg with a size of 1052KB, gif with a size of 1072KB, jpg with a size of 455KB, png with a size of 3172KB, and bmp (taking sky_24 bit color as an example) with a size of 7088KB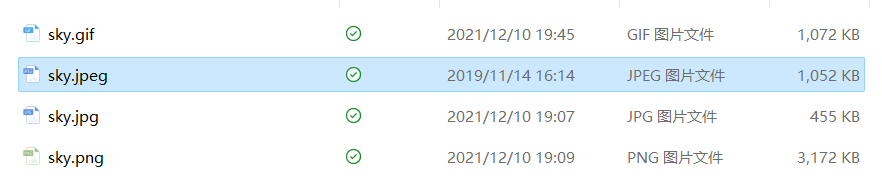
Compare size:
PNG compression ratio: - 301.5%
BMP compression ratio: - 673.8%
JPG compression ratio: 43.3%
GIF compression ratio: 101.9%
2, Distinguish bitmap
(1) 16 / 32 bit bitmap comparison
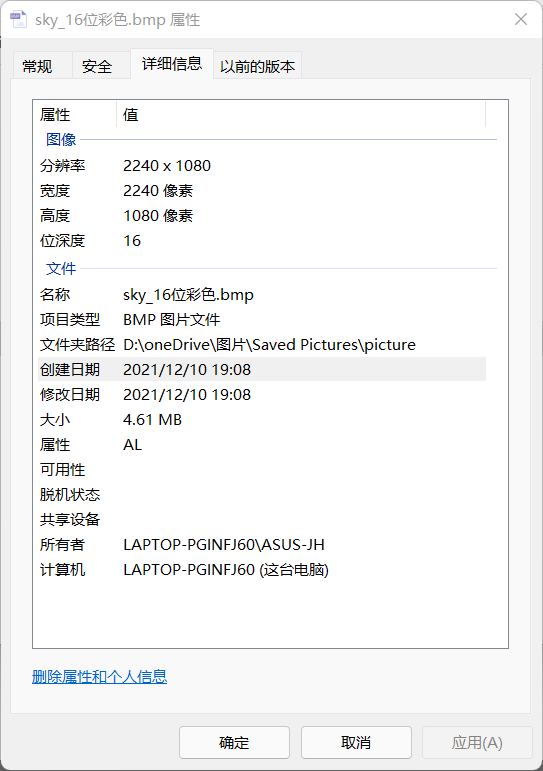
1.16 bit bitmap information
2.32 bit bitmap information

3. It can be seen from the above figure that 4.61MB*2=9.22MB
16 bit bitmaps occupy less storage space than 32-bit bitmaps, nearly half of 32-bit bitmaps. 32-bit bitmaps are compressed by half and become 16 bit bitmaps
(2) 256 / 16 / monochrome bitmap comparison
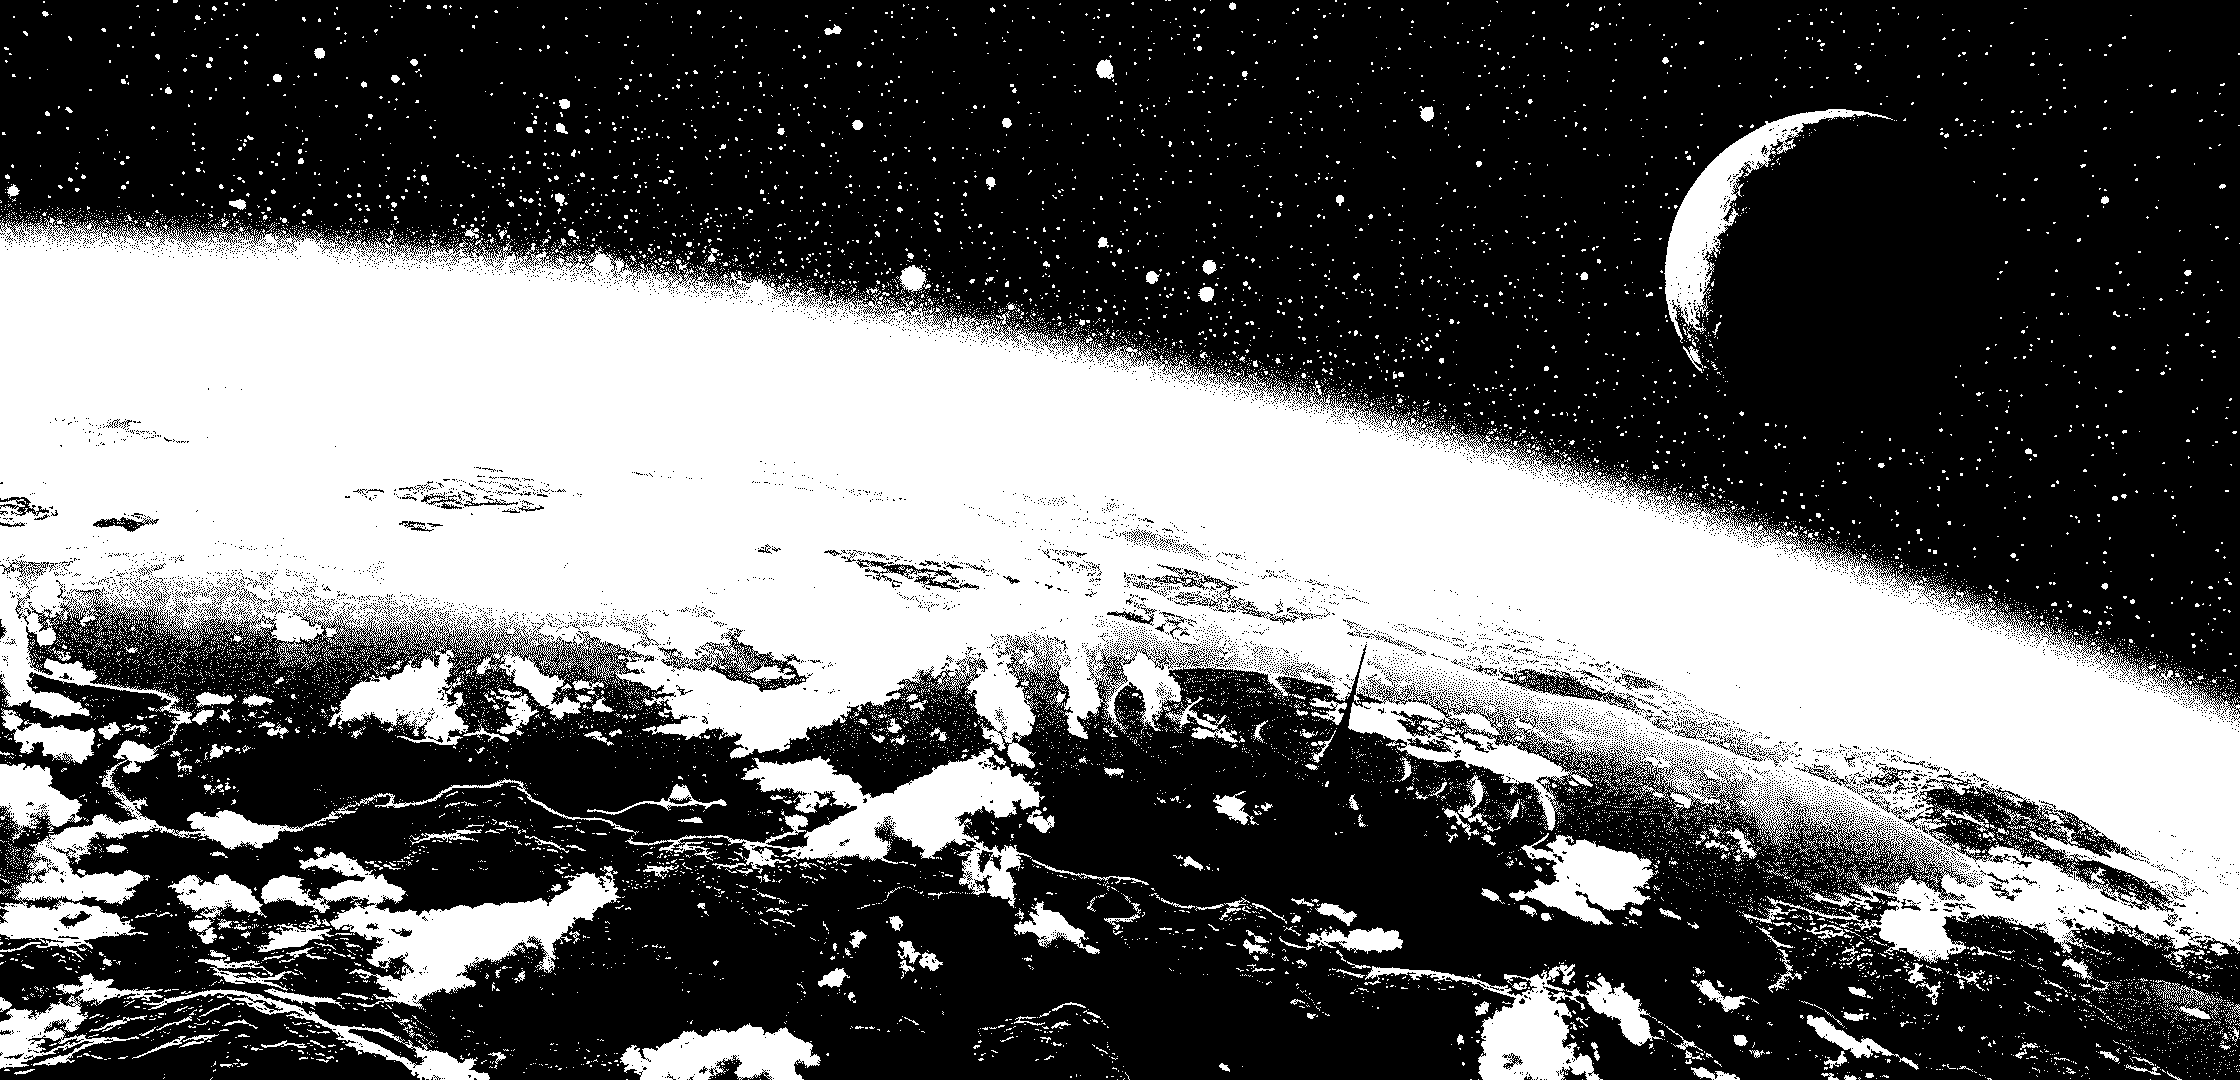
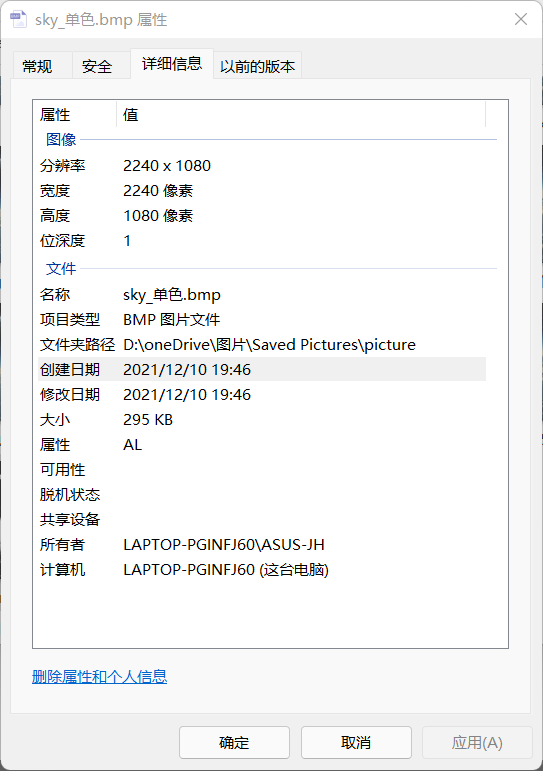
1. Monochrome bitmap
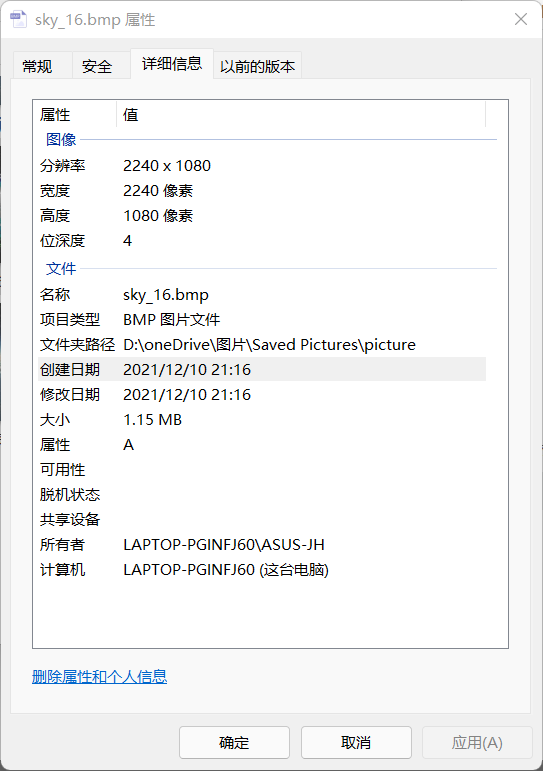
2.16 color bitmap
3.256 color bitmap
4. Information of three pictures
Monochrome:
16 colors:
256 colors:

It can be clearly found that the more colors, the larger the picture
3, Picture processing programming
(1) Singular function decomposition (SDV)
1. Code
import numpy as np
import os
from PIL import Image
import matplotlib.pyplot as plt
import matplotlib as mpl
from pprint import pprint


def restore1(sigma, u, v, K):  # Singular value, left eigenvector, right eigenvector
    m = len(u)
    n = len(v[0])
    a = np.zeros((m, n))
    for k in range(K):
        uk = u[:, k].reshape(m, 1)
        vk = v[k].reshape(1, n)
        a += sigma[k] * np.dot(uk, vk)
    a[a < 0] = 0
    a[a > 255] = 255
    # a = a.clip(0, 255)
    return np.rint(a).astype('uint8')


def restore2(sigma, u, v, K):  # Singular value, left eigenvector, right eigenvector
    m = len(u)
    n = len(v[0])
    a = np.zeros((m, n))
    for k in range(K+1):
        for i in range(m):
            a[i] += sigma[k] * u[i][k] * v[k]
    a[a < 0] = 0
    a[a > 255] = 255
    return np.rint(a).astype('uint8')


if __name__ == "__main__":
    A = Image.open("./Lena.jpeg", 'r')
    print(A)
    output_path = r'./SVD_Output'
    if not os.path.exists(output_path):
        os.mkdir(output_path)
    a = np.array(A)
    print(a.shape)
    K = 50
    u_r, sigma_r, v_r = np.linalg.svd(a[:, :, 0])
    u_g, sigma_g, v_g = np.linalg.svd(a[:, :, 1])
    u_b, sigma_b, v_b = np.linalg.svd(a[:, :, 2])
    plt.figure(figsize=(11, 9), facecolor='w')
    mpl.rcParams['font.sans-serif'] = ['simHei']
    mpl.rcParams['axes.unicode_minus'] = False
    for k in range(1, K+1):
        print(k)
        R = restore1(sigma_r, u_r, v_r, k)
        G = restore1(sigma_g, u_g, v_g, k)
        B = restore1(sigma_b, u_b, v_b, k)
        I = np.stack((R, G, B), axis=2)
        Image.fromarray(I).save('%s\\svd_%d.jpeg' % (output_path, k))
        if k <= 50:
            plt.subplot(10, 5, k)
            plt.imshow(I)
            plt.axis('off')
            plt.title('Number of singular values:%d' % k)
    plt.suptitle('SVD Image decomposition', fontsize=20)
    #plt.tight_layout(0.3, rect=(0, 0, 1, 0.92))
    # plt.subplots_adjust(top=0.9)
    plt.show()
2. Operation results
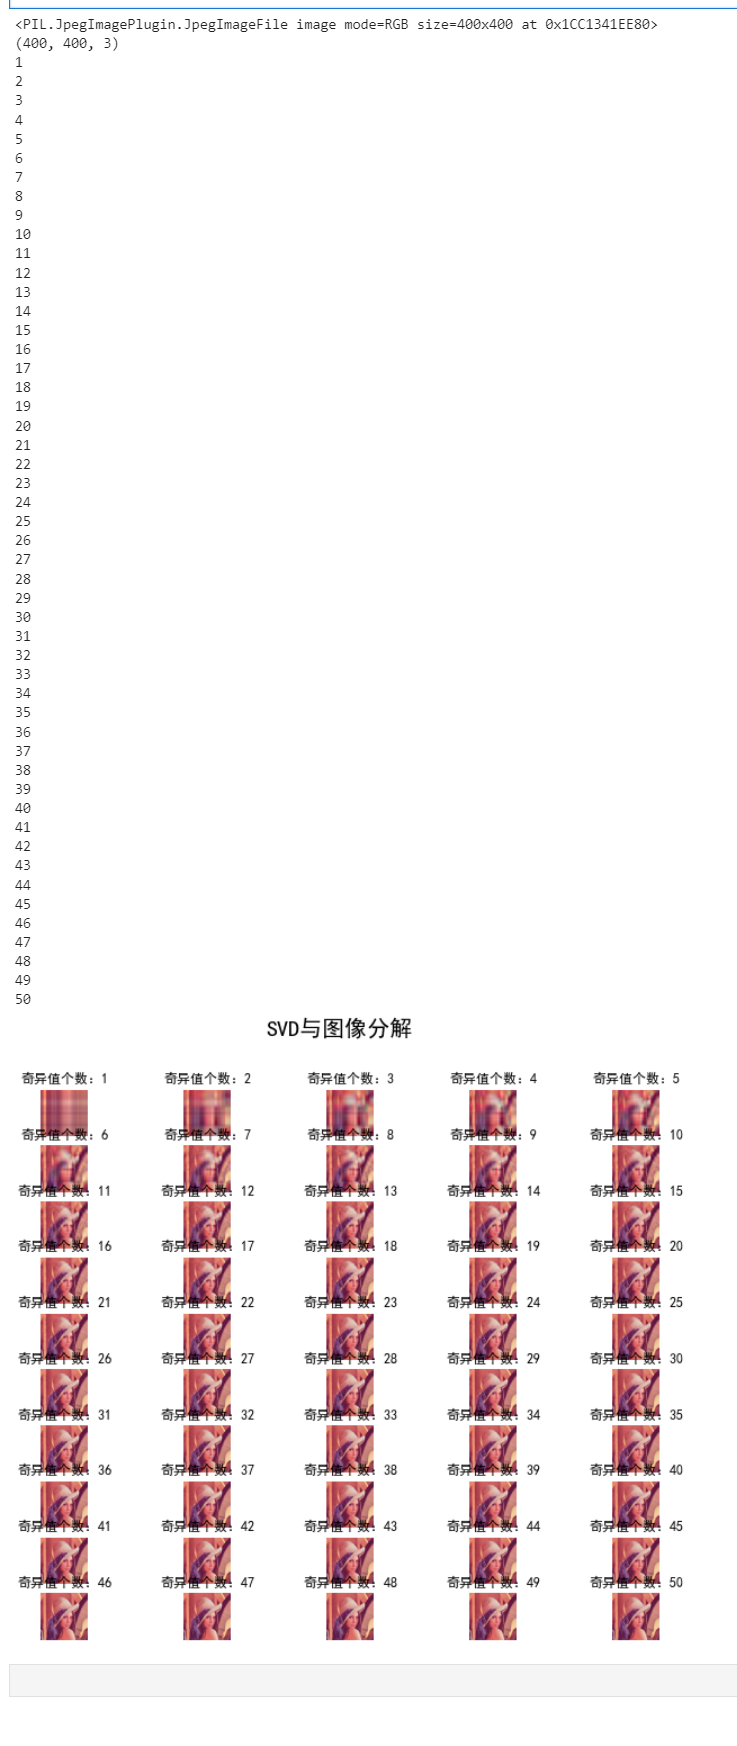
It can be observed that the picture becomes clearer and clearer with the increase of singular value.
(2) The number of coins and cells in the two sample images is detected by image opening and closing operation (corrosion expansion)
1. Coin Code
import cv2
import numpy as np
def stackImages(scale, imgArray):
"""
Press multiple images into the same window for display
:param scale:float Type, output image display percentage, control zoom scale, 0.5=The image resolution is reduced by half
:param imgArray:Tuple nested list, image matrix to be arranged
:return:Output image
"""
rows = len(imgArray)
cols = len(imgArray[0])
rowsAvailable = isinstance(imgArray[0], list)
width = imgArray[0][0].shape[1]
height = imgArray[0][0].shape[0]
if rowsAvailable:
for x in range(0, rows):
for y in range(0, cols):
if imgArray[x][y].shape[:2] == imgArray[0][0].shape[:2]:
imgArray[x][y] = cv2.resize(imgArray[x][y], (0, 0), None, scale, scale)
else:
imgArray[x][y] = cv2.resize(imgArray[x][y], (imgArray[0][0].shape[1], imgArray[0][0].shape[0]),
None, scale, scale)
if len(imgArray[x][y].shape) == 2: imgArray[x][y] = cv2.cvtColor(imgArray[x][y], cv2.COLOR_GRAY2BGR)
imageBlank = np.zeros((height, width, 3), np.uint8)
hor = [imageBlank] * rows
hor_con = [imageBlank] * rows
for x in range(0, rows):
hor[x] = np.hstack(imgArray[x])
ver = np.vstack(hor)
else:
for x in range(0, rows):
if imgArray[x].shape[:2] == imgArray[0].shape[:2]:
imgArray[x] = cv2.resize(imgArray[x], (0, 0), None, scale, scale)
else:
imgArray[x] = cv2.resize(imgArray[x], (imgArray[0].shape[1], imgArray[0].shape[0]), None, scale, scale)
if len(imgArray[x].shape) == 2: imgArray[x] = cv2.cvtColor(imgArray[x], cv2.COLOR_GRAY2BGR)
hor = np.hstack(imgArray)
ver = hor
return ver
#Read picture
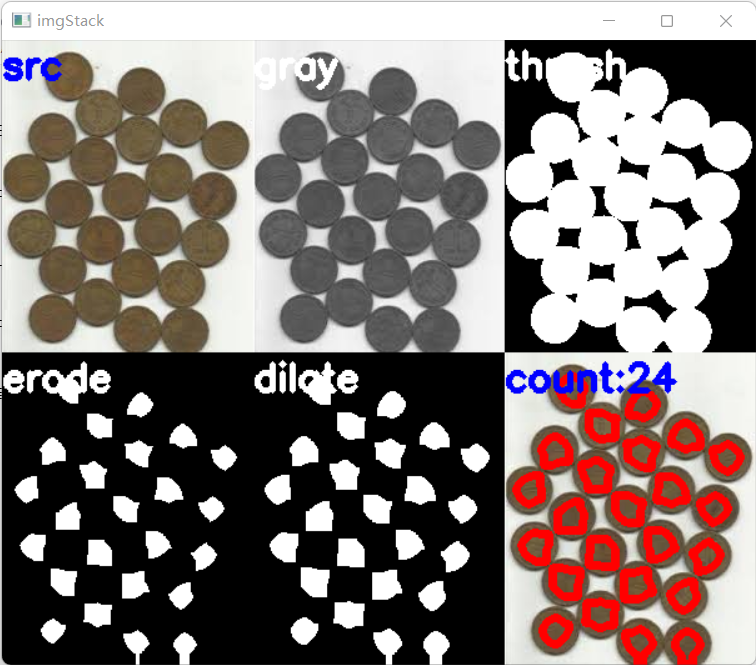
src = cv2.imread("./coin.png")
img = src.copy()
#Grayscale
img_1 = cv2.cvtColor(img, cv2.COLOR_BGR2GRAY)
#Binarization
ret, img_2 = cv2.threshold(img_1, 127, 255, cv2.THRESH_BINARY_INV + cv2.THRESH_OTSU)
#Corrosion (corrosion is mainly to distinguish each coin. If it is too large, it will cause loss, and if it is too low, it will not be able to distinguish. The parameters can be set by themselves to achieve appropriate.)
kernel = np.ones((17, 17), int)
img_3 = cv2.erode(img_2, kernel, iterations=1)
#Expand (expand to the appropriate value so that each white area is a coin.)
kernel = np.ones((3, 3), int)
img_4 = cv2.dilate(img_3, kernel, iterations=1)
#Find the coin center
contours, hierarchy = cv2.findContours(img_4, cv2.RETR_EXTERNAL, cv2.CHAIN_APPROX_NONE)[-2:]
#Identification coin
cv2.drawContours(img, contours, -1, (0, 0, 255), 5)
#display picture
cv2.putText(img, "count:{}".format(len(contours)), (0, 30), cv2.FONT_HERSHEY_SIMPLEX, 1.0, (255, 0, 0), 3)
cv2.putText(src, "src", (0, 30), cv2.FONT_HERSHEY_SIMPLEX, 1.0, (255, 0, 0), 3)
cv2.putText(img_1, "gray", (0, 30), cv2.FONT_HERSHEY_SIMPLEX, 1.0, (255, 0, 0), 3)
cv2.putText(img_2, "thresh", (0, 30), cv2.FONT_HERSHEY_SIMPLEX, 1.0, (255, 0, 0), 3)
cv2.putText(img_3, "erode", (0, 30), cv2.FONT_HERSHEY_SIMPLEX, 1.0, (255, 0, 0), 3)
cv2.putText(img_4, "dilate", (0, 30), cv2.FONT_HERSHEY_SIMPLEX, 1.0, (255, 0, 0), 3)
imgStack = stackImages(1, ([src, img_1, img_2], [img_3, img_4, img]))
cv2.imshow("imgStack", imgStack)
cv2.waitKey(0)
2. Results
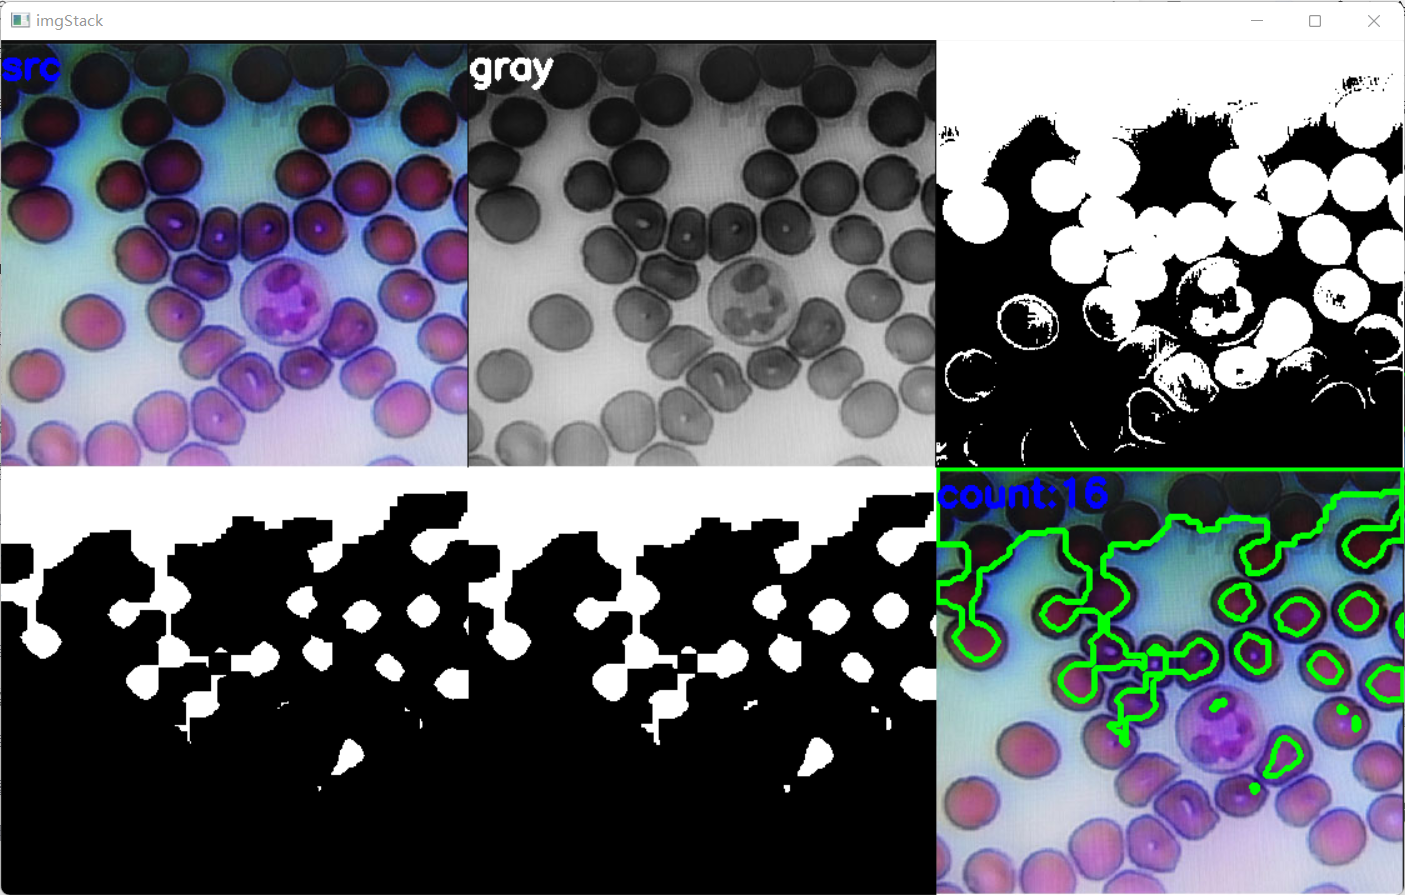
3. Cell code
Insert the code slice here
4. Results
4, Picture bar code positioning
1. Code
import cv2
import pyzbar.pyzbar as pyzbar
import numpy
from PIL import Image, ImageDraw, ImageFont
import matplotlib.pyplot as plt # plt is used to display pictures
import matplotlib.image as mpimg # mpimg is used to read pictures
def decodeDisplay(img_path):
img_data = cv2.imread(img_path)
# Convert to grayscale image
gray = cv2.cvtColor(img_data, cv2.COLOR_BGR2GRAY)
barcodes = pyzbar.decode(gray)
for barcode in barcodes:
# The location of the bounding box from which the barcode is extracted
# Draw the bounding box of the barcode in the image
(x, y, w, h) = barcode.rect
cv2.rectangle(img_data, (x, y), (x + w, y + h), (0, 255, 0), 5)
# The barcode data is a byte object, so if we want to print it on the output image
# To draw it, you need to convert it into a string first
barcodeData = barcode.data.decode("utf-8")
barcodeType = barcode.type
#Cannot display Chinese
# Draw the barcode data and barcode type on the image
#text = "{} ({})".format(barcodeData, barcodeType)
#cv2.putText(imagex1, text, (x, y - 10), cv2.FONT_HERSHEY_SIMPLEX,5, (0, 0, 125), 2)
#Replace with:
img_PIL = Image.fromarray(cv2.cvtColor(img_data, cv2.COLOR_BGR2RGB))
# Parameters (font, default size)
font = ImageFont.truetype('msyh.ttc', 150)
# Font color (rgb)
fillColor = (0, 255, 255)
# Text output location
position = (x, y-50)
# Output content
str = barcodeData
# You need to convert the output Chinese characters into Unicode encoding (str.decode ("UTF-8")
draw = ImageDraw.Draw(img_PIL)
draw.text(position, str, font=font, fill=fillColor)
# Use the save method in PIL to save the picture locally
img_PIL.save('ma1.jpg', 'jpeg')
# Print barcode data and barcode type to the terminal
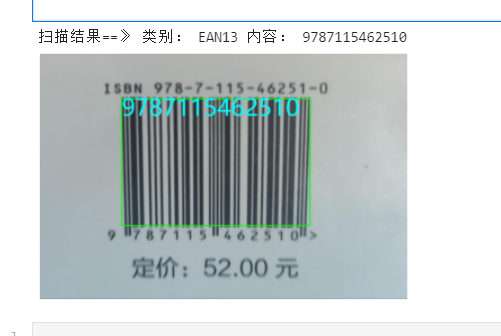
print("Scanning results==> Category: {0} Content: {1}".format(barcodeType, barcodeData))
ma1 = mpimg.imread('ma1.jpg')
img = plt.imshow(ma1)
plt.axis('off') # Do not display axes
plt.show()
if __name__ == '__main__':
decodeDisplay("ma.jpg")
2. Original drawing
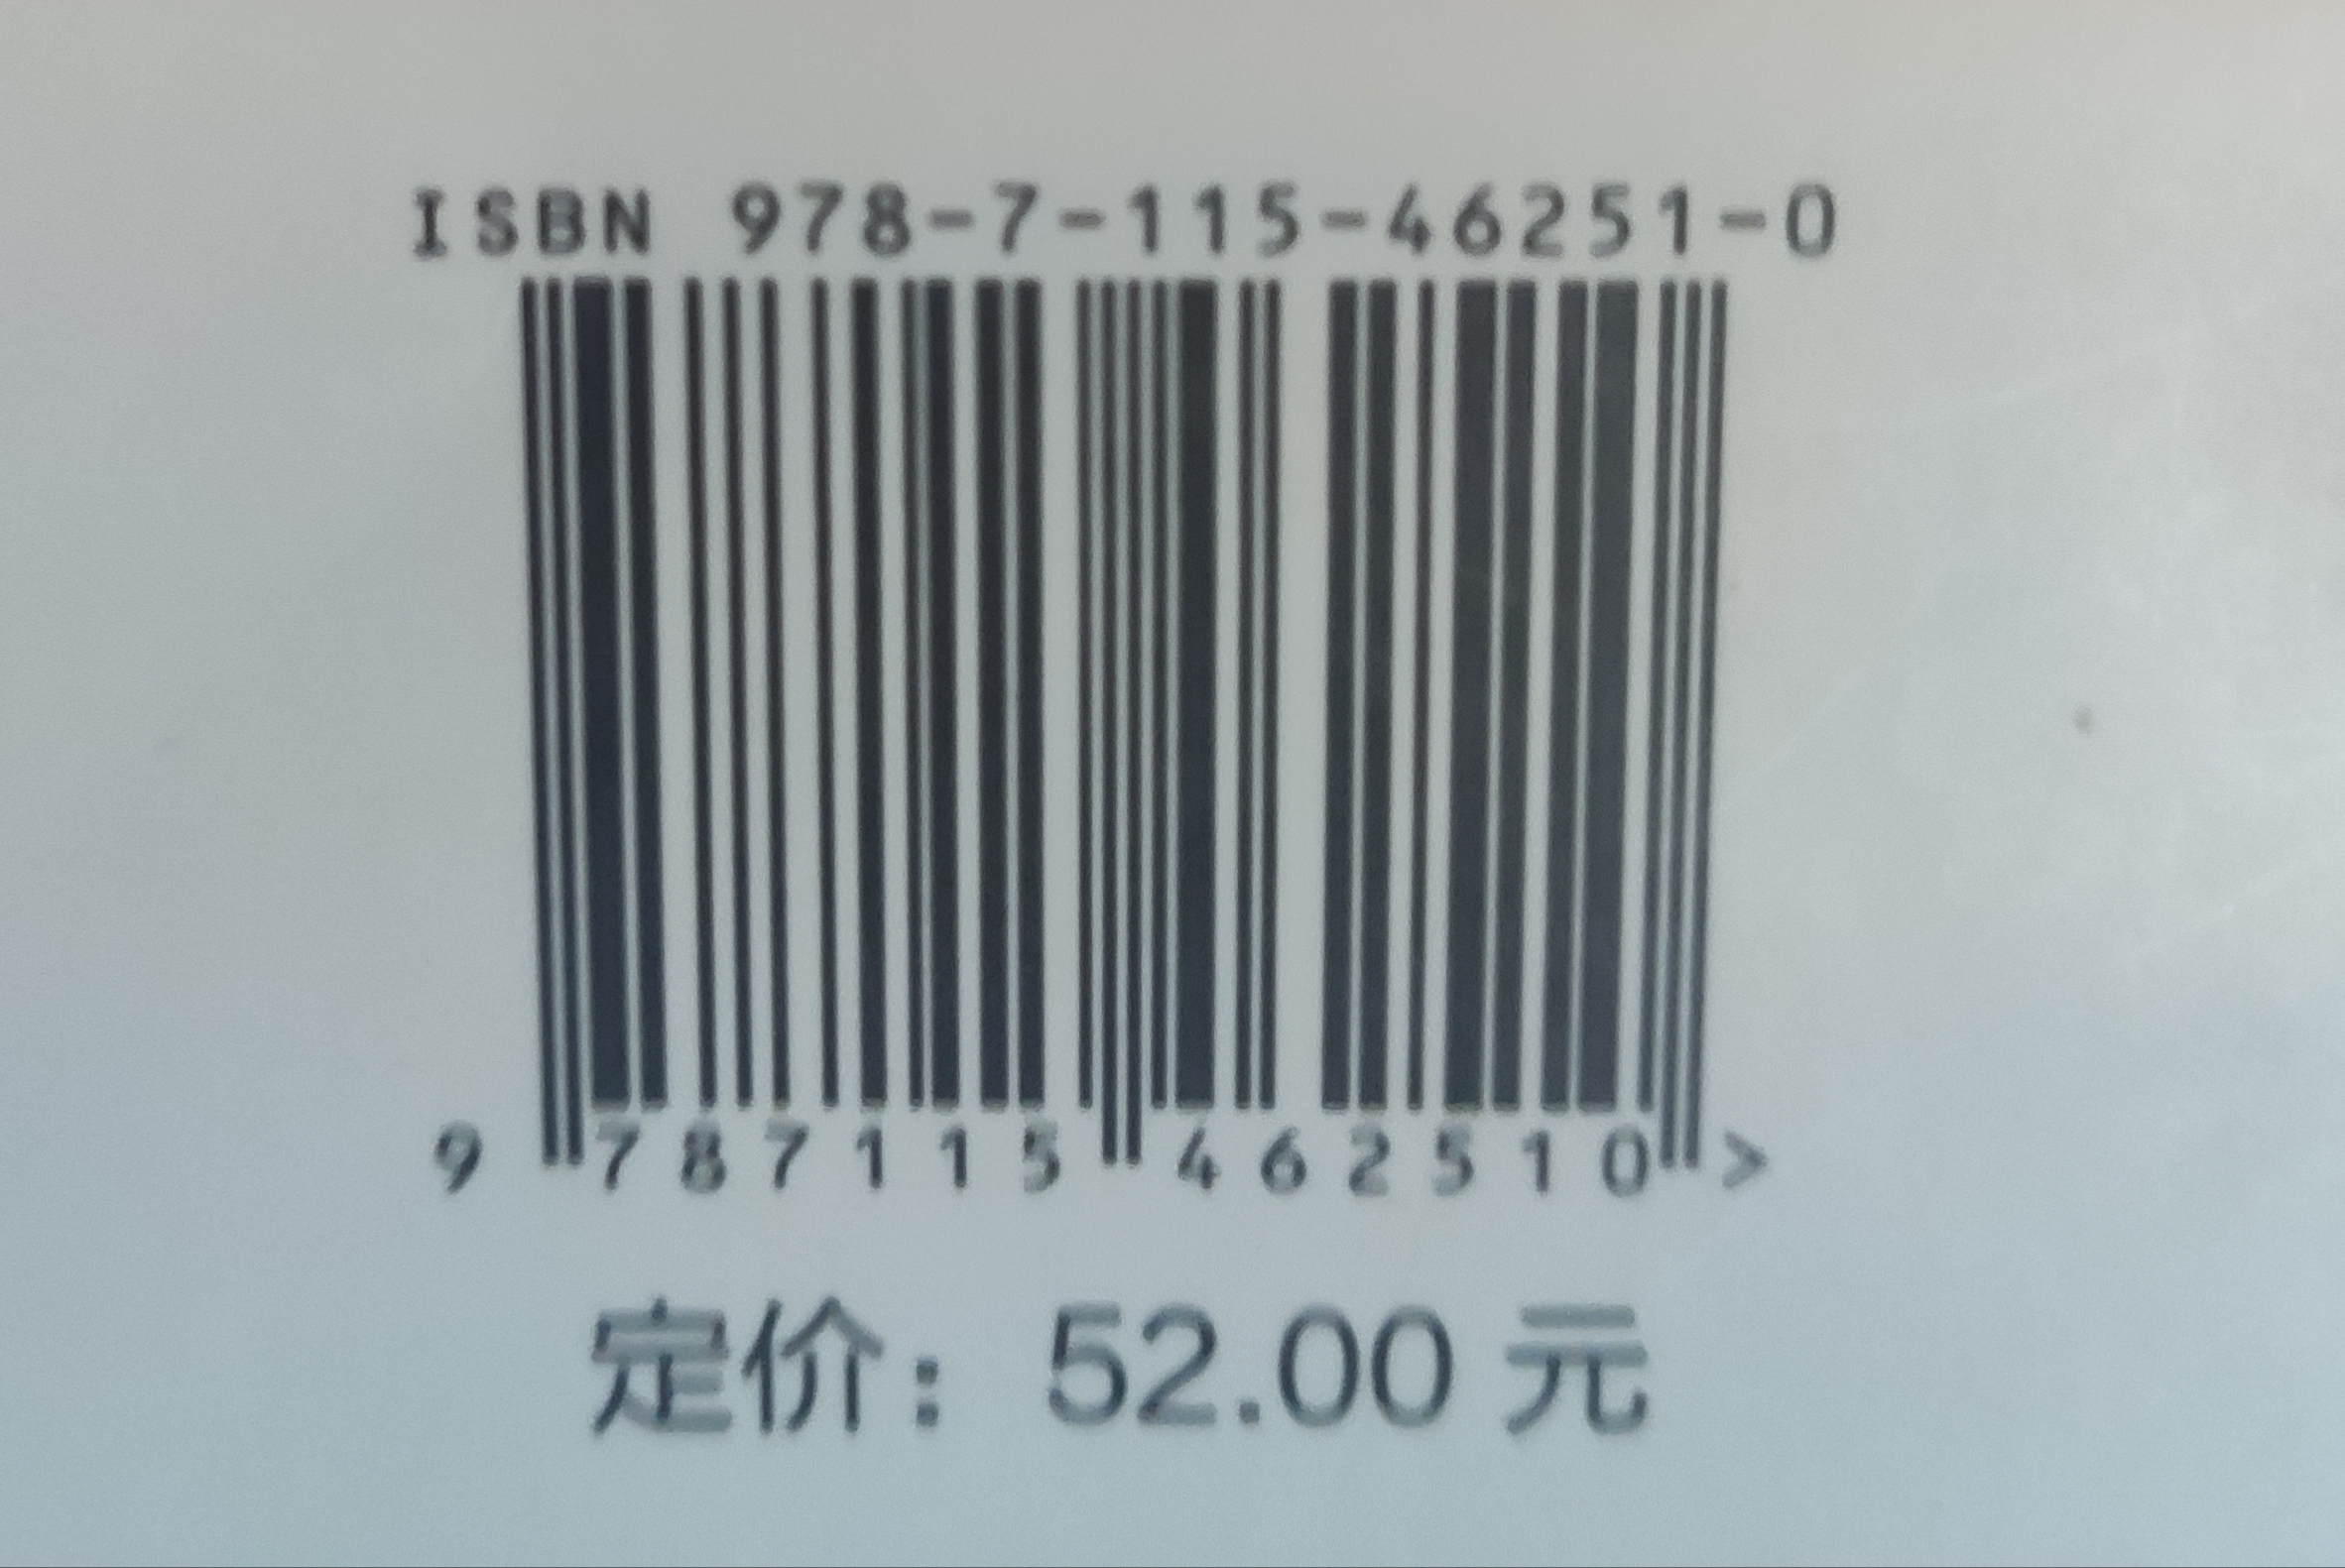
3. Results
5, Summary
Have a further understanding of bitmap, strengthen the learning of image programming processing, distinguish the difference of bitmap, more image color, larger image, and know the calculation of bitmap size.
6, Reference link
python implements two methods of reading and displaying pictures