Recently, little F saw a problem about shaking tiktok.
It is mentioned that at present, China's per capita swipes short videos for 110 minutes a day.
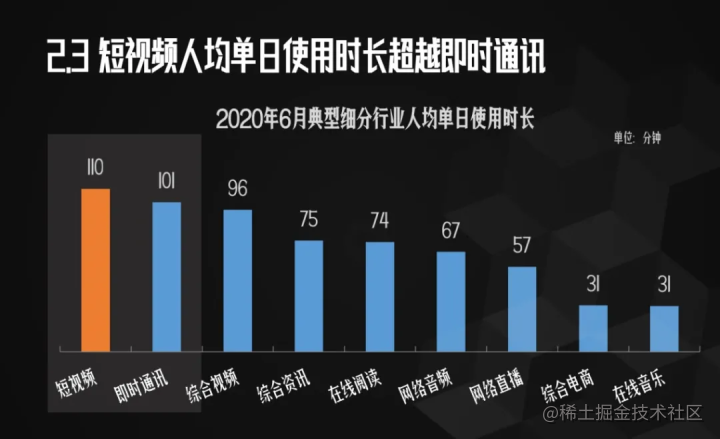
Look at this data, it seems that little F has been averaged again.
But honestly, as long as we turn on the jitter, F is really tiktok.
Therefore, we should tiktok and read more books. Or time will pass.
Tiktok, what type of video is most popular in this issue?
/01 / data acquisition
The data comes from third party monitoring tiktok V, which is 5000+ data.
I have uploaded the file. Click the blue font at the end of the text to get it
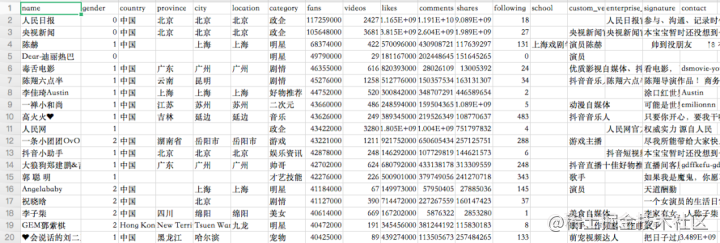
It mainly includes the nickname, gender, location, type, number of likes, number of fans, number of videos, number of comments, number of shares, number of concerns, graduation school, certification, profile and other information of big V.
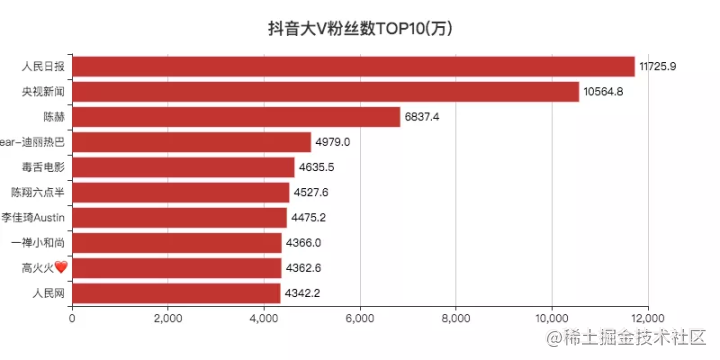
Among them, the people's Daily has the largest number of fans, nearly 120 million. "CCTV news" has also exceeded 100 million. I remember that when it exceeded 100 million, it was searched for overheating ~
Bloggers with the least fans also have nearly 150w + fans. These 5000 big V have a total of 23.65 billion fans, more than three times the population of the earth!
/02 / data visualization
Import the relevant library and read the data.
from pyecharts.charts import Pie, Bar, TreeMap, Map, Geo from wordcloud import WordCloud, ImageColorGenerator from pyecharts import options as opts import matplotlib.pyplot as plt from PIL import Image import pandas as pd import numpy as np import jieba df = pd.read_csv('douyin.csv', header=0, encoding='utf-8-sig') print(df)
01 gender distribution
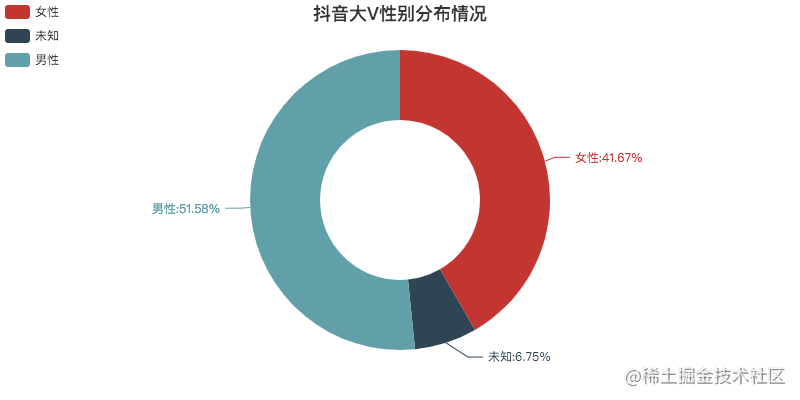
On the whole, there is little difference between men and women.
Remove unknown data, basically 1:1.
The visualization code is as follows.
def create_gender(df):
    df = df.copy()
    # Modify value
    df.loc[df.gender == '0', 'gender'] = 'unknown'
    df.loc[df.gender == '1', 'gender'] = 'Male'
    df.loc[df.gender == '2', 'gender'] = 'female sex'
    # Grouped by gender
    gender_message = df.groupby(['gender'])
    # Count the results after grouping
    gender_com = gender_message['gender'].agg(['count'])
    gender_com.reset_index(inplace=True)

    # Pie chart data
    attr = gender_com['gender']
    v1 = gender_com['count']

    # Initialize configuration
    pie = Pie(init_opts=opts.InitOpts(width="800px", height="400px"))
    # Add data, set radius
    pie.add("", [list(z) for z in zip(attr, v1)], radius=["40%", "75%"])
    # Set global configuration items, title, legend and toolbox (download pictures)
    pie.set_global_opts(title_opts=opts.TitleOpts(title="Tiktok V Gender distribution", pos_left="center", pos_top="top"),
                        legend_opts=opts.LegendOpts(orient="vertical", pos_left="left"),
                        toolbox_opts=opts.ToolboxOpts(is_show=True, feature={"saveAsImage": {}}))
    # Set series configuration item, label style
    pie.set_series_opts(label_opts=opts.LabelOpts(is_show=True, formatter="{b}:{d}%"))
    pie.render("Tiktok V Gender distribution.html")
Copy code
02 likes
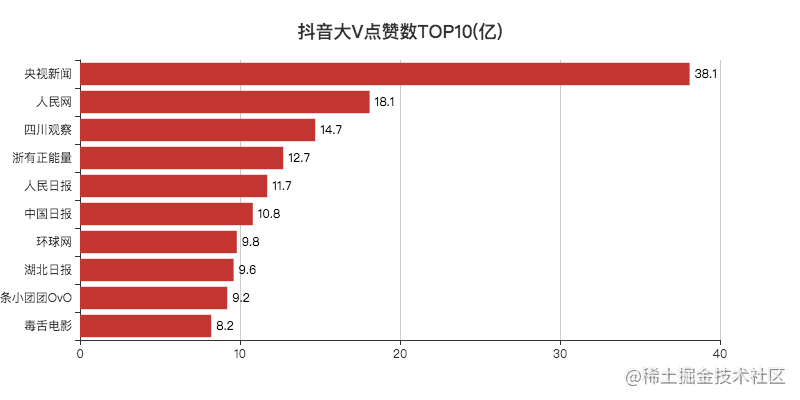
The number of likes is top 10. Except for "small group" and "poisonous tongue", others are big V in news media.
This year, because of the epidemic, many news reports are on the tiktok for the first time, so the influence is relatively large, and the praise is quite a lot.
I remember that "Sichuan observation" was ridiculed by the comment area as observation everywhere, which means that the news is released very quickly.
What's the tiktok of 1 million big V? The small F's voice has 20w+'s praise.
Finally, it is found that the problem is included in the third-party monitoring. This batch of data can be directly eliminated next time.
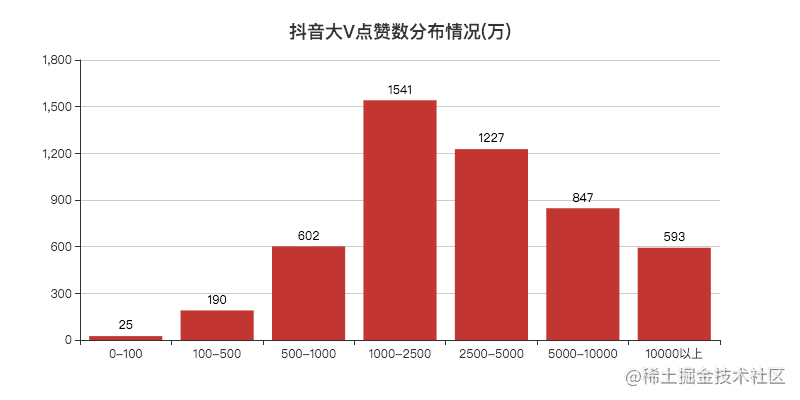
There are more than 500 big V's that like more than 100 million, and the number of big V's that like 10 million to 50 million is the largest.
The visualization code is as follows.
def create_likes(df):
# Sort, descending
df = df.sort_values('likes', ascending=False)
# Get data for TOP10
attr = df['name'][0:10]
v1 = [float('%.1f' % (float(i) / 100000000)) for i in df['likes'][0:10]]
# Initialize configuration
bar = Bar(init_opts=opts.InitOpts(width="800px", height="400px"))
# x-axis data
bar.add_xaxis(list(reversed(attr.tolist())))
# y-axis data
bar.add_yaxis("", list(reversed(v1)))
# Set global configuration items, such as title, toolbox (download picture) and y-axis split line
bar.set_global_opts(title_opts=opts.TitleOpts(title="Tiktok V Number of likes TOP10(Hundred million)", pos_left="center", pos_top="18"),
toolbox_opts=opts.ToolboxOpts(is_show=True, feature={"saveAsImage": {}}),
xaxis_opts=opts.AxisOpts(splitline_opts=opts.SplitLineOpts(is_show=True)))
# Set series configuration item, label style
bar.set_series_opts(label_opts=opts.LabelOpts(is_show=True, position="right", color="black"))
bar.reversal_axis()
bar.render("Tiktok V Number of likes TOP10(Hundred million).html")
def create_cut_likes(df):
# Segment data
Bins = [0, 1000000, 5000000, 10000000, 25000000, 50000000, 100000000, 5000000000]
Labels = ['0-100', '100-500', '500-1000', '1000-2500', '2500-5000', '5000-10000', '10000 above']
len_stage = pd.cut(df['likes'], bins=Bins, labels=Labels).value_counts().sort_index()
# get data
attr = len_stage.index.tolist()
v1 = len_stage.values.tolist()
# Generate histogram
bar = Bar(init_opts=opts.InitOpts(width="800px", height="400px"))
bar.add_xaxis(attr)
bar.add_yaxis("", v1)
bar.set_global_opts(title_opts=opts.TitleOpts(title="Tiktok V Distribution of likes(ten thousand)", pos_left="center", pos_top="18"),
toolbox_opts=opts.ToolboxOpts(is_show=True, feature={"saveAsImage": {}}),
yaxis_opts=opts.AxisOpts(splitline_opts=opts.SplitLineOpts(is_show=True)))
bar.set_series_opts(label_opts=opts.LabelOpts(is_show=True, position="top", color="black"))
bar.render("Tiktok V Distribution of likes(ten thousand).html")
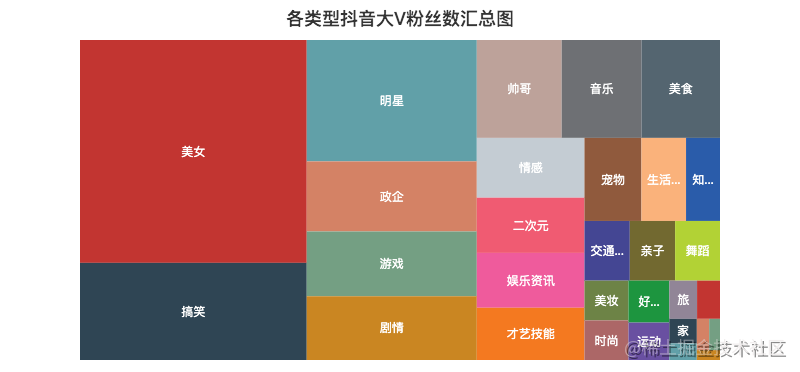
Copy code03 number of fans
People's daily and CCTV news have more than 100 million fans.
Compared with last year's tremble data, "tiktok" has lost hundreds of thousands of fans, and Chen he has increased many fans.
It's not surprising that Li Jiaqi is ranked in the top ten this year. After all, he is the first brother with goods.
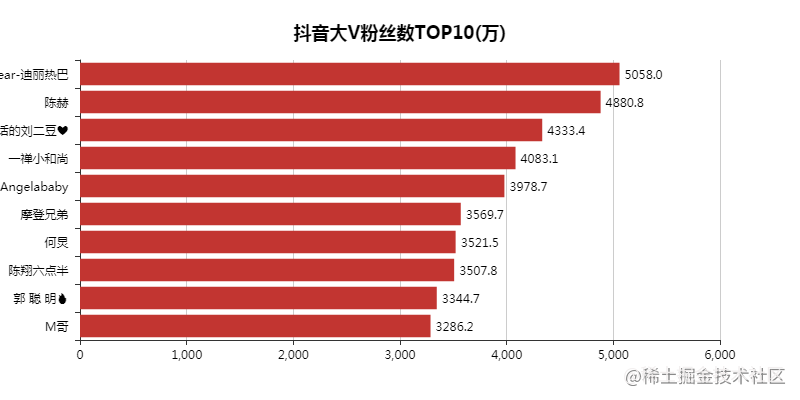
Let's take a look at the distribution of the number of big V fans.
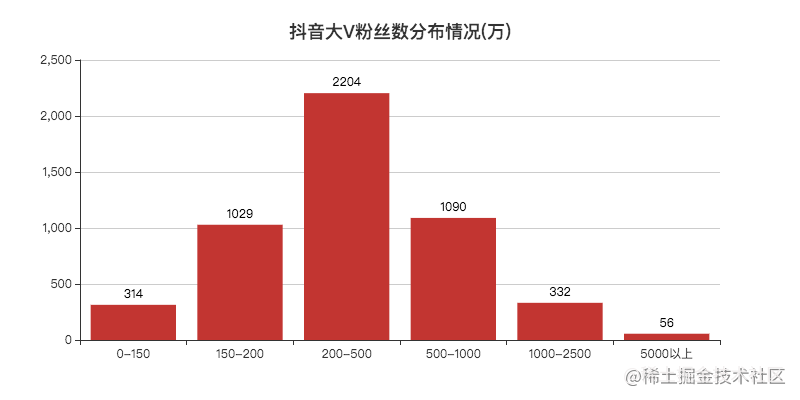
More than 50 million, 56, proper bosses.
The number of people in 200w~500w is the largest, and many bloggers who are hot for a while don't rise much after a period of time.
Maybe they all stay here, such as the "three flowers" painted by Xiao F before. I don't understand that they can fire
The visual code here is similar to the above, so it won't be released.
The official account tiktok is answered, and the complete code is obtained.
04 top 10 comments
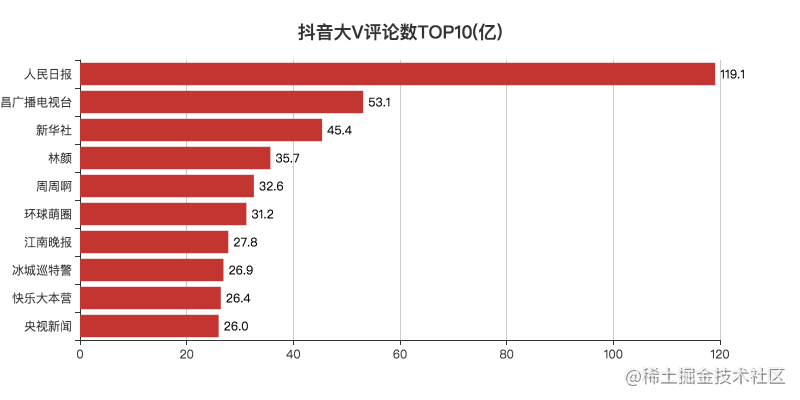
Tiktok video commentary area is also more interesting.
For example, as a reminder of the drama, "hurry to update. It's been more than ten minutes. The donkeys of the production team dare not rest for so long.".
Five cats shaking their heads madly also occupied the comment area for some time.
Little F can only say that it's too magical ~
Generally speaking, there are more video comments in the media category.
05 top 10
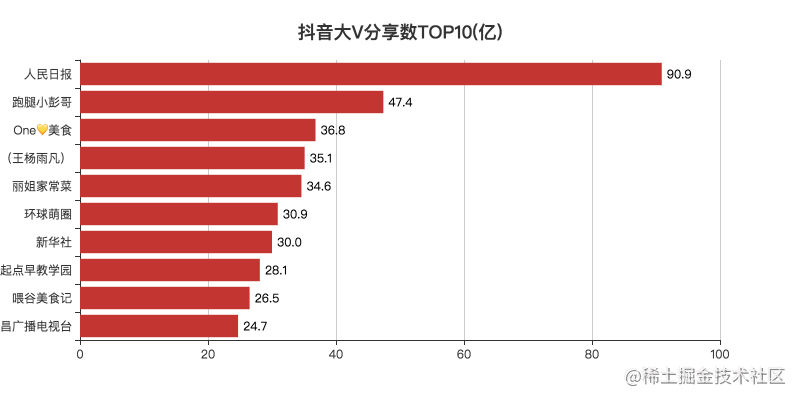
The sharing of shaking is a way of video to spread tiktok, which enables more people to see video.
From the data, we still prefer to share news and food videos.
It may be that during the Chinese New Year epidemic, when you stay at home for a month, except ge you lying and watching the news, you just eat.
Everyone has a dream of becoming a chef.
06 summary and distribution of likes / fans of various types
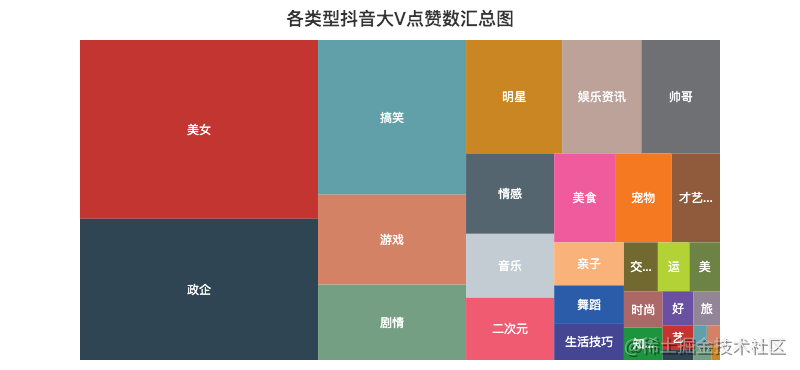
Tiktok once said that a product of Kill Time is not a Save Time, but a technology that is slightly deeper can basically survive.
As can be seen from the rectangular tree above, everyone likes "beauty" videos. After all, who doesn't like beautiful girls
For example, there are too many videos of girls exploding in love, such as watching the sister of the copper man, the sister who sends stars all over the sky in the college entrance examination, knives and knives, etc
In addition, videos of "funny", "game" and "plot" are also more attractive, with proper Kill Time.
The visualization code is as follows.
def create_type_likes(df):
    # Group summation
    likes_type_message = df.groupby(['category'])
    likes_type_com = likes_type_message['likes'].agg(['sum'])
    likes_type_com.reset_index(inplace=True)
    # Processing data
    dom = []
    for name, num in zip(likes_type_com['category'], likes_type_com['sum']):
        data = {}
        data['name'] = name
        data['value'] = num
        dom.append(data)
    print(dom)

    # Initialize configuration
    treemap = TreeMap(init_opts=opts.InitOpts(width="800px", height="400px"))
    # Add data
    treemap.add('', dom)
    # Set global configuration items, title and toolbox (download pictures)
    treemap.set_global_opts(title_opts=opts.TitleOpts(title="Each type has tiktok. V Summary of likes", pos_left="center", pos_top="5"),
                            toolbox_opts=opts.ToolboxOpts(is_show=True, feature={"saveAsImage": {}}),
                            legend_opts=opts.LegendOpts(is_show=False))

    treemap.render("Each type has tiktok. V Summary of likes.html")
Copy code
07 top 10 average video likes / fans
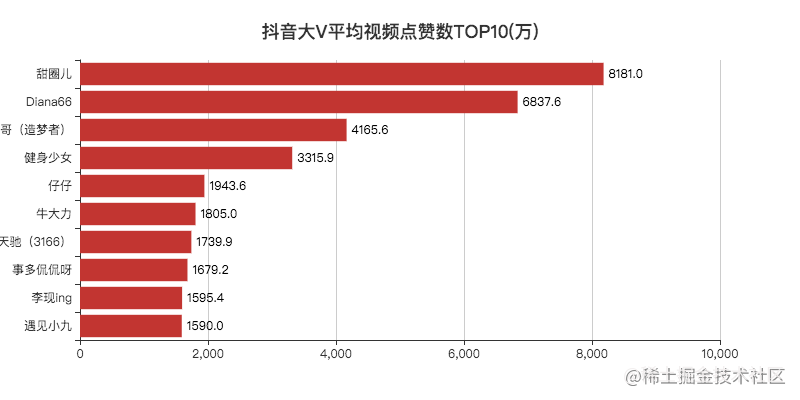
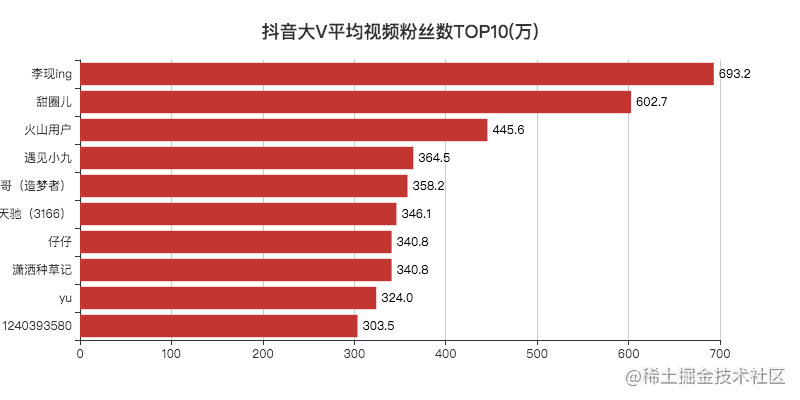
"Li Xian", as the top traffic in 2019, has no problem reaching the top.
Other bloggers, Xiao F, haven't paid attention to any of them.
I searched and found that most accounts have only one or two videos.
After reading the comment area, I found that the original number was sold. It may be that big V broke up with the company. After all, there are many online popular companies now. If they are not hot, they will be next.

The other is personal account transfer, cash in and make money.
The visualization code is as follows.
def create_avg_likes(df):
    # screen
    df = df[df['videos'] > 0]
    # Calculate the average likes of a single video
    df.eval('result = likes/(videos*10000)', inplace=True)
    df['result'] = df['result'].round(decimals=1)
    df = df.sort_values('result', ascending=False)

    # Take TOP10
    attr = df['name'][0:10]
    v1 = ['%.1f' % (float(i)) for i in  df['result'][0:10]]

    # Initialize configuration
    bar = Bar(init_opts=opts.InitOpts(width="800px", height="400px"))
    # Add data
    bar.add_xaxis(list(reversed(attr.tolist())))
    bar.add_yaxis("", list(reversed(v1)))
    # Set global configuration items, such as title, toolbox (download picture) and y-axis split line
    bar.set_global_opts(title_opts=opts.TitleOpts(title="Tiktok V Average video likes TOP10(ten thousand)", pos_left="center", pos_top="18"),
                        toolbox_opts=opts.ToolboxOpts(is_show=True, feature={"saveAsImage": {}}),
                        xaxis_opts=opts.AxisOpts(splitline_opts=opts.SplitLineOpts(is_show=True)))
    # Set series configuration items
    bar.set_series_opts(label_opts=opts.LabelOpts(is_show=True, position="right", color="black"))
    # Flip xy axis
    bar.reversal_axis()
    bar.render("Tiktok V Average video likes TOP10(ten thousand).html")
Copy code
08 tiktok V distribution

It can be seen that there is no big V in Tibet, so there is no color.
Guangdong, Zhejiang and Sichuan rank among the top three.
The visualization code is as follows.
def create_province_map(df):
    # Filter data
    df = df[df["country"] == "China"]
    df1 = df.copy()
    # Data replacement
    df1["province"] = df1["province"].str.replace("province", "").str.replace("Zhuang Autonomous Region", "").str.replace("Uygur Autonomous Region", "").str.replace("Autonomous Region", "")
    # Packet count
    df_num = df1.groupby("province")["province"].agg(count="count")
    df_province = df_num.index.values.tolist()
    df_count = df_num["count"].values.tolist()

    # Initialize configuration
    map = Map(init_opts=opts.InitOpts(width="800px", height="400px"))
    # map of China
    map.add("", [list(z) for z in zip(df_province, df_count)], "china")
    # Set global configuration items, title, toolbox (download pictures), color legend
    map.set_global_opts(title_opts=opts.TitleOpts(title="Tiktok V Provincial distribution", pos_left="center", pos_top="0"),
                        toolbox_opts=opts.ToolboxOpts(is_show=True, feature={"saveAsImage": {}}),
                        # Set value range 0-600, is_piecewise tag values are continuous
                        visualmap_opts=opts.VisualMapOpts(max_=600, is_piecewise=False))
    map.render("Tiktok V Provincial distribution.html")
Copy code
After reading the provinces, let's take a look at the top 10 cities.
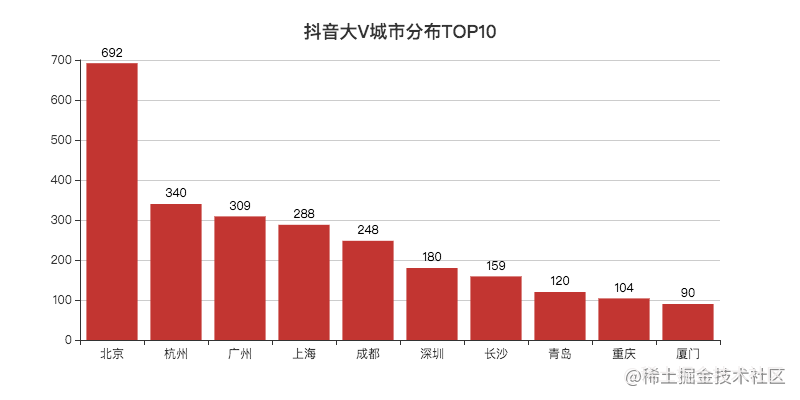
Beijing is far ahead, the gathering place of big V.
Hangzhou is a city rich in net popularity, ranking second.
The visualization code is as follows.
def create_city(df):
    df1 = df[df["country"] == "China"]
    df1 = df1.copy()
    df1["city"] = df1["city"].str.replace("city", "")

    df_num = df1.groupby("city")["city"].agg(count="count").reset_index().sort_values(by="count", ascending=False)
    df_city = df_num[:10]["city"].values.tolist()
    df_count = df_num[:10]["count"].values.tolist()

    bar = Bar(init_opts=opts.InitOpts(width="800px", height="400px"))
    bar.add_xaxis(df_city)
    bar.add_yaxis("", df_count)
    bar.set_global_opts(title_opts=opts.TitleOpts(title="Tiktok V Urban distribution TOP10", pos_left="center", pos_top="18"),
                        toolbox_opts=opts.ToolboxOpts(is_show=True, feature={"saveAsImage": {}}),
                        yaxis_opts=opts.AxisOpts(splitline_opts=opts.SplitLineOpts(is_show=True)))
    bar.set_series_opts(label_opts=opts.LabelOpts(is_show=True, position="top", color="black"))
    bar.render("Tiktok V Urban distribution TOP10.html")
Copy code
After reading at home, it should be abroad.
There are many "tiktok nuts" in Chinese.
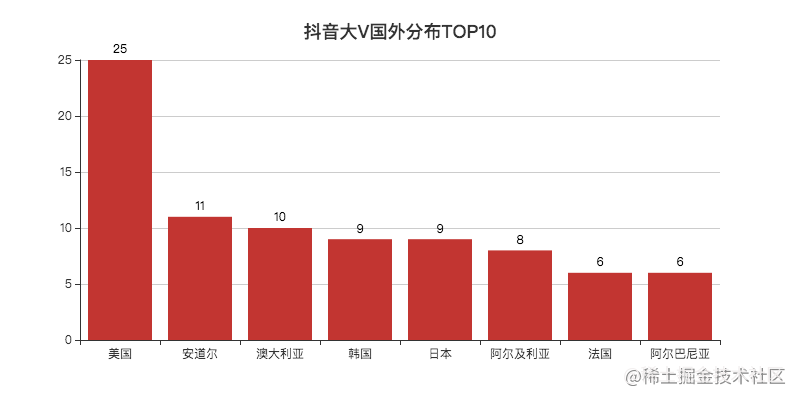
The United States ranks first. Many Chinese in the United States will share some things about their life in the United States.
Some people at home are also interested in this aspect to see whether the moon abroad is round or not.
Haha, I'm kidding. It's actually to let us know about life abroad.
09 tiktok V TOP10
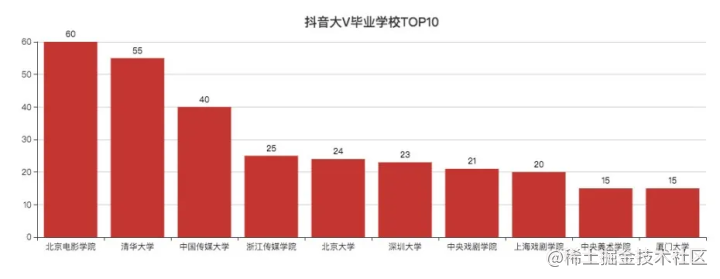
Beiying, Zhongchuan, zhejuan, Zhongxi, Shangxi, Yangmei, proper leaders in the performing arts circle.
Check the authentication of big V through the code.
df1 = df[(df["custom_verify"] != "") & (df["custom_verify"] != "unknown")]
df1 = df1.copy()
df_num = df1.groupby("custom_verify")["custom_verify"].agg(count="count").reset_index().sort_values(by="count", ascending=False)
print(df_num[:20])
Copy code
The results are as follows.
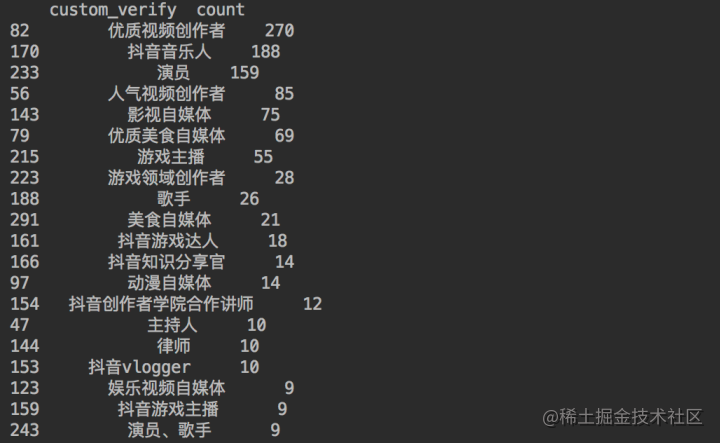
They all need talent for performance and expression
10 V, tiktok

It can be seen that most big V have left the information of business cooperation to benefit the content creators, so as to win-win.
According to statistics, the creators of over 22 million of the tiktok achieved over 41 billion 700 million yuan in revenue.
From creation to creation, this sentence is tiktok.
The visualization code is as follows.
def create_wordcloud(df, picture):
    words = pd.read_csv('chineseStopWords.txt', encoding='gbk', sep='\t', names=['stopword'])
    # participle
    text = ''
    df1 = df[df["signature"] != ""]
    df1 = df1.copy()
    for line in df1['signature']:
        text += ' '.join(jieba.cut(str(line).replace(" ", ""), cut_all=False))
    # Stop words
    stopwords = set('')
    stopwords.update(words['stopword'])
    backgroud_Image = plt.imread('douyin.png')
    # Use tiktok background color
    alice_coloring = np.array(Image.open(r"douyin.png"))
    image_colors = ImageColorGenerator(alice_coloring)
    wc = WordCloud(
        background_color='white',
        mask=backgroud_Image,
        font_path='Founder Lanting journal black.TTF',
        max_words=2000,
        max_font_size=70,
        min_font_size=1,
        prefer_horizontal=1,
        color_func=image_colors,
        random_state=50,
        stopwords=stopwords,
        margin=5
    )
    wc.generate_from_text(text)
    # Look at those with high word frequency
    process_word = WordCloud.process_text(wc, text)
    sort = sorted(process_word.items(), key=lambda e: e[1], reverse=True)
    print(sort[:50])
    plt.imshow(wc)
    plt.axis('off')
    wc.to_file(picture)
    print('Word cloud generated successfully!')
Copy code