Environmental preparation
kettle
mysql database
Python environment
requirement
- Use the preprocessing tool (kettle) to clean up the provided text data and import it into the database;
- Analyze and count the cleaned data, count the average expenditure of users in each city on traffic and voice, draw a chart with Python, and save the results;
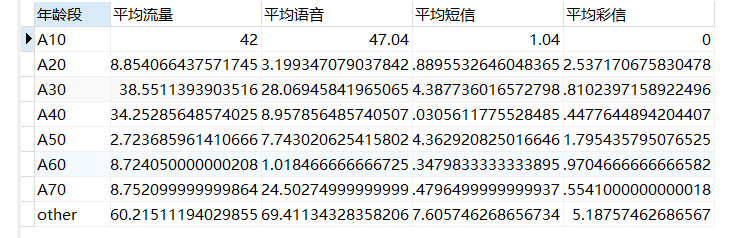
- Count the average expenditure of users of all ages on traffic and voice, draw a chart in Python, and save the results
Look at the results in advance

get data
The data is two different csv files

Get Baidu online disk
Link: https://pan.baidu.com/s/1ocLrIhY5rHAzwdKdvZr13g
Extraction code: klyo
Processing data
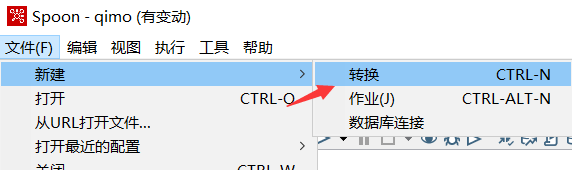
1. Open the kettle tool
- New conversion
- Highlight the following steps

- Perform step configuration
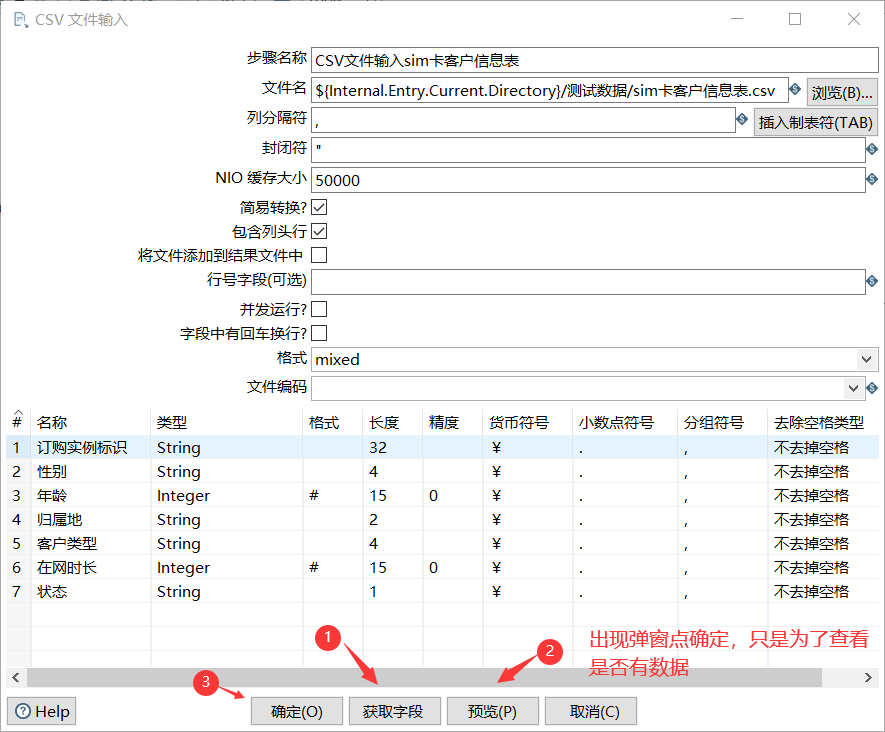
3.1. CSV file input sim card customer information table

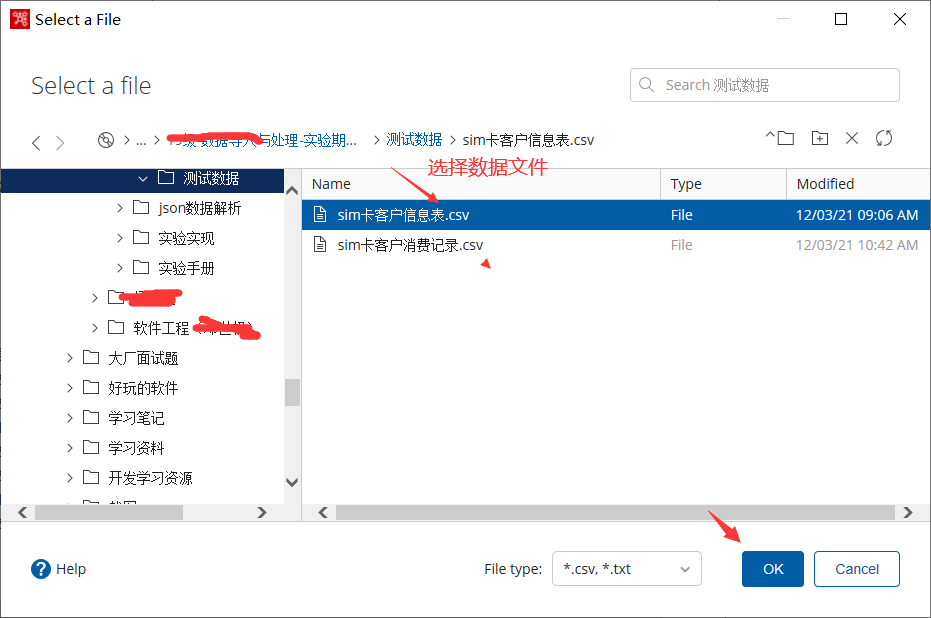
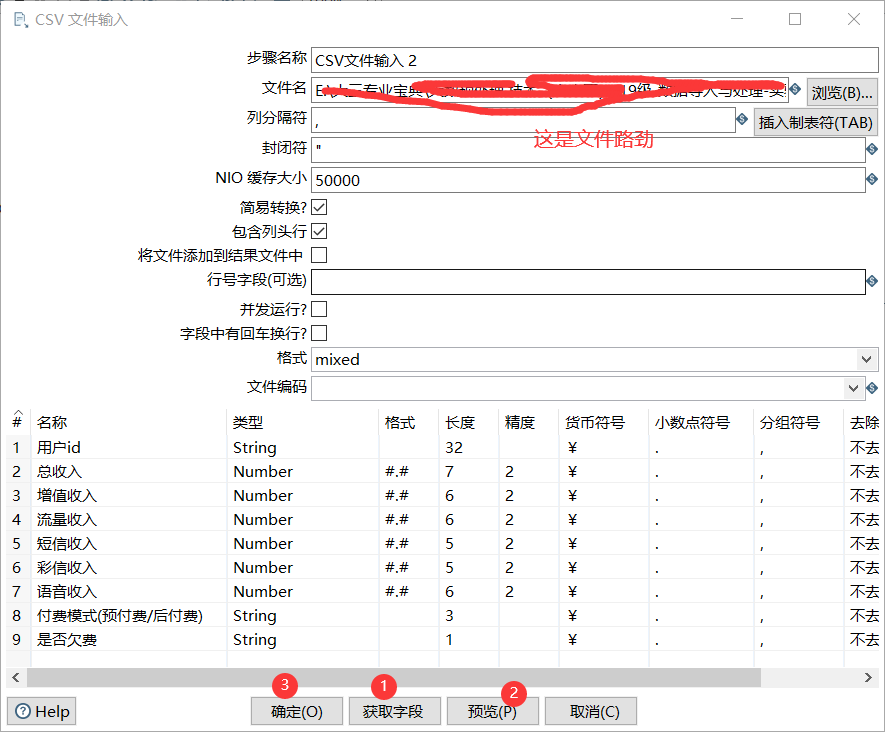
3.2 CSV file input 2 (as above, select sim card customer consumption record. csv)

3.3 sorting records
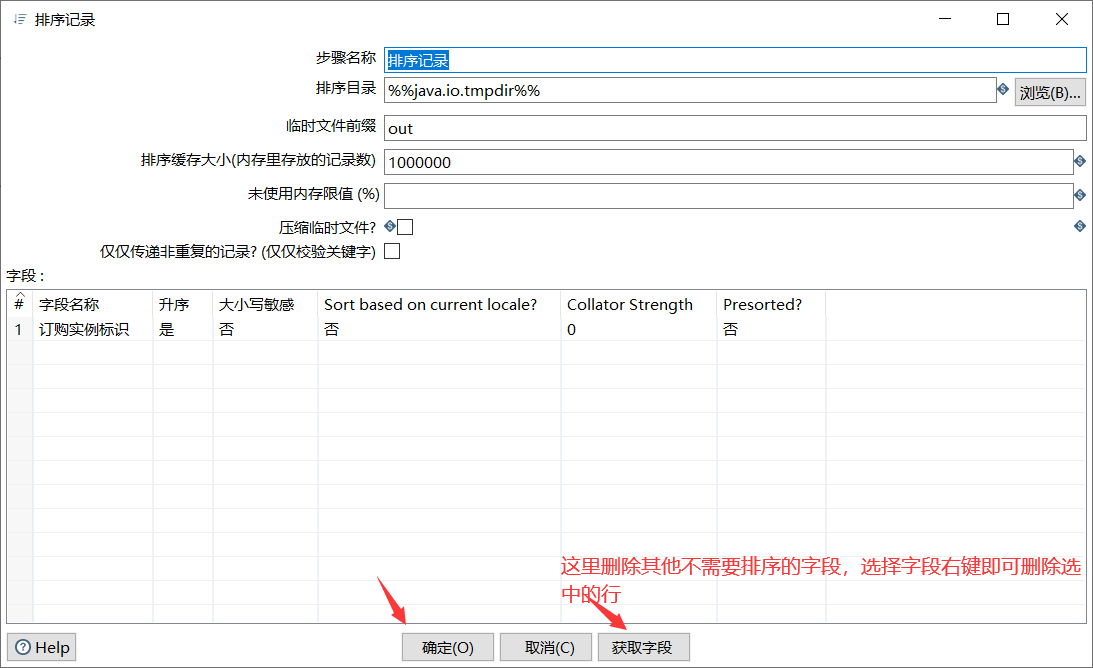
3.4 sorting records 2

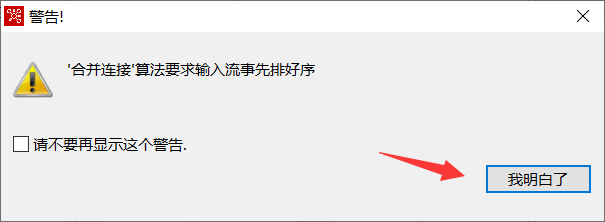
3.5 record connection 2

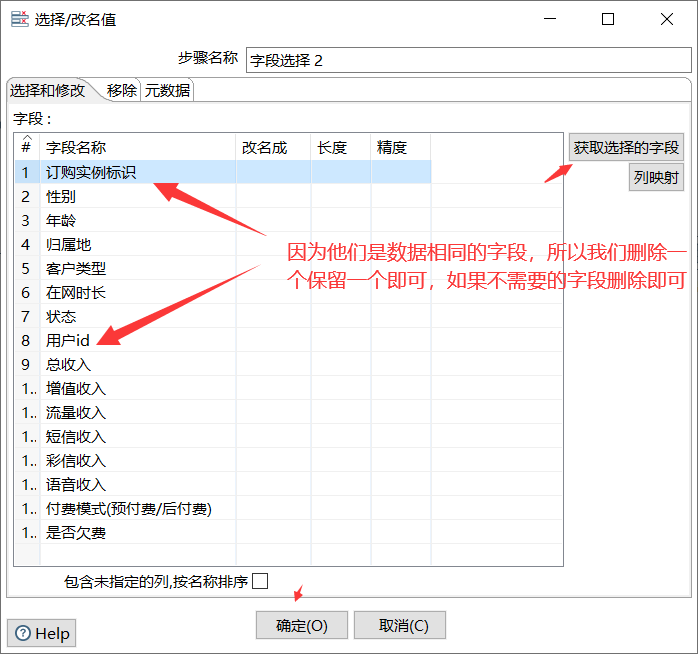
3.6 field selection

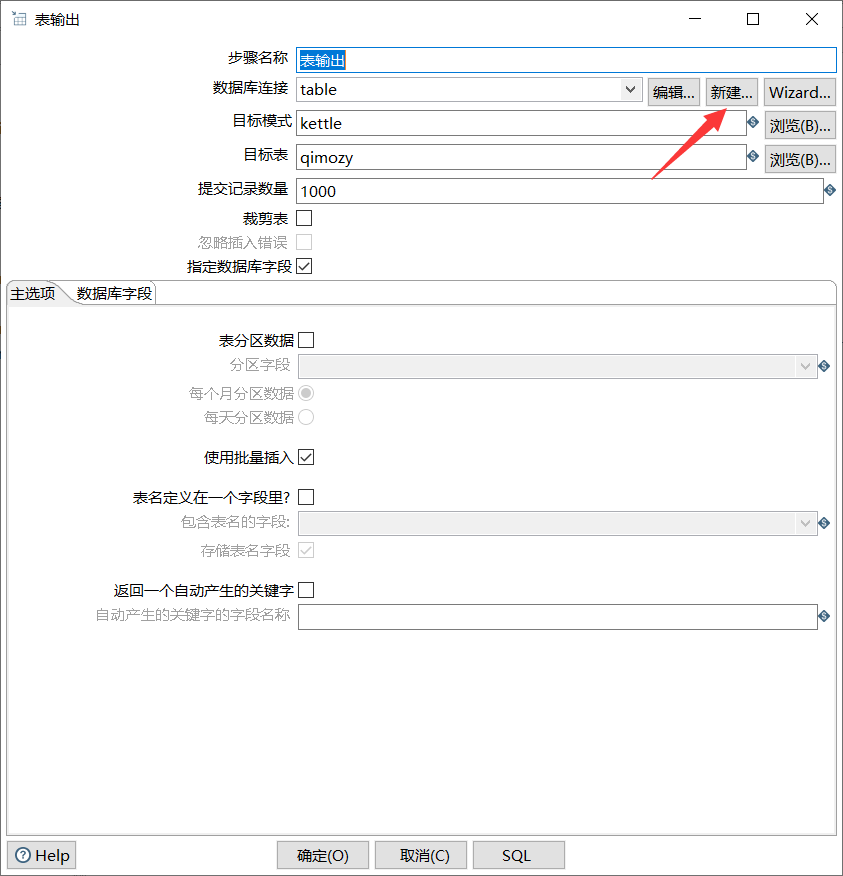
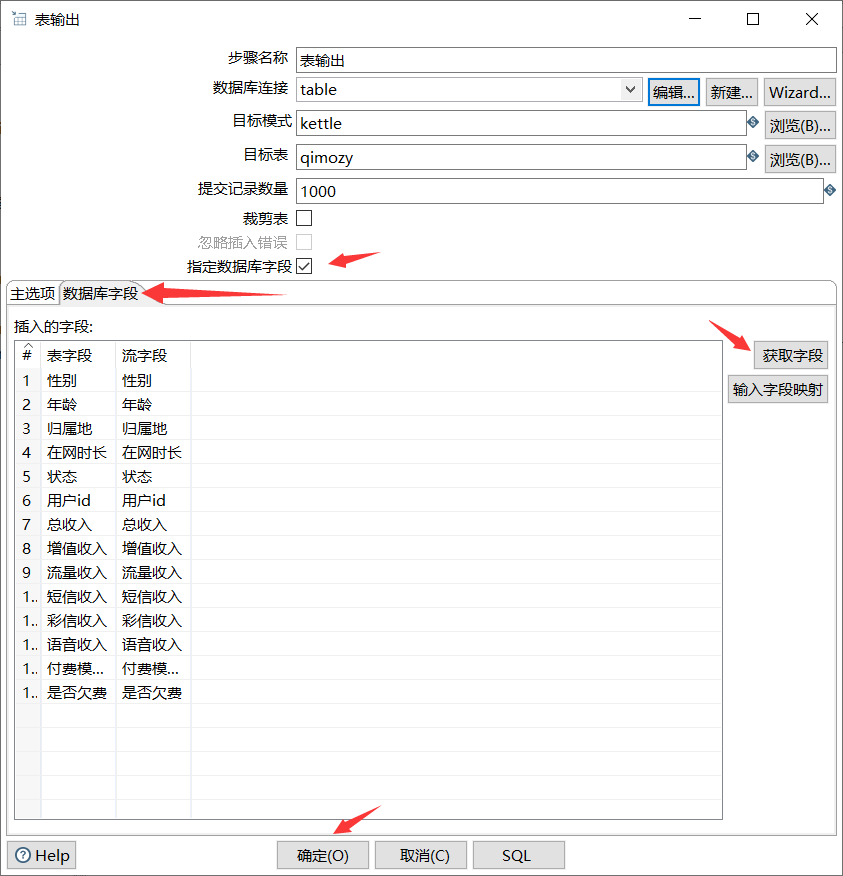
3.7 table output (I use Navicat management tool here, and other methods are the same)
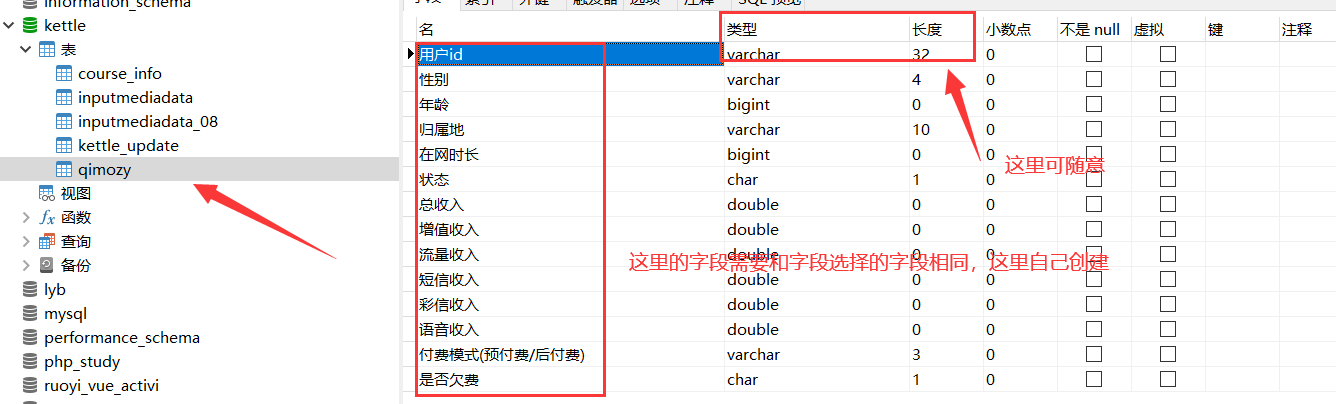
3.7. 1. Create a kettle database and qimozy table
Give me an sql!
Just run it directly
DROP TABLE IF EXISTS `qimozy`;
CREATE TABLE `qimozy`  (
  `user id` varchar(32) CHARACTER SET utf8mb4 COLLATE utf8mb4_0900_ai_ci NULL DEFAULT NULL,
  `Gender` varchar(4) CHARACTER SET utf8mb4 COLLATE utf8mb4_0900_ai_ci NULL DEFAULT NULL,
  `Age` bigint(0) NULL DEFAULT NULL,
  `Place of ownership` varchar(10) CHARACTER SET utf8mb4 COLLATE utf8mb4_0900_ai_ci NULL DEFAULT NULL,
  `On line time` bigint(0) NULL DEFAULT NULL,
  `state` char(1) CHARACTER SET utf8mb4 COLLATE utf8mb4_0900_ai_ci NULL DEFAULT NULL,
  `Total revenue` double NULL DEFAULT NULL,
  `Value added income` double NULL DEFAULT NULL,
  `Flow revenue` double NULL DEFAULT NULL,
  `SMS revenue` double NULL DEFAULT NULL,
  `MMS revenue` double NULL DEFAULT NULL,
  `Voice revenue` double NULL DEFAULT NULL,
  `Payment mode(Prepayment/postpaid )` varchar(3) CHARACTER SET utf8mb4 COLLATE utf8mb4_0900_ai_ci NULL DEFAULT NULL,
  `Is it in arrears` char(1) CHARACTER SET utf8mb4 COLLATE utf8mb4_0900_ai_ci NULL DEFAULT NULL
) ENGINE = InnoDB CHARACTER SET = utf8mb4 COLLATE = utf8mb4_0900_ai_ci ROW_FORMAT = Dynamic;

SET FOREIGN_KEY_CHECKS = 1;
3.7. 2 return to configuration table output
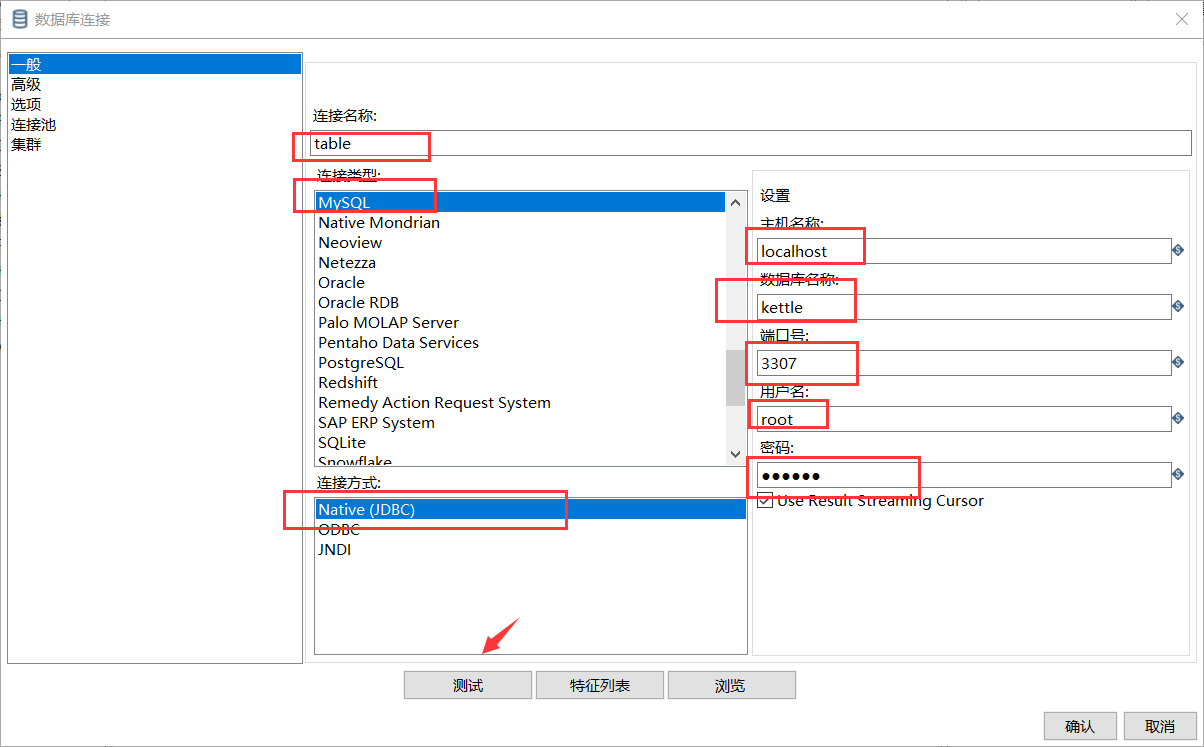

Note: if you cannot connect here, you may not have a mysql driver. Copy the mysql driver to the lib directory of kettle and restart kettle to connect
Driver download:
Link: https://pan.baidu.com/s/1hYHRXuOu1bEA5fnLbZ9rBw
Extraction code: wrvf

3.7. 3. Check whether the fields correspond
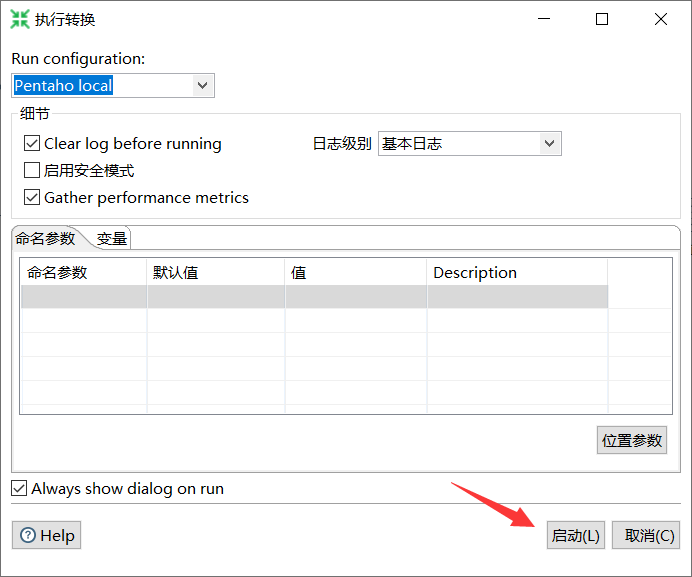
3.8 operation


Click Preview data to view the data of each step
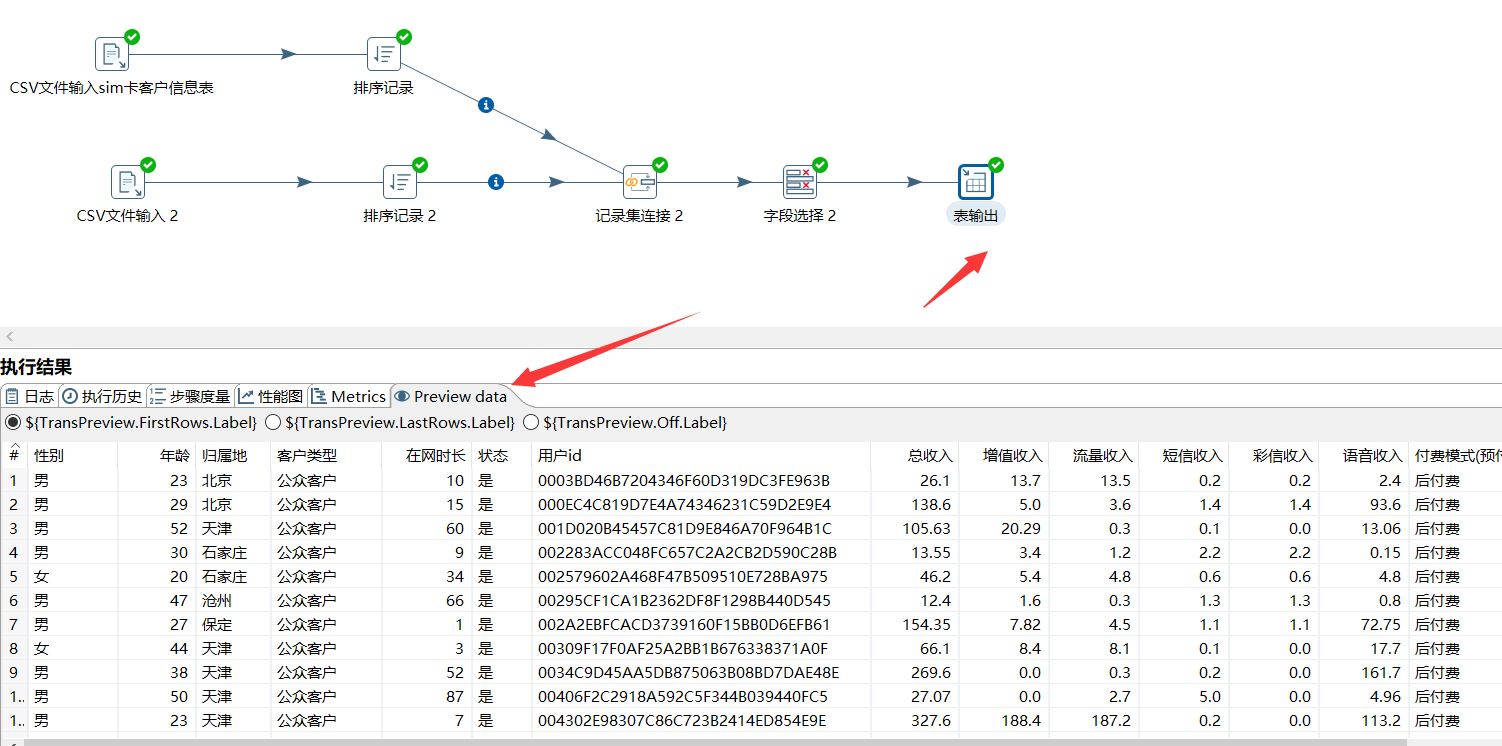
You can see that our data has been imported into the mysql database

Manipulation database
Attach sql statement
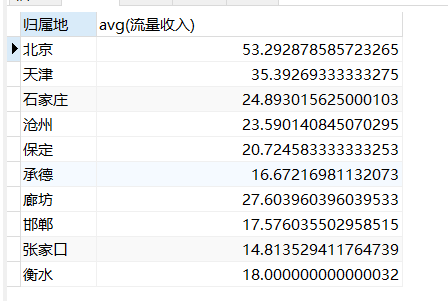
Pie chart required
select Place of ownership,avg(Flow revenue) from qimozy group by Place of ownership
Required for histogram
SELECT CASE
            WHEN Age<=10 THEN 'A10'
            WHEN Age>= 11 AND Age<=20 THEN 'A20'
            WHEN Age>= 21 AND Age<=30 THEN 'A30'
            WHEN Age>= 31 AND Age<=40 THEN 'A40'
            WHEN Age>= 41 AND Age<=50 THEN 'A50'
            WHEN Age>= 51 AND Age<=60 THEN 'A60'
            WHEN Age>= 61 AND Age<=70 THEN 'A70'
            ELSE 'other' END AS 'age group',
            AVG(Flow revenue) AS 'Average flow',
            AVG(Voice revenue) AS 'Average speech',
            AVG(SMS revenue) AS 'Average SMS',
            AVG(MMS revenue) AS 'Average MMS'
            FROM qimozy
            GROUP BY age group
            order by age group
Python drawing
Attach all the codes directly here
import pymysql
from matplotlib import pyplot as plt
from pandas import Series,DataFrame
import numpy as np
#Add drawing objects
fig = plt.figure()
ax = fig.add_axes([0,0,1,1])
PlaceOfOwnership = [] #Home list
FlowAvg = [] #Average flow
age = [] #Age
avg_flow = [] #Average flow
avg_voice = [] #Average speech
avg_sms = [] #Average SMS
avg_mms = [] #Average MMS
try:
conn = pymysql.connect(host= '127.0.0.1',port=3307,user = "root",passwd = "123456",db="kettle",charset="utf8") #Database connection
if (conn):
print("Database connection succeeded")
cur = conn.cursor() #Pointer cursor
# sql = "select * from qimozy"
sql_grup = "select Place of ownership,avg(Flow revenue) from qimozy group by Place of ownership" #Query the average traffic of each home location
cur.execute(sql_grup) #Execute sql statement
alldata = cur.fetchall() #Receive statement
for data in alldata: #Traversal data
# print(data)
#Add data to the list
PlaceOfOwnership.append(data[0])
FlowAvg.append(int(data[1]))
#Query the average value of each age group
sql_age = "SELECT CASE \
WHEN Age<=10 THEN 'A10' \
WHEN Age>= 11 AND Age<=20 THEN 'A20' \
WHEN Age>= 21 AND Age<=30 THEN 'A30'\
WHEN Age>= 31 AND Age<=40 THEN 'A40' \
WHEN Age>= 41 AND Age<=50 THEN 'A50' \
WHEN Age>= 51 AND Age<=60 THEN 'A60' \
WHEN Age>= 61 AND Age<=70 THEN 'A70'\
ELSE 'other' END AS 'age group', \
AVG(Flow revenue) AS 'Average flow', \
AVG(Voice revenue) AS 'Average speech',\
AVG(SMS revenue) AS 'Average SMS',\
AVG(MMS revenue) AS 'Average MMS'\
FROM qimozy \
GROUP BY age group \
order by age group "
cur.execute(sql_age) #Execute statement
alldata2 = cur.fetchall() #Get value
for data2 in alldata2: #Traversal value
#Adds a value to the array
age.append(data2[0])
avg_flow.append(int(data2[1]))
avg_voice.append(int(data2[2]))
avg_sms.append(int(data2[3]))
avg_mms.append(int(data2[4]))
except Exception as e: #exception handling
print("Error"+e)
finally:
cur.close() #Close cursor
conn.close() #Close database connection
# print(PlaceOfOwnership)
# print(FlowAvg)
print(age)
print(avg_flow)
print(avg_voice)
print(avg_sms)
print(avg_mms)
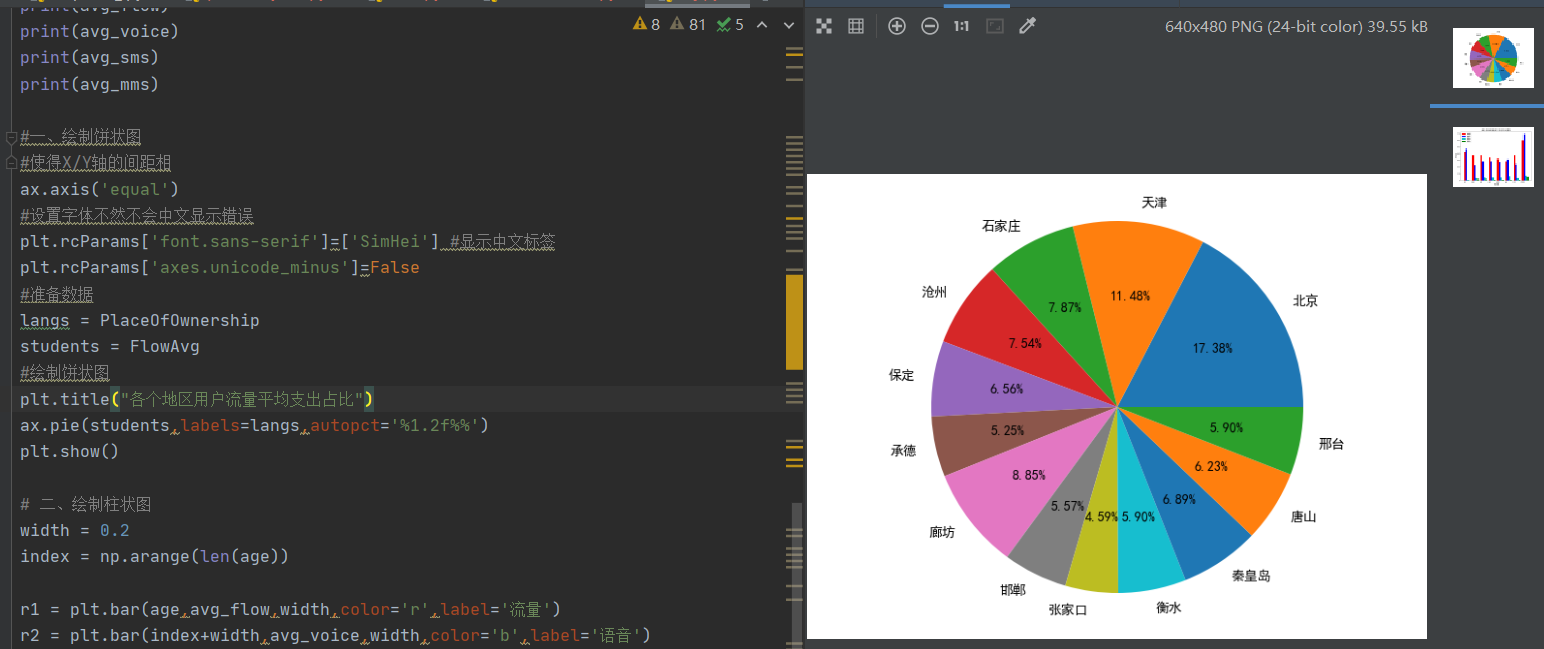
#1, Draw pie chart
#Make the spacing of X/Y axis equal
ax.axis('equal')
#Set the font, otherwise the error will not be displayed in Chinese
plt.rcParams['font.sans-serif']=['SimHei'] #Show Chinese labels
plt.rcParams['axes.unicode_minus']=False
#Prepare data
langs = PlaceOfOwnership
students = FlowAvg
#Draw pie chart
plt.title("Proportion of average user traffic expenditure in each region")
ax.pie(students,labels=langs,autopct='%1.2f%%')
plt.show()
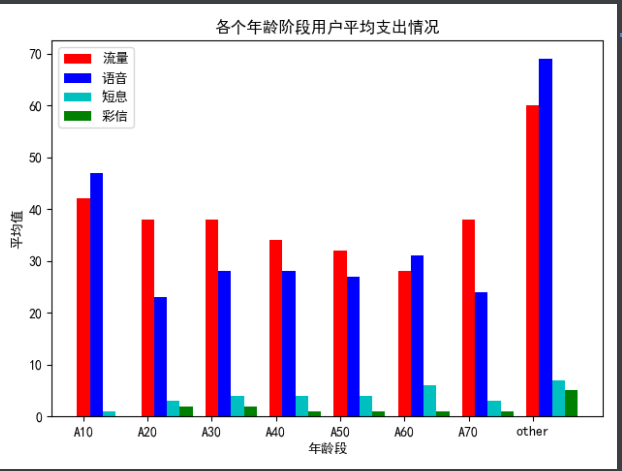
# 2, Draw histogram
width = 0.2
index = np.arange(len(age))
r1 = plt.bar(age,avg_flow,width,color='r',label='flow')
r2 = plt.bar(index+width,avg_voice,width,color='b',label='voice')
r3 = plt.bar(index+width+width,avg_sms,width,color='c',label='Short interest')
r4 = plt.bar(index+width+width+width,avg_mms,width,color='g',label='MMS')
plt.title('Average expenditure of users of all ages')
plt.xlabel('age group')
plt.ylabel('average value')
#Display image
plt.legend()
plt.show()
If the package is not installed, open the terminal and run the following command
pip install pymysql
pip install matplotlib
pip install pandas
pip install numpy
Who is not installed? If not, add Tsinghua source later
Pay more attention to your own database connection

6. Run Python code
Results obtained: