1. Phenomenon
Online k8s cluster alarms, host fd utilization rate exceeds 80%, log in and check dockerd memory usage 26G
2. Troubleshooting ideas
Because we have encountered the problem of dockerd resource leakage many times before, let's see if it is caused by known reasons. Refer to the previous two articles
3. Who is the opposite end of FD?
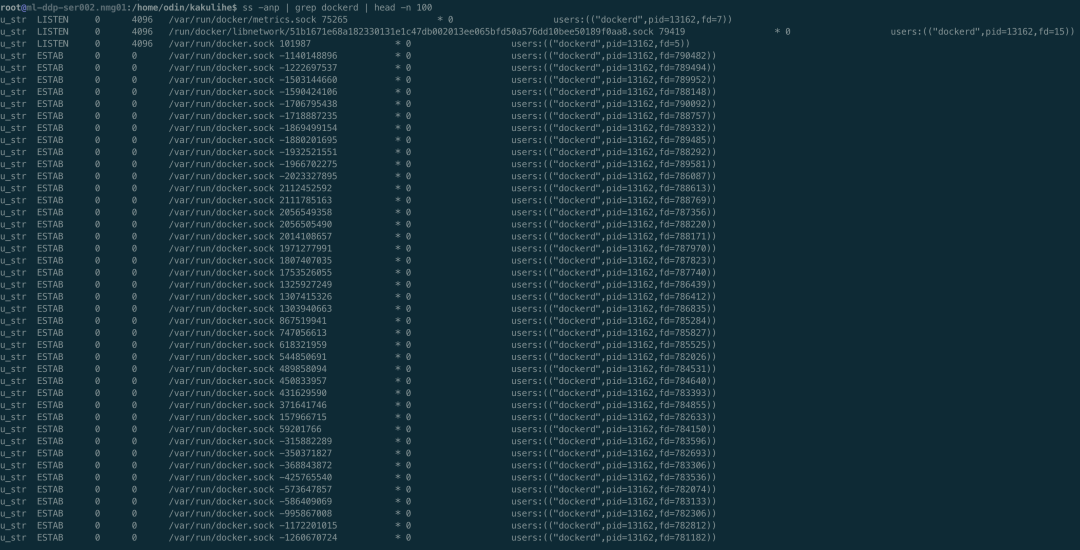
Execute ss -anp | grep dockerd. The result is shown in the figure below. It can be seen that different from the problems encountered before, column 8 is displayed as 0, which is inconsistent with the situation encountered before, and the opposite end cannot be found.
4. Why is the memory leaking?
In order to analyze the location of memory leaks using pprof, first open the debug mode for dockerd. You need to modify the service file and add the following two sentences
ExecReload=/bin/kill -s HUP $MAINPID
KillMode=process
At the same time, in / etc / docker / daemon Add "debug" to the JSON file: the configuration of true. After modification, execute systemctl daemon reload to reload the docker service configuration, then execute systemctl reload docker, reload the docker configuration, and turn on the debug mode
Docker D uses uds to provide no service by default. In order to facilitate our debugging, we can use socat to forward the port of docker, as follows: sudo socat - D - D tcp-list: 8080, fork, bind = 0.0 0.0 UNIX:/var/run/docker. Sock means that the external can call the docker api by accessing the 8080 port of the host. So far, everything is ready
Execute go tool pprof locally http://ip:8080/debug/pprof/heap Check the memory usage, as shown in the following figure
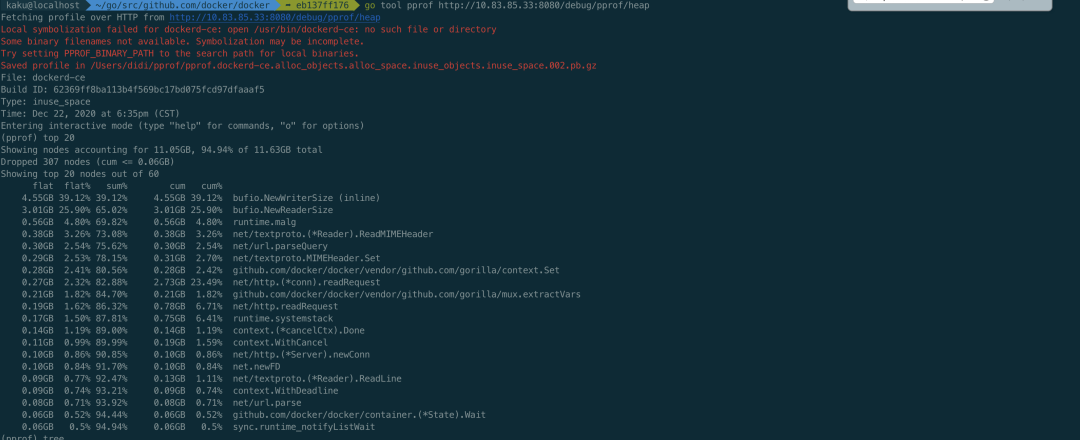
You can see that the occupied places are at the bufio NewWriterSize and NewReaderSize provided by golang. They will be here every http call, and you can see what the problem is.
5. Goroutine also leaked?
Leak location
We still can't know the specific location of the problem through memory. The problem is not big. Let's look at goroutine and access it directly in the browser http://ip:8080/debug/pprof/goroutine?debug=1 , as shown below
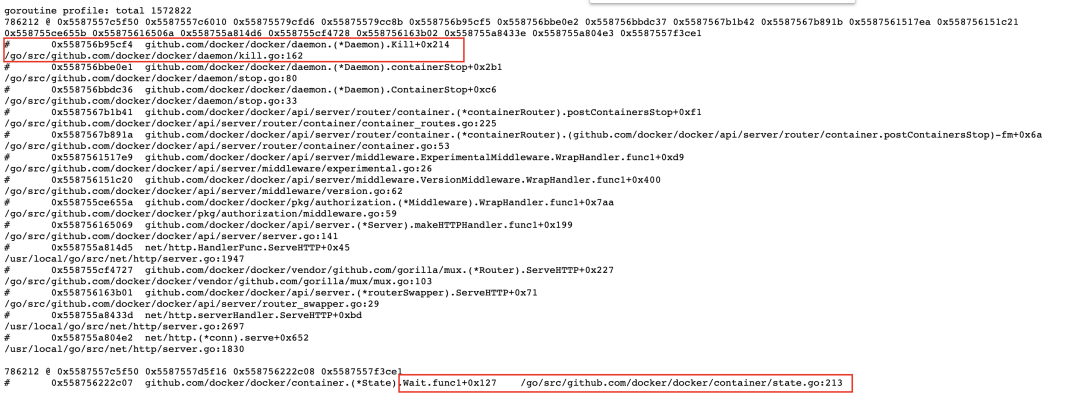
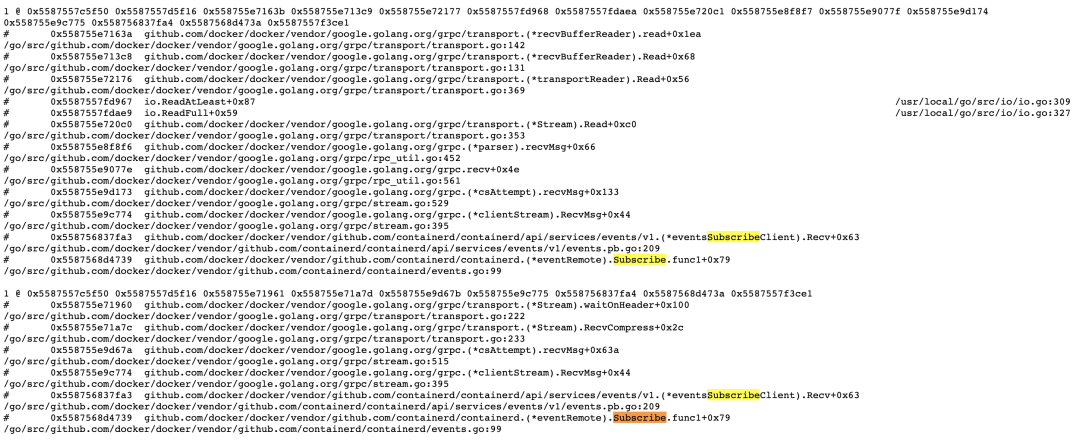
There are 1572822 goroutines in total, with two big heads accounting for half and 786212 respectively. See here, you can basically check the source code along the number of file lines. Here we use docker 18.09 2. Switch the source code to the corresponding version. You can know the reasons for the goroutine leakage of these two categories by viewing the source code. The processing flow related to docked and containerd is shown in the following figure
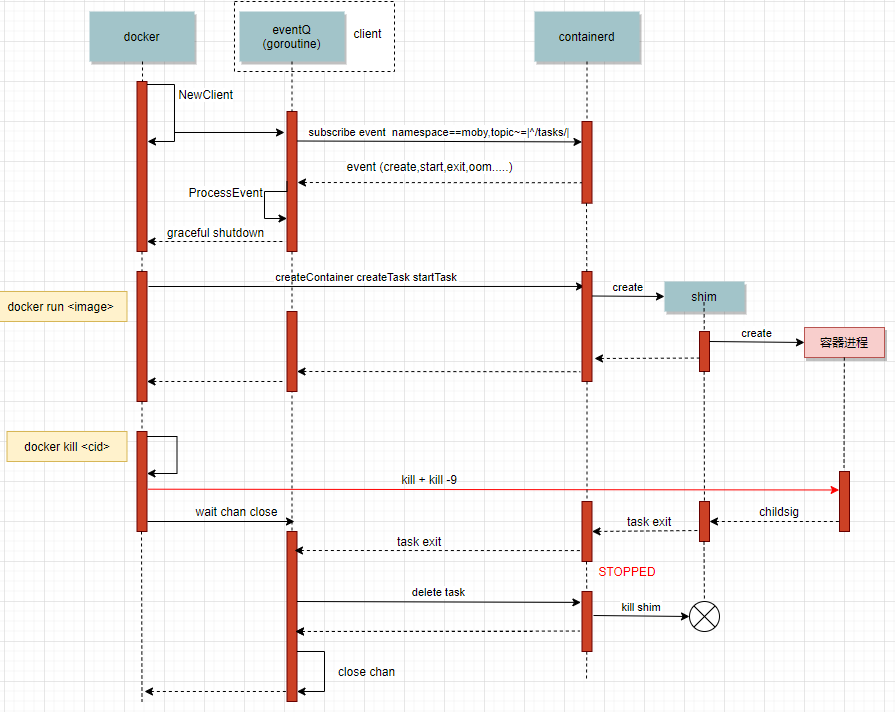
Corresponding to the above figure, the goroutine leakage is caused by the wait chan close at the last docker kill. Another goroutine will be started during the wait. Each docker kill will cause the leakage of these two goroutines. The corresponding codes are as follows
// Kill forcefully terminates a container.
func (daemon *Daemon) Kill(container *containerpkg.Container) error {
   if !container.IsRunning() {
      return errNotRunning(container.ID)
   }

   // 1. Send SIGKILL
   if err := daemon.killPossiblyDeadProcess(container, int(syscall.SIGKILL)); err != nil {
      // While normally we might "return err" here we're not going to
      // because if we can't stop the container by this point then
      // it's probably because it's already stopped. Meaning, between
      // the time of the IsRunning() call above and now it stopped.
      // Also, since the err return will be environment specific we can't
      // look for any particular (common) error that would indicate
      // that the process is already dead vs something else going wrong.
      // So, instead we'll give it up to 2 more seconds to complete and if
      // by that time the container is still running, then the error
      // we got is probably valid and so we return it to the caller.
      if isErrNoSuchProcess(err) {
         return nil
      }

      ctx, cancel := context.WithTimeout(context.Background(), 2*time.Second)
      defer cancel()

      if status := <-container.Wait(ctx, containerpkg.WaitConditionNotRunning); status.Err() != nil {
         return err
      }
   }

   // 2. Wait for the process to die, in last resort, try to kill the process directly
   if err := killProcessDirectly(container); err != nil {
      if isErrNoSuchProcess(err) {
         return nil
      }
      return err
   }

   // Wait for exit with no timeout.
   // Ignore returned status.
   <-container.Wait(context.Background(), containerpkg.WaitConditionNotRunning)

   return nil
}

// Wait waits until the container is in a certain state indicated by the given
// condition. A context must be used for cancelling the request, controlling
// timeouts, and avoiding goroutine leaks. Wait must be called without holding
// the state lock. Returns a channel from which the caller will receive the
// result. If the container exited on its own, the result's Err() method will
// be nil and its ExitCode() method will return the container's exit code,
// otherwise, the results Err() method will return an error indicating why the
// wait operation failed.
func (s *State) Wait(ctx context.Context, condition WaitCondition) <-chan StateStatus {
   s.Lock()
   defer s.Unlock()

   if condition == WaitConditionNotRunning && !s.Running {
      // Buffer so we can put it in the channel now.
      resultC := make(chan StateStatus, 1)

      // Send the current status.
      resultC <- StateStatus{
         exitCode: s.ExitCode(),
         err:      s.Err(),
      }

      return resultC
   }

   // If we are waiting only for removal, the waitStop channel should
   // remain nil and block forever.
   var waitStop chan struct{}
   if condition < WaitConditionRemoved {
      waitStop = s.waitStop
   }

   // Always wait for removal, just in case the container gets removed
   // while it is still in a "created" state, in which case it is never
   // actually stopped.
   waitRemove := s.waitRemove

   resultC := make(chan StateStatus)

   go func() {
      select {
      case <-ctx.Done():
         // Context timeout or cancellation.
         resultC <- StateStatus{
            exitCode: -1,
            err:      ctx.Err(),
         }
         return
      case <-waitStop:
      case <-waitRemove:
      }

      s.Lock()
      result := StateStatus{
         exitCode: s.ExitCode(),
         err:      s.Err(),
      }
      s.Unlock()

      resultC <- result
   }()

   return resultC
}
According to the goroutine picture, the two goroutines went to Kill's last container At the Wait and the select of the Wait, because the select of the Wait method does not return, there is no data in resultC, so it is impossible to get data from the container Data is read from the chan returned by Wait, which causes two goroutines to be blocked each time docker stop calls.
Why leak?
Why does select never return? You can see that select is waiting for three Chans, and any one with data or closed will be returned
- ctx.Done(): no return because the last time Wait was called, context was passed in Background(). In fact, this is also the way dockerd handles requests. Since the client wants to delete the container, I will Wait for the container to be deleted. When to delete it and when to exit. As long as the container is not deleted, there will always be a goroutine waiting.
- waitStop and waitRemove: the reason for not returning is that the signal of task exit sent by containerd is not received. You can compare it with the above figure. chan will not be closed until task exit is received.
Why didn't you receive the task exit event?
The problem is gradually clear, but further investigation is needed to find out why the task exit event is not received. There are two possibilities
- Send but receive: the first thing I think of here is a problem encountered by Tencent. On the 18 version of docker, the goroutine of processEvent exited abnormally, resulting in failure to receive the signal sent by containerd. Refer to here [1]
- Not issued
First, check whether you have received it or the content of goroutine. As shown in the figure below, you can see that both goroutine:processEventStream for processing events and goroutine:Subscribe for receiving events exist. The first possibility can be ruled out
Then look at the second possibility. The task exit event is not issued at all. Through the above analysis, it is known that goroutine leakage is caused by docker stop, so it is certain that kubelet initiated the request to delete the container and is trying all the time, otherwise it will not be leaked all the time. The only problem left is to find out which container is constantly deleted and why it can't be deleted. In fact, at this time, smart people may have thought that there is probably a D process in the container. Even if you send a Kill signal, the container process cannot exit normally. The next step is to verify this conjecture. First, find out which container has the problem. First, look at the kubelet log and docker log, as follows
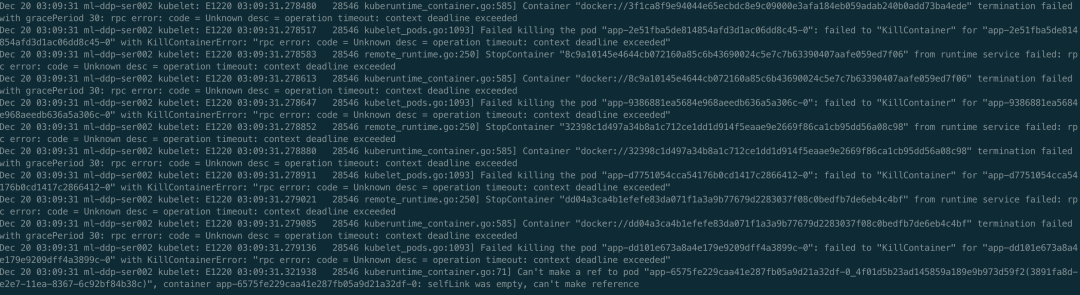
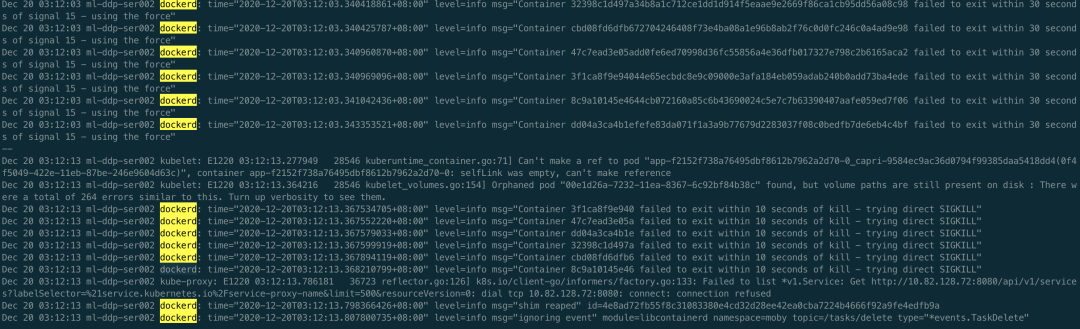
Good guy, more than one container can't be deleted. It is verified that the container is constantly deleted, but it cannot be deleted. Next, let's see if there is a D process, as follows
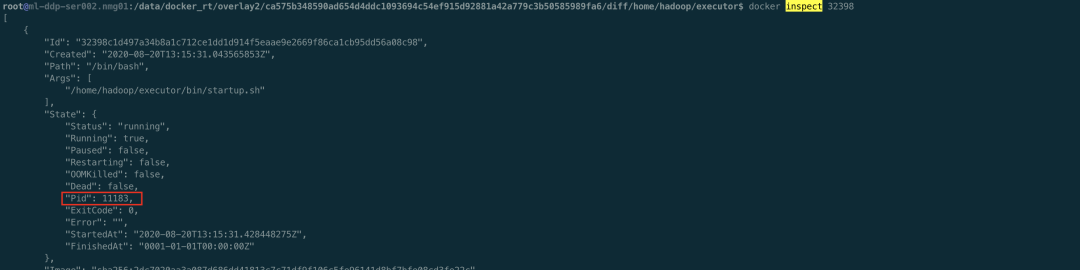


Indeed, there are D processes in the container. You can look at the host. ps aux | awk '$8 = "d"', there are a lot of D processes.
summary
In order to ensure the final consistency, Kubelet will constantly try to delete containers that should not exist on the host. Every time it is deleted, it will call the docker stop api and establish a uds connection with dockerd. When dockerd deletes a container, it will start a goroutine, call containerd in the form of rpc to delete the container and wait until the final deletion is completed, During the waiting process, another goroutine will be created to obtain the results. However, when containerd calls runc to actually perform the deletion, because the D process in the container cannot delete the container, the task exit signal is not sent, and the two related goroutines of dockerd will not exit. The whole process repeats continuously, which eventually leads to the leakage of fd, memory and goroutine step by step, and the system gradually becomes unavailable.
Looking back, kubelet has no problem with its own processing. Kubelet is to ensure consistency. It is necessary to delete containers that should not exist until the containers are completely deleted. Timeout is set every time the docker api is called. The logic of dockerd needs to be discussed. At least some improvements can be made, because the client requests with timeout, and the dockerd backend will do the container remove operation after receiving the task exit event, even if there is no docker stop request at present. So you can consider passing the last into context The Wait function call of background () is removed, and the current Wait with timeout can be returned and exit directly, so as not to cause resource leakage.