It's not difficult to grab public data from Wikipedia, Baidu Encyclopedia and other websites in Python and store them in tables. However, in many application scenarios, we are no longer limited to storing the captured data in tables, but also need to be more intuitive to visualize. For example, in this case, Python is used to capture the cities hosting the previous winter Olympics from Wikipedia, and then make maps, galleries, and even flexible sharing and cooperation. To achieve these, if you grab data and then use Python to do web pages for visualization and sharing, it will be more complex and inefficient, which limits the play of many non professionals. And if combined SeaTable It will be very convenient to implement the form, and anyone can start it. As a new online collaborative table and information management tool, it can not only conveniently manage various types of data, but also provide rich data visualization functions, as well as perfect Python API functions.
This article will share how to use Python to grab city data from Wikipedia, and then automatically fill it into the SeaTable table table, and use the visualization plug-in of SeaTable table table to automatically generate maps, galleries, etc. The following figure is the basic table of the host city of the Winter Olympic Games.
Task objective: through the Wikipedia link of each city, find the corresponding geographical location (longitude and latitude) of the city and fill it in the "longitude and latitude" field. At the same time, download a promotional picture of the city in Wikipedia and upload it to the "City picture" field.
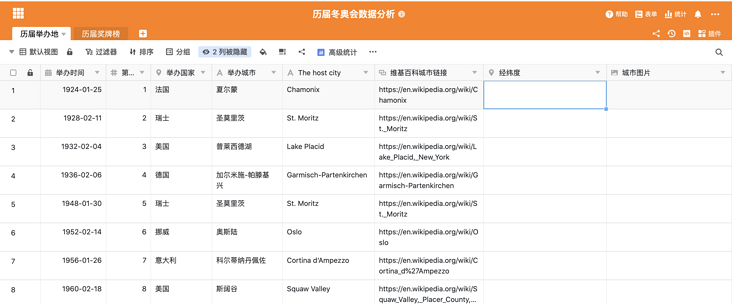
Automatically obtain the city longitude and latitude to the "longitude and latitude" field of the table
Getting information from web pages requires some simple Python crawler technology. The task is implemented by the python modules of requests and beatifulsoup. The requests module can simulate the online request and return a DOM tree of html. Beatifulsoup obtains the desired information in the tag by parsing the DOM tree. Taking the longitude and latitude of a city in Wikipedia as an example, the structure of the DOM tree is as follows:
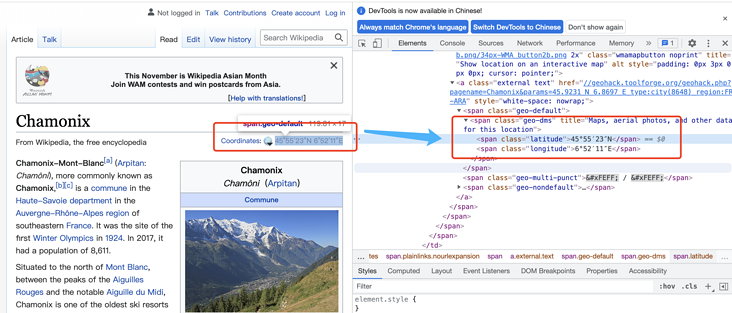
As long as the information can be seen in the web page, its location can be queried through the source code of the DOM tree, and the desired content can be extracted through simple parsing. For specific analysis methods, please refer to beautifulsoup file.
The following is a code to parse the longitude and latitude information through the url:
import requests
from bs4 import BeautifulSoup
url = "https://en.wikipedia.org/wiki/Chamonix "# Wikipedia City Link
# Request the link to get its content. The web page content is a DOM tree
resp = requests.get(url)
# Load the obtained content into the beatifulsoup parser for parsing
soup = BeautifulSoup(resp.content)

# Latitude, find the structure whose DOM attribute class is longitude, and get its label value
lon = soup.find_all(attrs={"class": "longitude"})[0].string
# Longitude, find the structure whose DOM attribute class is latitude, and obtain its label value
lat = soup.find_all(attrs={"class": "latitude"})[0].string
The format of longitude and latitude found above is a standard geographic format, such as 45 ° 55 ′ 23.16 ″ N and 6 ° 52 ′ 10.92 ″ E. it needs to be converted into decimal format for writing when stored in SeaTable table table. Here, you need to write a conversion logic for conversion.
Automatically get the city picture to the "City picture" field of the table
In this task, in addition to knowing the longitude and latitude information, you also need to download a picture and transfer it to the table. Similarly, the picture is the same as longitude and latitude, and its original information can be found in the DOM tree:

The src value of img tag is the download link we need. Combined with the file operation of SeaTable API, we can easily download the image and upload it to the table. The following is the complete code of the task:
import requests
from bs4 import BeautifulSoup
import re
from seatable_api import Base, context
import os
import time
'''
The script demonstrates how to extract, parse and fill in the relevant contents from the urban data of Wikipedia holding the Winter Olympic Games seatable Cases in table
 The data includes the longitude and latitude of geographical location and representative pictures
'''
SERVER_URL = context.server_url or 'https://cloud.seatable.cn/'
API_TOKEN  = context.api_token  or 'cacc42497886e4d0aa8ac0531bdcccb1c93bd0f5'
TABLE_NAME = "Previous venues"
URL_COL_NAME = "Wikipedia City Link"
CITY_COL_NAME = "host city"
POSITION_COL_NAME = "Longitude and latitude"
IMAGE_COL_NAME = "City pictures"

def get_time_stamp():
    return str(int(time.time()*10000000))

class Wiki(object):

    def __init__(self, authed_base):
        self.base = authed_base
        self.soup = None

    def _convert(self, tude):
        # Convert the longitude and latitude format into decimal format to facilitate filling in the table.
        multiplier = 1 if tude[-1] in ['N', 'E'] else -1
        return multiplier * sum(float(x) / 60 ** n for n, x in enumerate(tude[:-1]))

    def _format_position(self, corninate):
        format_str_list = re.split("°|′|″", corninate)
        if len(format_str_list) == 3:
            format_str_list.insert(2, "00")
        return format_str_list

    def _get_soup(self, url):
        # Initialize DOM parser
        resp = requests.get(url)
        soup = BeautifulSoup(resp.content)
        self.soup = soup
        return soup

    def get_tu_position(self, url):
        soup = self.soup or self._get_soup(url)

        # Parse the DOM of the web page, take out the value of longitude and latitude, and return to decimal
        lon = soup.find_all(attrs={"class": "longitude"})[0].string
        lat = soup.find_all(attrs={"class": "latitude"})[0].string

        converted_lon = self._convert(self._format_position(lon))
        converted_lat = self._convert(self._format_position(lat))

        return {
            "lng": converted_lon,
            "lat": converted_lat
        }

    def get_file_download_url(self, url):
        # Parse a DOM and take out the download link of one of the images

        soup = self.soup or self._get_soup(url)
        src_image_tag = soup.find_all(attrs={"class": "infobox ib-settlement vcard"})[0].find_all('img')
        src = src_image_tag[0].attrs.get('src')
        return "https:%s" % src

    def handle(self, table_name):
        base = self.base
        for row in base.list_rows(table_name):
            try:
                url = row.get(URL_COL_NAME)
                if not url:
                    continue
                row_id = row.get("_id")
                position = self.get_tu_position(url)
                image_file_downlaod_url = self.get_file_download_url(url)
                extension = image_file_downlaod_url.split(".")[-1]

                image_name = "/tmp/wik-image-%s-%s.%s" % (row_id, get_time_stamp(), extension)
                resp_img = requests.get(image_file_downlaod_url)
                with open(image_name, 'wb') as f:
                    f.write(resp_img.content)
                info_dict = base.upload_local_file(
                    image_name,
                    name=None,
                    relative_path=None,
                    file_type='image',
                    replace=True
                )

                row_data = {
                    POSITION_COL_NAME: position,
                    IMAGE_COL_NAME: [info_dict.get('url'), ]
                }
                base.update_row(table_name, row_id, row_data)
                os.remove(image_name)
                self.soup = None
            except Exception as e:
                print("error", row.get(CITY_COL_NAME), e)

def run():
    base = Base(API_TOKEN, SERVER_URL)
    base.auth()

    wo = Wiki(base)
    wo.handle(TABLE_NAME)

if __name__ == '__main__':
    run()
The following is the table results of automatically writing data by running the script. It can be seen that the automatic operation of the script can save a lot of time, be accurate and efficient than querying on the Internet and manually filling in each row of data.
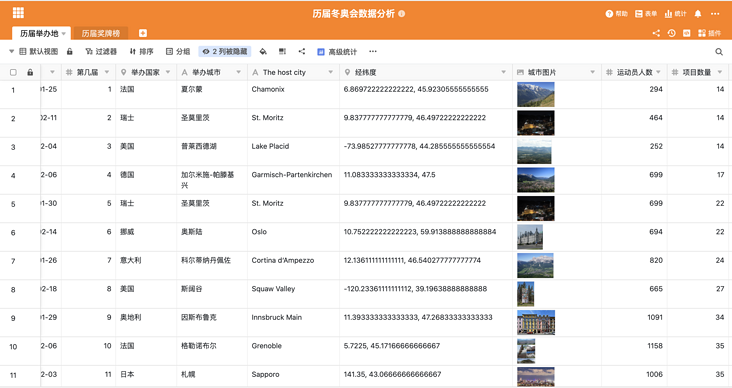
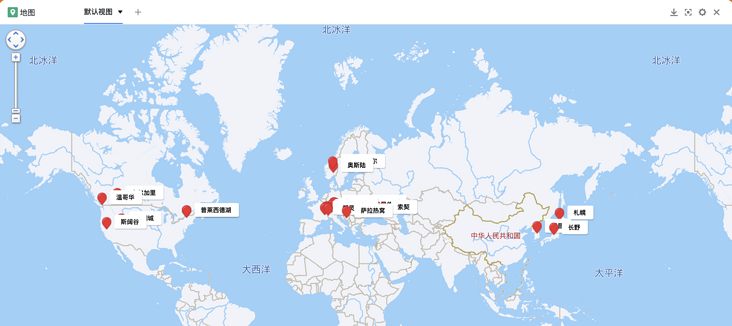
Automatically generate city map with SeaTable's map plug-in
With the city longitude and latitude information obtained earlier, we can add a map plug-in with one click from the "plug-in" column of SeaTable table table, and then simply click to automatically mark the city on the map according to the "longitude and latitude" field. It can also mark different label colors, set direct and floating display fields, etc. Compared with the monotonous view of each city in the table, the visualization through the map is obviously more vivid and intuitive.
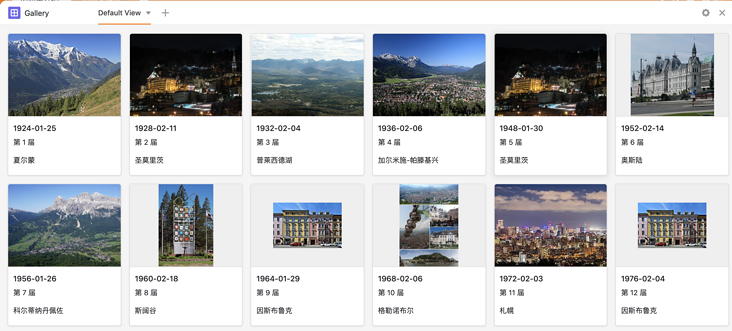
Visualizing City pictures with SeaTable's gallery plug-in
The gallery plug-in can also be placed in the table toolbar for easy opening and viewing at any time. In the settings of the gallery plug-in, you can also simply click to display the pictures in the form of the gallery according to the "City picture" field in the table, and you can also set the title name and other display fields. This is more beautiful and convenient than browsing small pictures in tables, which greatly improves the browsing experience. And click the picture to zoom in. Click the title to view and edit its row content in the table directly.
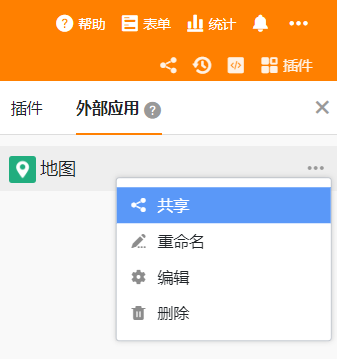
In addition, the table also supports flexible sharing and collaboration permission control, which can meet detailed and diversified sharing scenarios. For example, if you want to directly share the map and gallery for others to view, you can also directly add "map" and "Gallery" to the external application of the form plug-in. For more use, you can experience it by yourself. There is no more introduction here.
summary
As a new collaborative table and information management tool, SeaTable is not only rich in functions, but also easy to use. Usually, when we use Python to implement some programs, we can flexibly combine the functions of SeaTable table table, so as to save the time and labor cost of programming, development and maintenance, and quickly and conveniently realize more interesting things and more perfect applications. It also makes the use of tools play a greater value.