I thought it might be a log problem, but there is no evidence to support it.
The trace command can monitor the time consumption of each step, and can cooperate with the conditional expression to print a detailed log when the time consumption exceeds xx ms.
Find a machine, enter a command, and then wait. When rt spikes appear again, the time-consuming distribution can be captured.

The results obtained through Arthas locate the problem of log printing. After the synchronous log is changed to asynchronous log, the problem is solved.
Scenario 3: debug? What about dynamic bytecode generation?
Previously, I encountered the problem of whether the number output during json serialization is quoted or not. At that time, various debugs and codes were found to be serialized classes generated by ASM dynamic bytecode. At this point, I gave up completely, and debug can no longer locate the problem. This problem was avoided in another way.
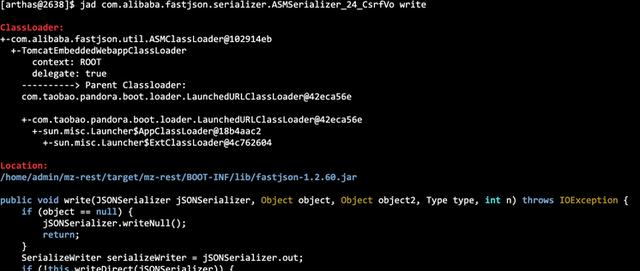
Conversely, when looking at this problem, we can decompile the classes generated by dynamic bytecode through the jad command of Arthas, and locate and troubleshoot the problem in combination with commands such as watch.
jad -- decompile the source code of the specified loaded class

You can also use MC (menu compiler) and redefine command to update the code online. Welcome to explore.
With these abilities, you can do everything? No, no, keep looking down.
Scenario 4: do something
During troubleshooting, it is found that the logs are output to the console, which has a great loss on performance. Is there any way to solve it urgently without release?
First find the corresponding class:
sc -d ch.qos.logback.core.ConsoleAppender

class-info       ch.qos.logback.core.ConsoleAppender
  code-source       /home/admin/.../lib/logback-core-1.2.3.jar
  name             ch.qos.logback.core.ConsoleAppender
  isInterface       false
  isAnnotation     false
  isEnum           false
  isAnonymousClass false
  isArray           false
  isLocalClass     false
  isMemberClass     false
  isPrimitive       false
  isSynthetic       false
  simple-name       ConsoleAppender
  modifier         public
  annotation
  interfaces
  super-class       +-ch.qos.logback.core.OutputStreamAppender
                      +-ch.qos.logback.core.UnsynchronizedAppenderBase
                        +-ch.qos.logback.core.spi.ContextAwareBase
                          +-java.lang.Object
  class-loader     +-com.taobao..LaunchedURLClassLoader@58dad04a
                      +-sun.misc.Launcher$AppClassLoader@18b4aac2
                        +-sun.misc.Launcher$ExtClassLoader@58ceff1
  classLoaderHash   5f205aa
Then get the attribute information of class and find the appender list:
ognl -c 5f205aa '@org.slf4j.LoggerFactory@getLogger("root").aai.appenderList'
To delete an appender for standard output:
1ognl -c 5f205aa '@org.slf4j.LoggerFactory@getLogger("root").aai.appenderList.remove(0)'
Finally, I share a wave of my interview classic - Java core interview question bank of first-line Internet manufacturers
Here are some of my personal practices. I hope I can provide you with some help:
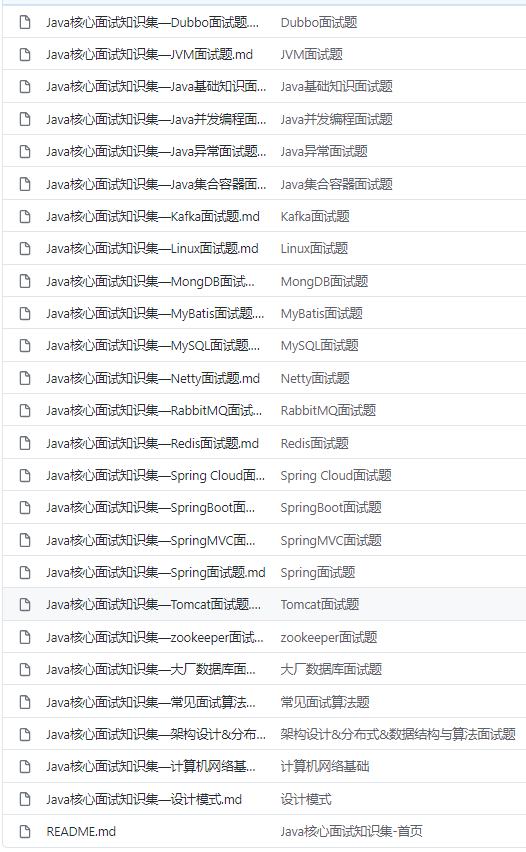
Click "Java core interview question bank of first-line Internet manufacturers" to get it for free , it has been sorted out for a long time. It is very suitable to review the interview questions, including Java foundation, exception, collection, concurrent programming, JVM, Spring family bucket, MyBatis, Redis, database, middleware MQ, Dubbo, Linux, Tomcat, ZooKeeper, Netty, etc., and will be updated continuously... star!

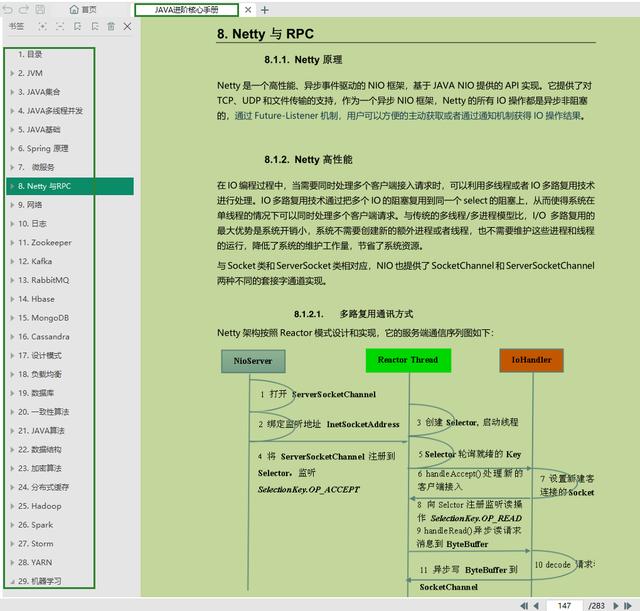
283 pages of Java advanced core pdf document
Java part: Java foundation, collection, concurrency, multithreading, JVM, design pattern
Data structure algorithm: Java algorithm, data structure
Open source framework: Spring, MyBatis, MVC, netty, tomcat
Distributed part: architecture design, Redis cache, Zookeeper, kafka, RabbitMQ, load balancing, etc
Microservices: SpringBoot, SpringCloud, Dubbo, Docker

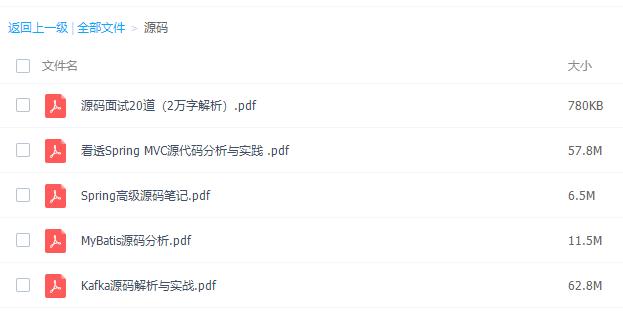
There are also source code related reading and learning

Picture transfer in progress... (img-zxans1ik-163024075075)]
There are also source code related reading and learning
[external chain picture transferring... (img-a1gnfxnq-163024075076)]