
A big event has happened recently. APIJSON doesn't have to worry about being questioned any more. Ha ha!
On a Wednesday, a project team of Tencent CSIG (which has completed phase I with APIJSON) suddenly fed back the sharp decline in the performance of querying a large amount of data:
For a 2.3KW record in a table, use APIJSON universal interface / get to check the data. It takes 10s for LIMIT 100 and 98s for LIMIT 1000!
But it startled me. How can I use it so slowly... If you think about it, you'll let them log first Debug = false turn off the log and see:
For the same table, or for the same domain , CURL request / get, the LIMIT 100 is reduced to , 2s, and the LIMIT 1000 is reduced to , 30s.
It seems that it is barely enough. Generally, it looks like checking 10 and 20 items by page, but their business "has a lot of needs for LIMIT 1000".
This is the first team and project in Tencent to use APIJSON. It not only took several months, but also wrote many articles on the intranet to help promote it,
In any case, we should not live up to their trust and expectations, let alone let this event become a stain on the poor performance of APIJSON, thus affecting the user's reputation.
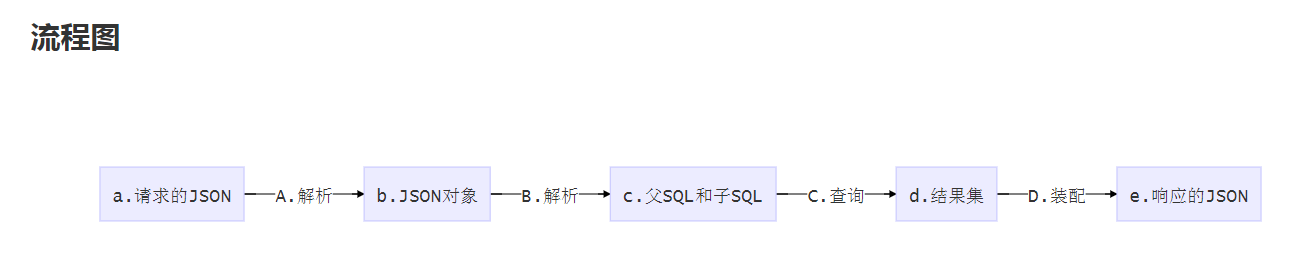
I looked at the log and thought that the main table in the array generated 1000 SQLConfig and called getSQL, which led to too long parsing time,
Except for item 0, there is no need to repeat this process for the remaining 999 records, especially during which a large number of logs are printed, which is very time-consuming.
At that time, it was to be compatible with multi table Association queries, and there was almost no requirement of more than LIMIT 100 for its own business, so it had little impact and was ignored.
Now, if you cache the parsing results (ObjectParser, SQLConfig and other classes and variable states) of the 0 data for later reuse,
Can't 2s be compressed to a small amount of time-consuming APIJSON parsing process, which is only 133ms longer than the SQL execution time?
"I have a plan. I should be able to optimize 2s to about 200ms" "I'll optimize this weekend" I patted my forehead and made a commitment.
The back-end colleagues of this group instinctively explore the details: "where is the main time of 30s now?" "What's the matter?"
"SQL 133ms takes normal time to execute, and the overall slowness is the pot of logs (big head) and parsing (small head)" "SQLExecutor should return the whole list to Parser at one time"
It seems that this colleague got some comfort: "if this can be optimized, LIMIT 1000 takes 30s, which is estimated to take only a few seconds."
Weekend except APIAuto - machine learning HTTP interface tool Simple update for:
- Zero code regression test: solve the cold start problem with empirical method, and assert when there is no verification standard
- Automatically generate comments: syntax tips for global keyword key value pairs of newly added root objects
The rest focuses on the performance optimization of APIJSON. I divided it into two steps:
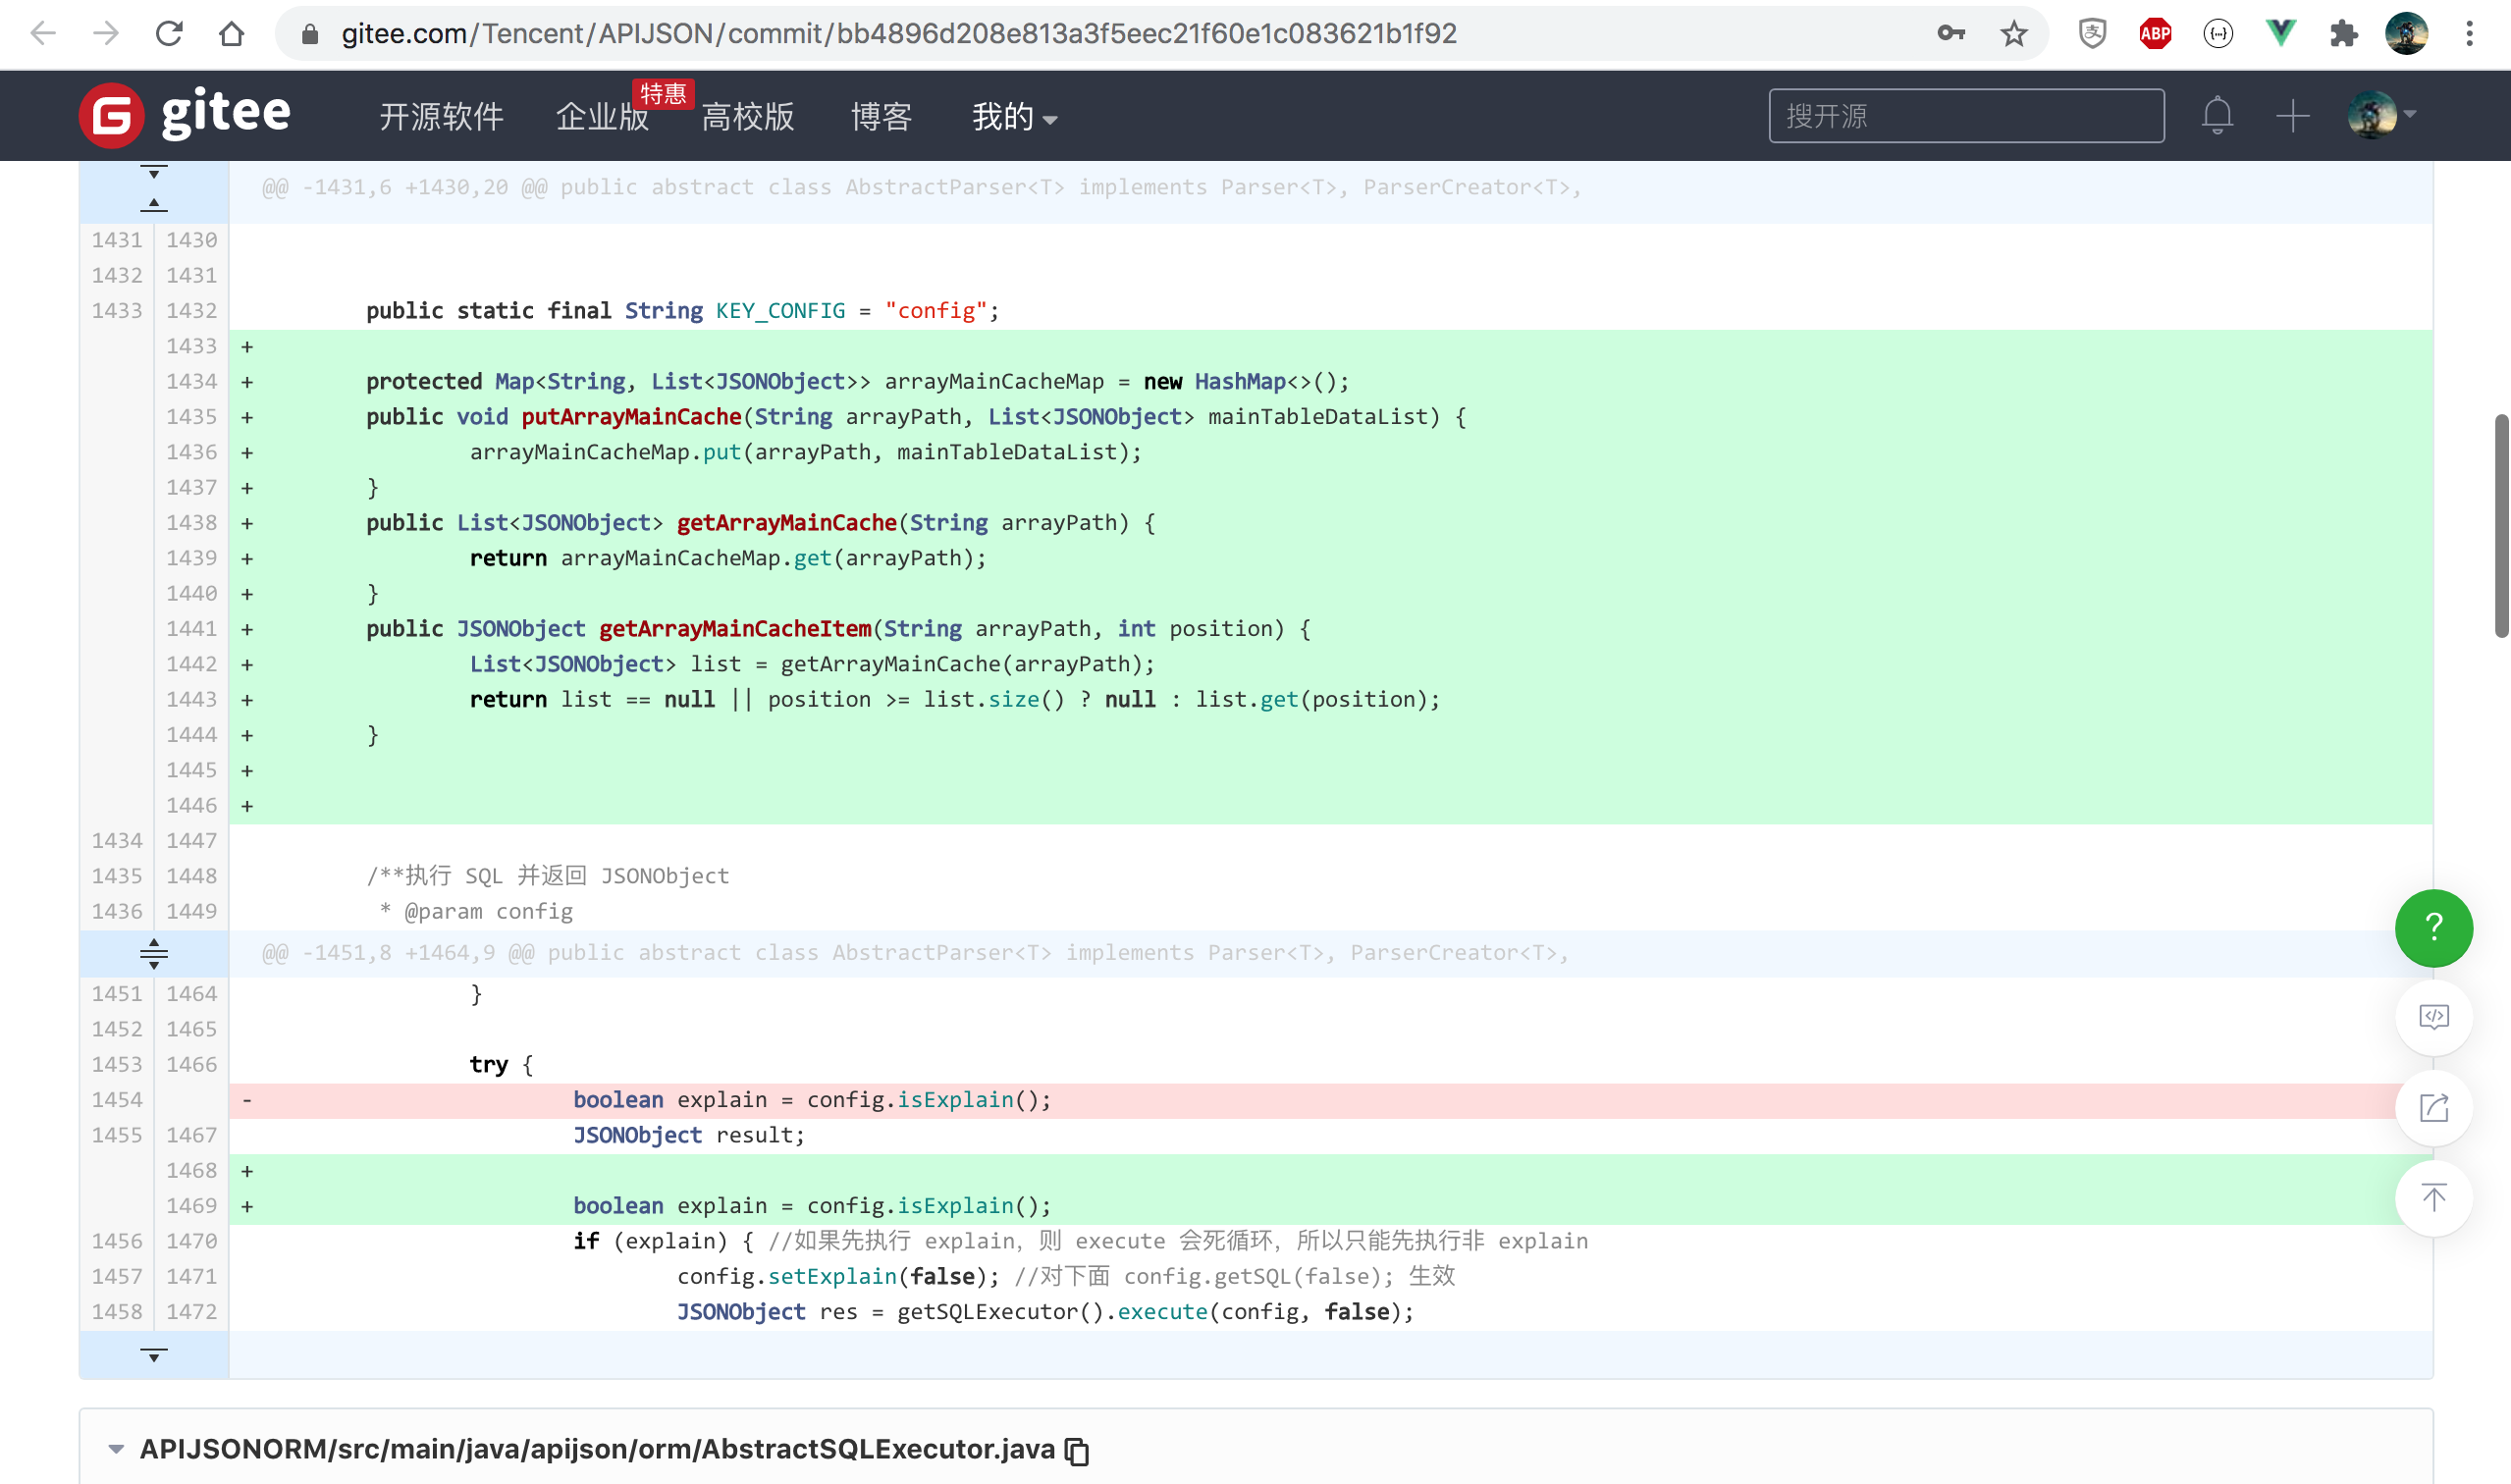
1. When querying the main table of the array, set sqlexecutor Execute returns all the original lists found and caches them in the new arraymainchachemap
https://github.com/Tencent/APIJSON/commit/bb4896d208e813a3f5eec21f60e1c083621b1f92
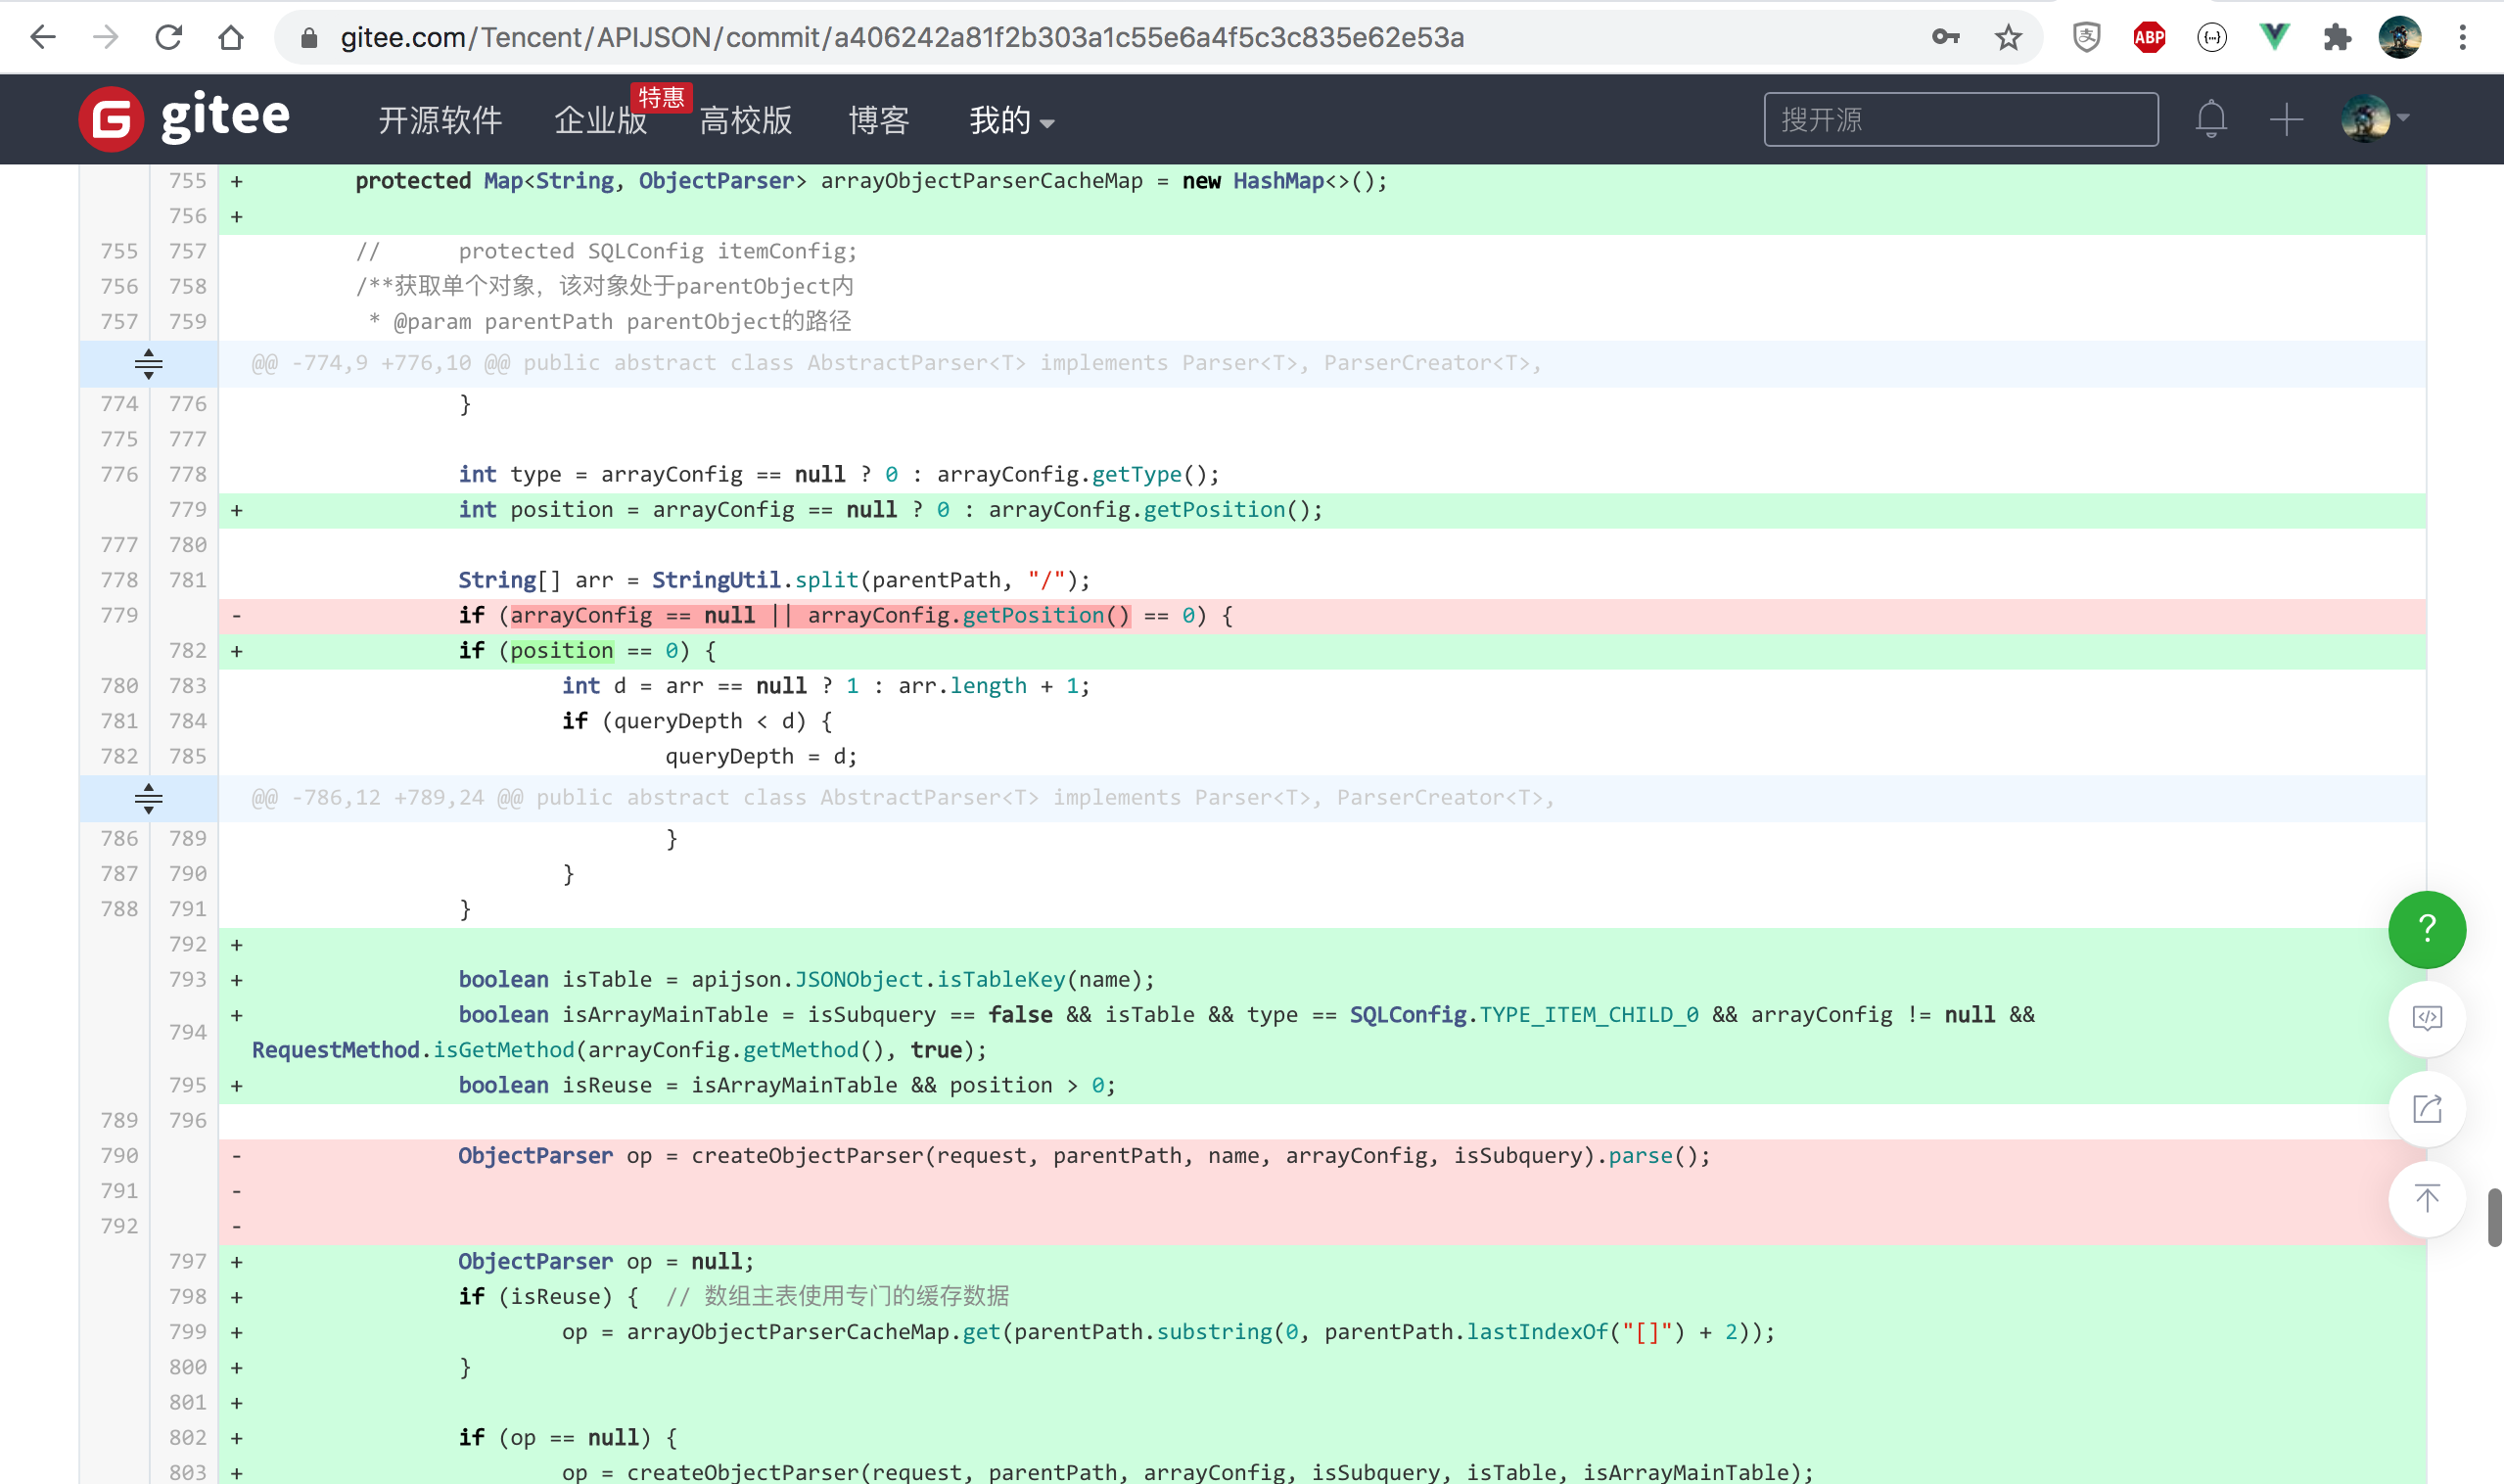
2. When querying the array main table, cache the 0th ObjectParser instance to the new arrayObjectParserCacheMap
https://github.com/Tencent/APIJSON/commit/a406242a81f2b303a1c55e6a4f5c3c835e62e53a
During this period, I tried to modify the return type JSONObject to list < JSONObject >, and found that the scope of change is too large, and only this scenario needs to be changed,
So instead, add a special field in JSONObject that is definitely not a table field@ RAW@LIST To bring the List corresponding to the ResultSet;
After the modification, the performance was greatly improved, but it was found that except item 0, all the subsequent array items lost the secondary table records, so it was finally solved after repeated debugging and modification;
Then, according to the optimization in step 2, the performance is greatly improved again, and there is no problem with manual testing. In one run regression test with APIAuto, it is found that the count field total does not return,
I was lucky this time because I had encountered the same problem before. After I solved it, I added more detailed notes, so I solved it not long after reviewing it.
After each step, I query LIMIT 100 for TestRecord [], circle of friends, multi-layer nested list, etc. more than 10 times with the code before and after optimization,
Finally, whether the minimum value is taken or the average value is taken after removing several minimum and maximum values, the performance comparison conclusions before and after are basically the same:
Step 1: reduce the time consumption of single table list to 42% and multi-layer nested list of circle of friends to 82%;
Step 2 , reduce the time consumption of single table list to 60% and multi-layer nested list of circle of friends to 77%;
It is calculated that the overall time consumption of single table list is reduced to 25% and that of multi-layer nested list of circle of friends is reduced to 63%
MacBook Pro In early 2015 13 Intel i5 Binuclear 2.9 GHz,250G SSD,OSX EI Capitan 10.11.6

Docker Community Edition 18.03.1-ce-mac65 (24312)

MySQL Community Server 5.7.17 - Run in Docker In, the performance will be much worse than that of direct installation

Eclipse Java  EE Neon.1a Release (4.6.1) - Full retention logs are better than limited retention logs IntelliJ IDEA 2018.2.8 (IU-182.5262.2) One order of magnitude slower
The measured results are as follows:
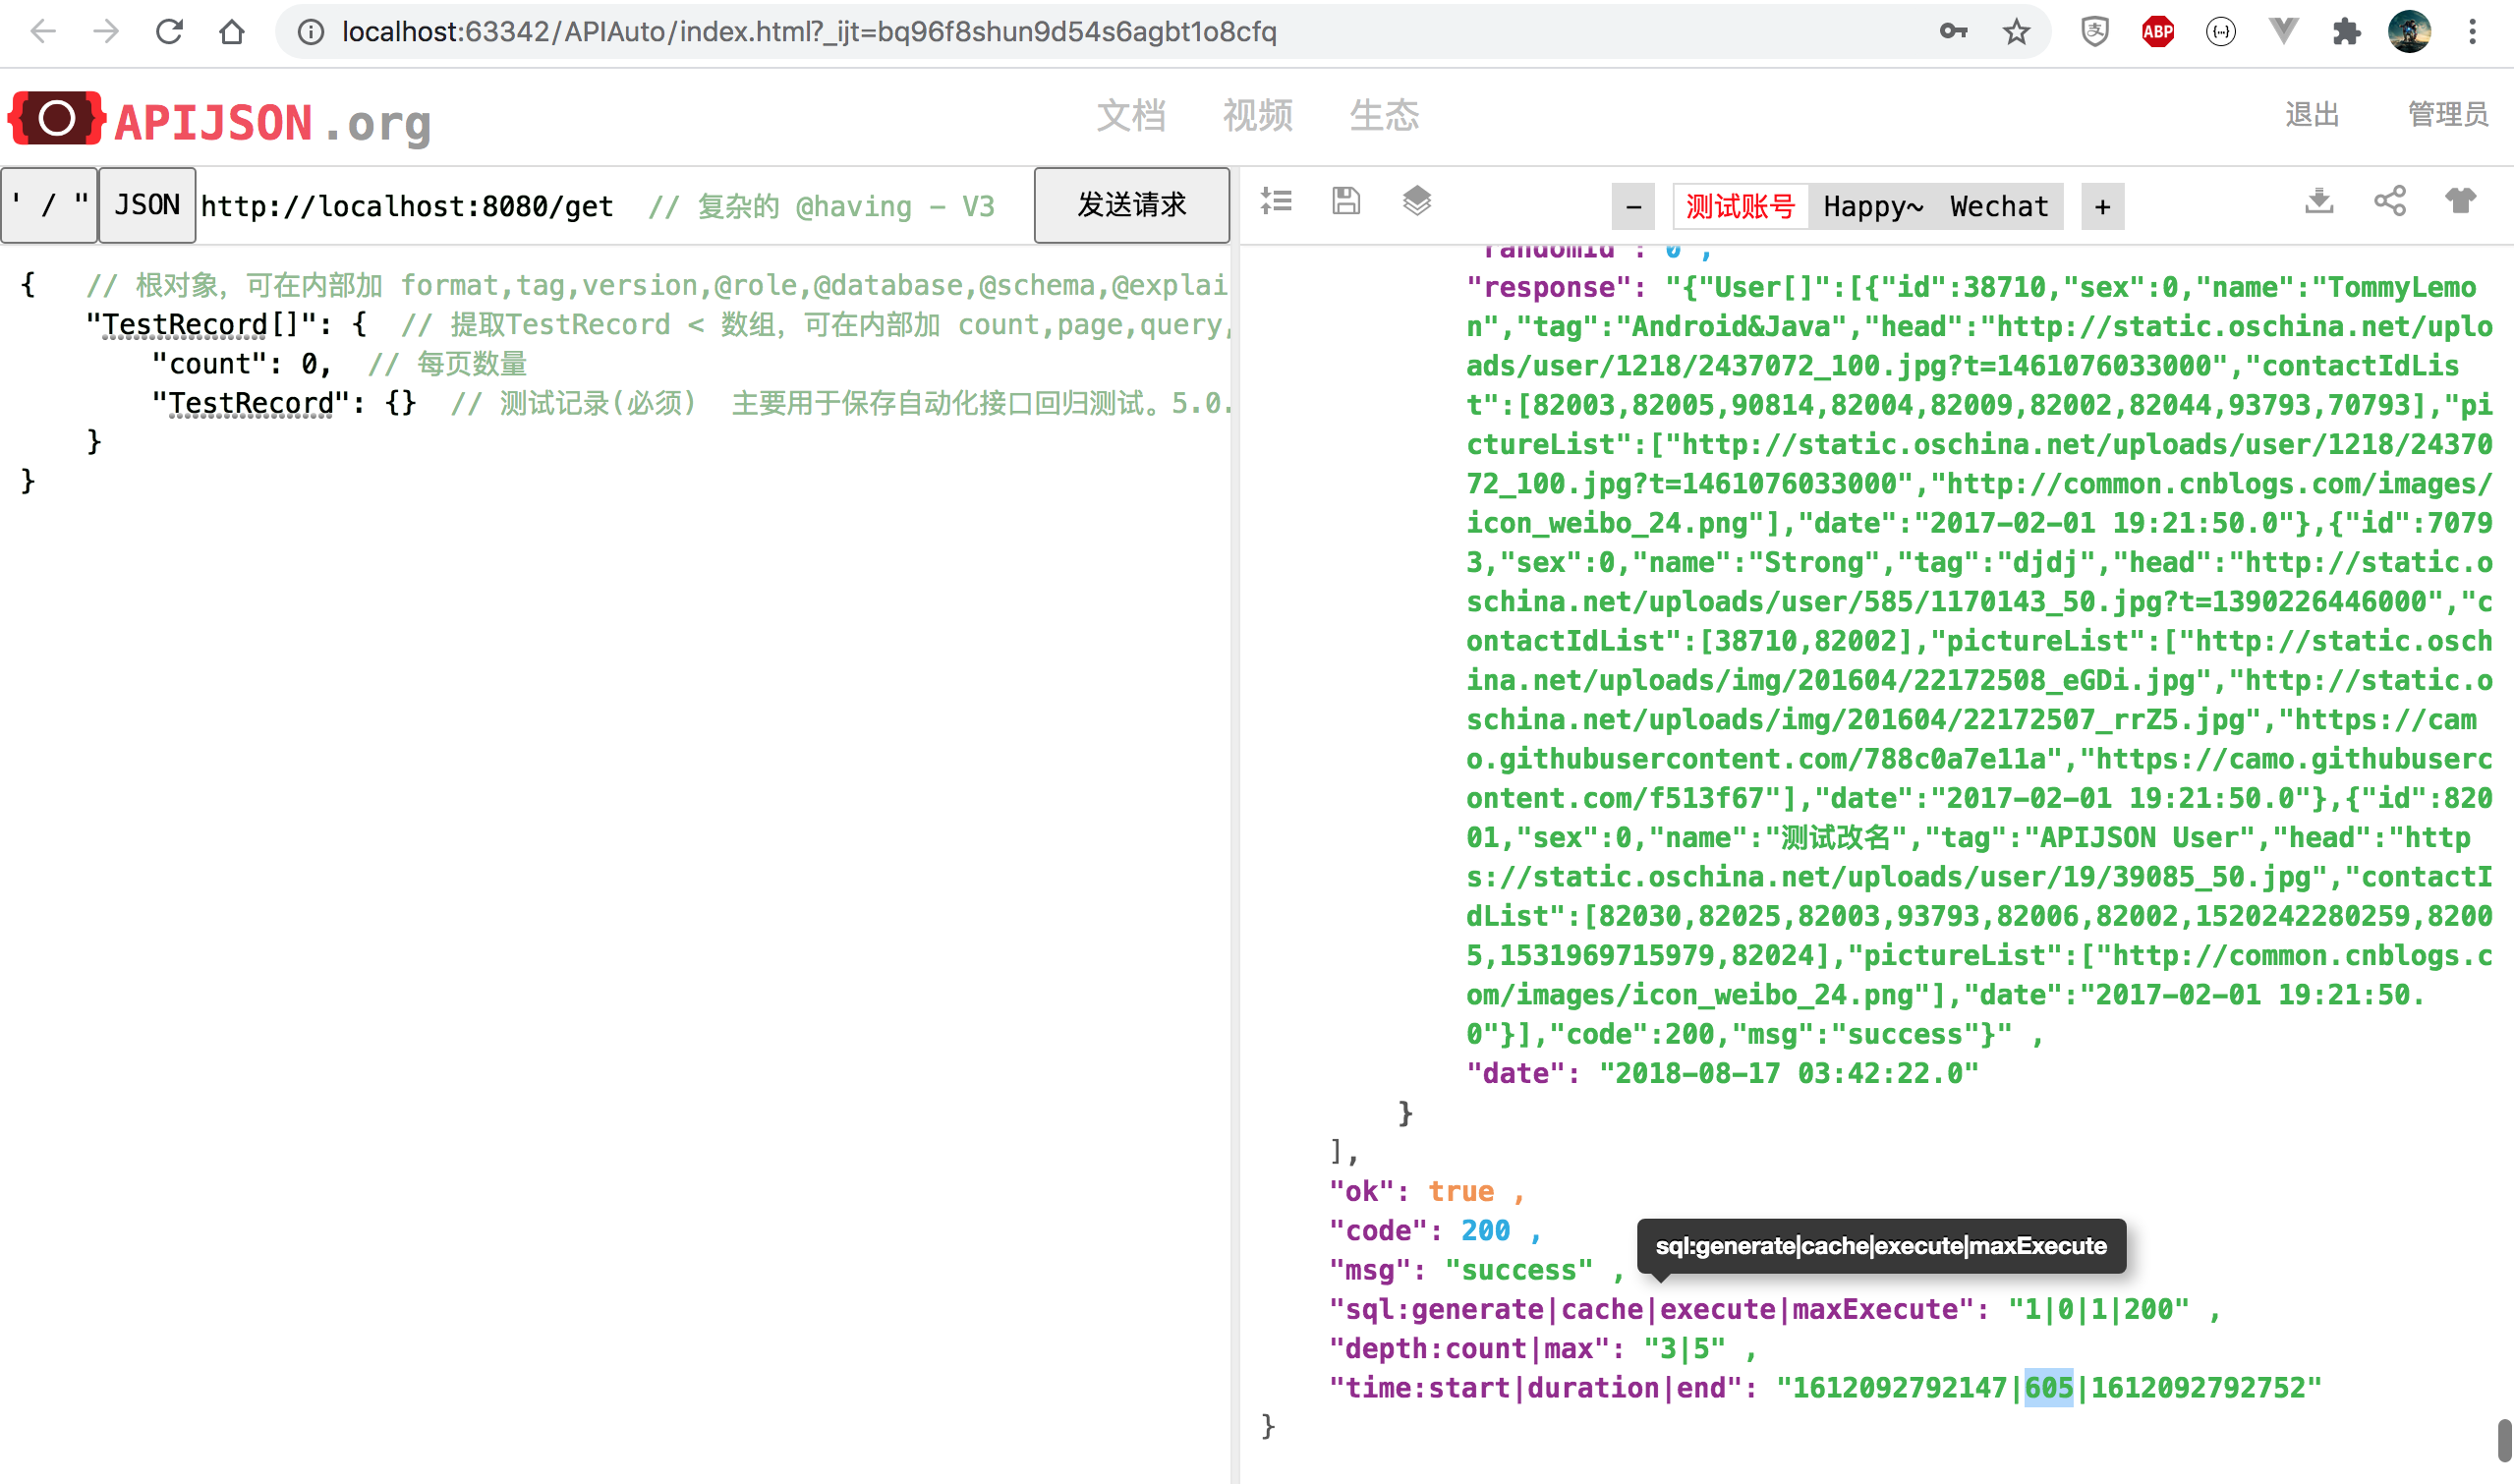
TestRecord [] the comparison time before and after query is reduced to 35%, and the performance is improved by 186%, 2.9} times as much as the original:
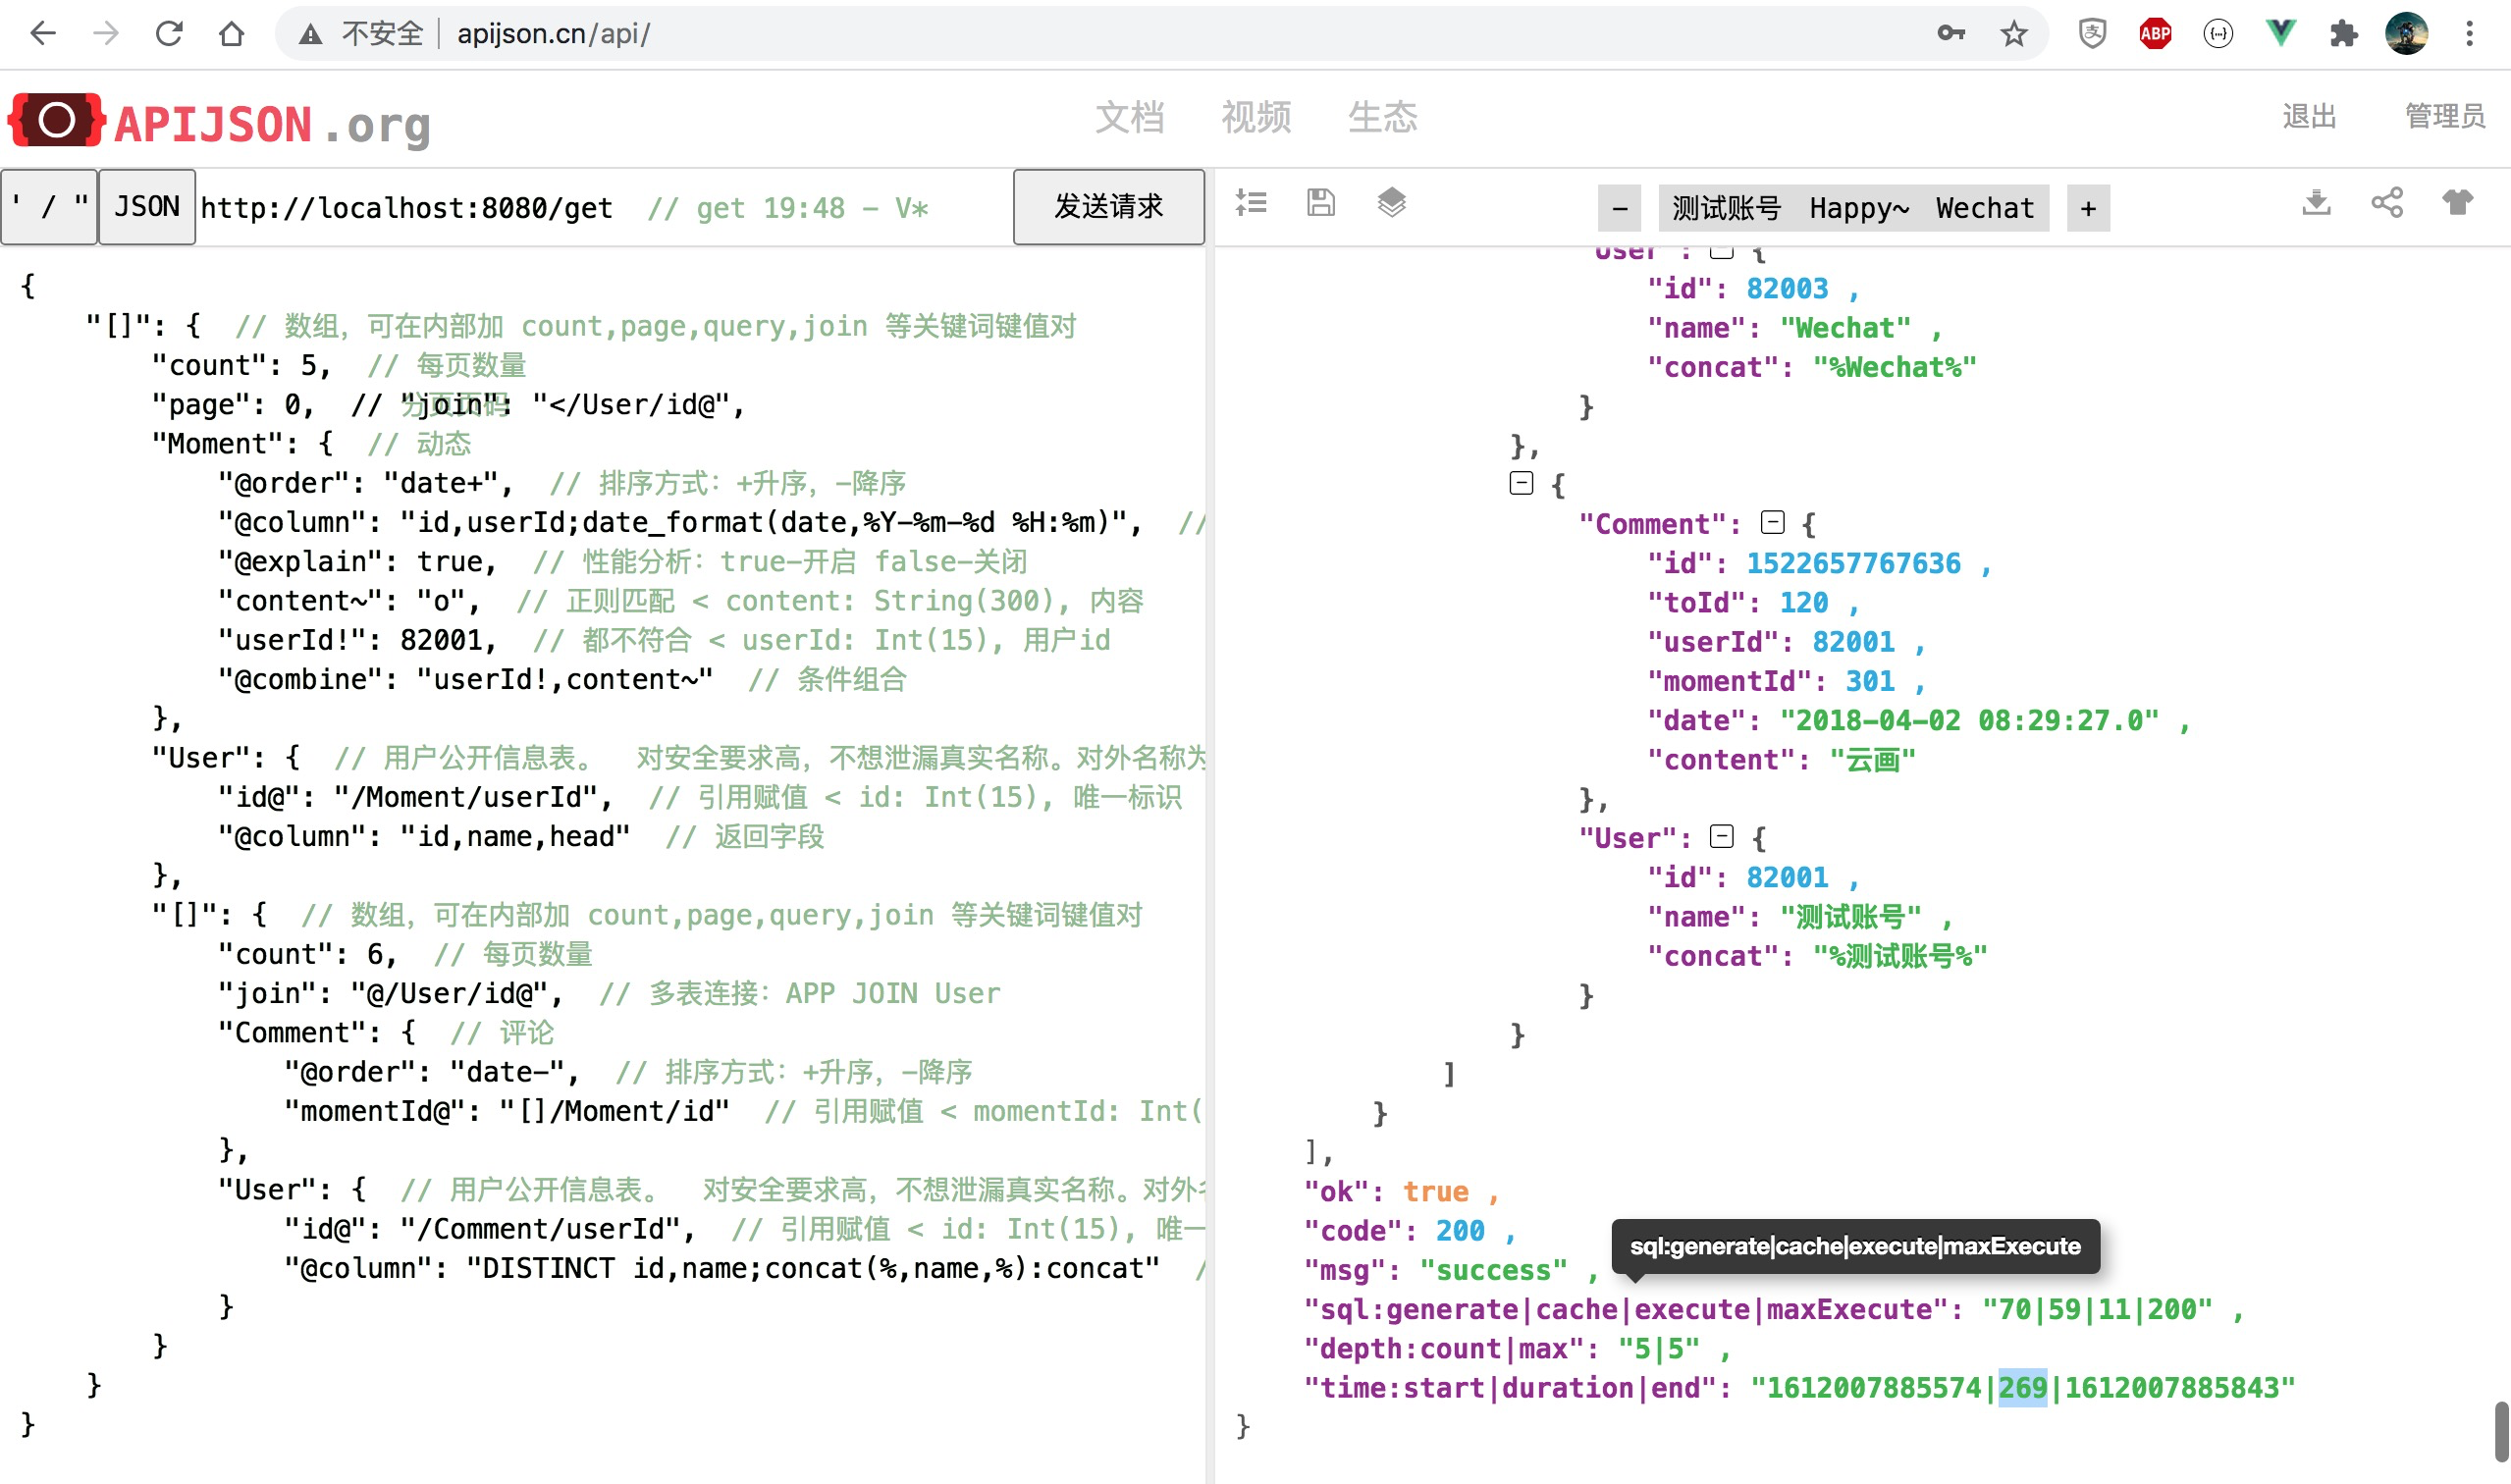
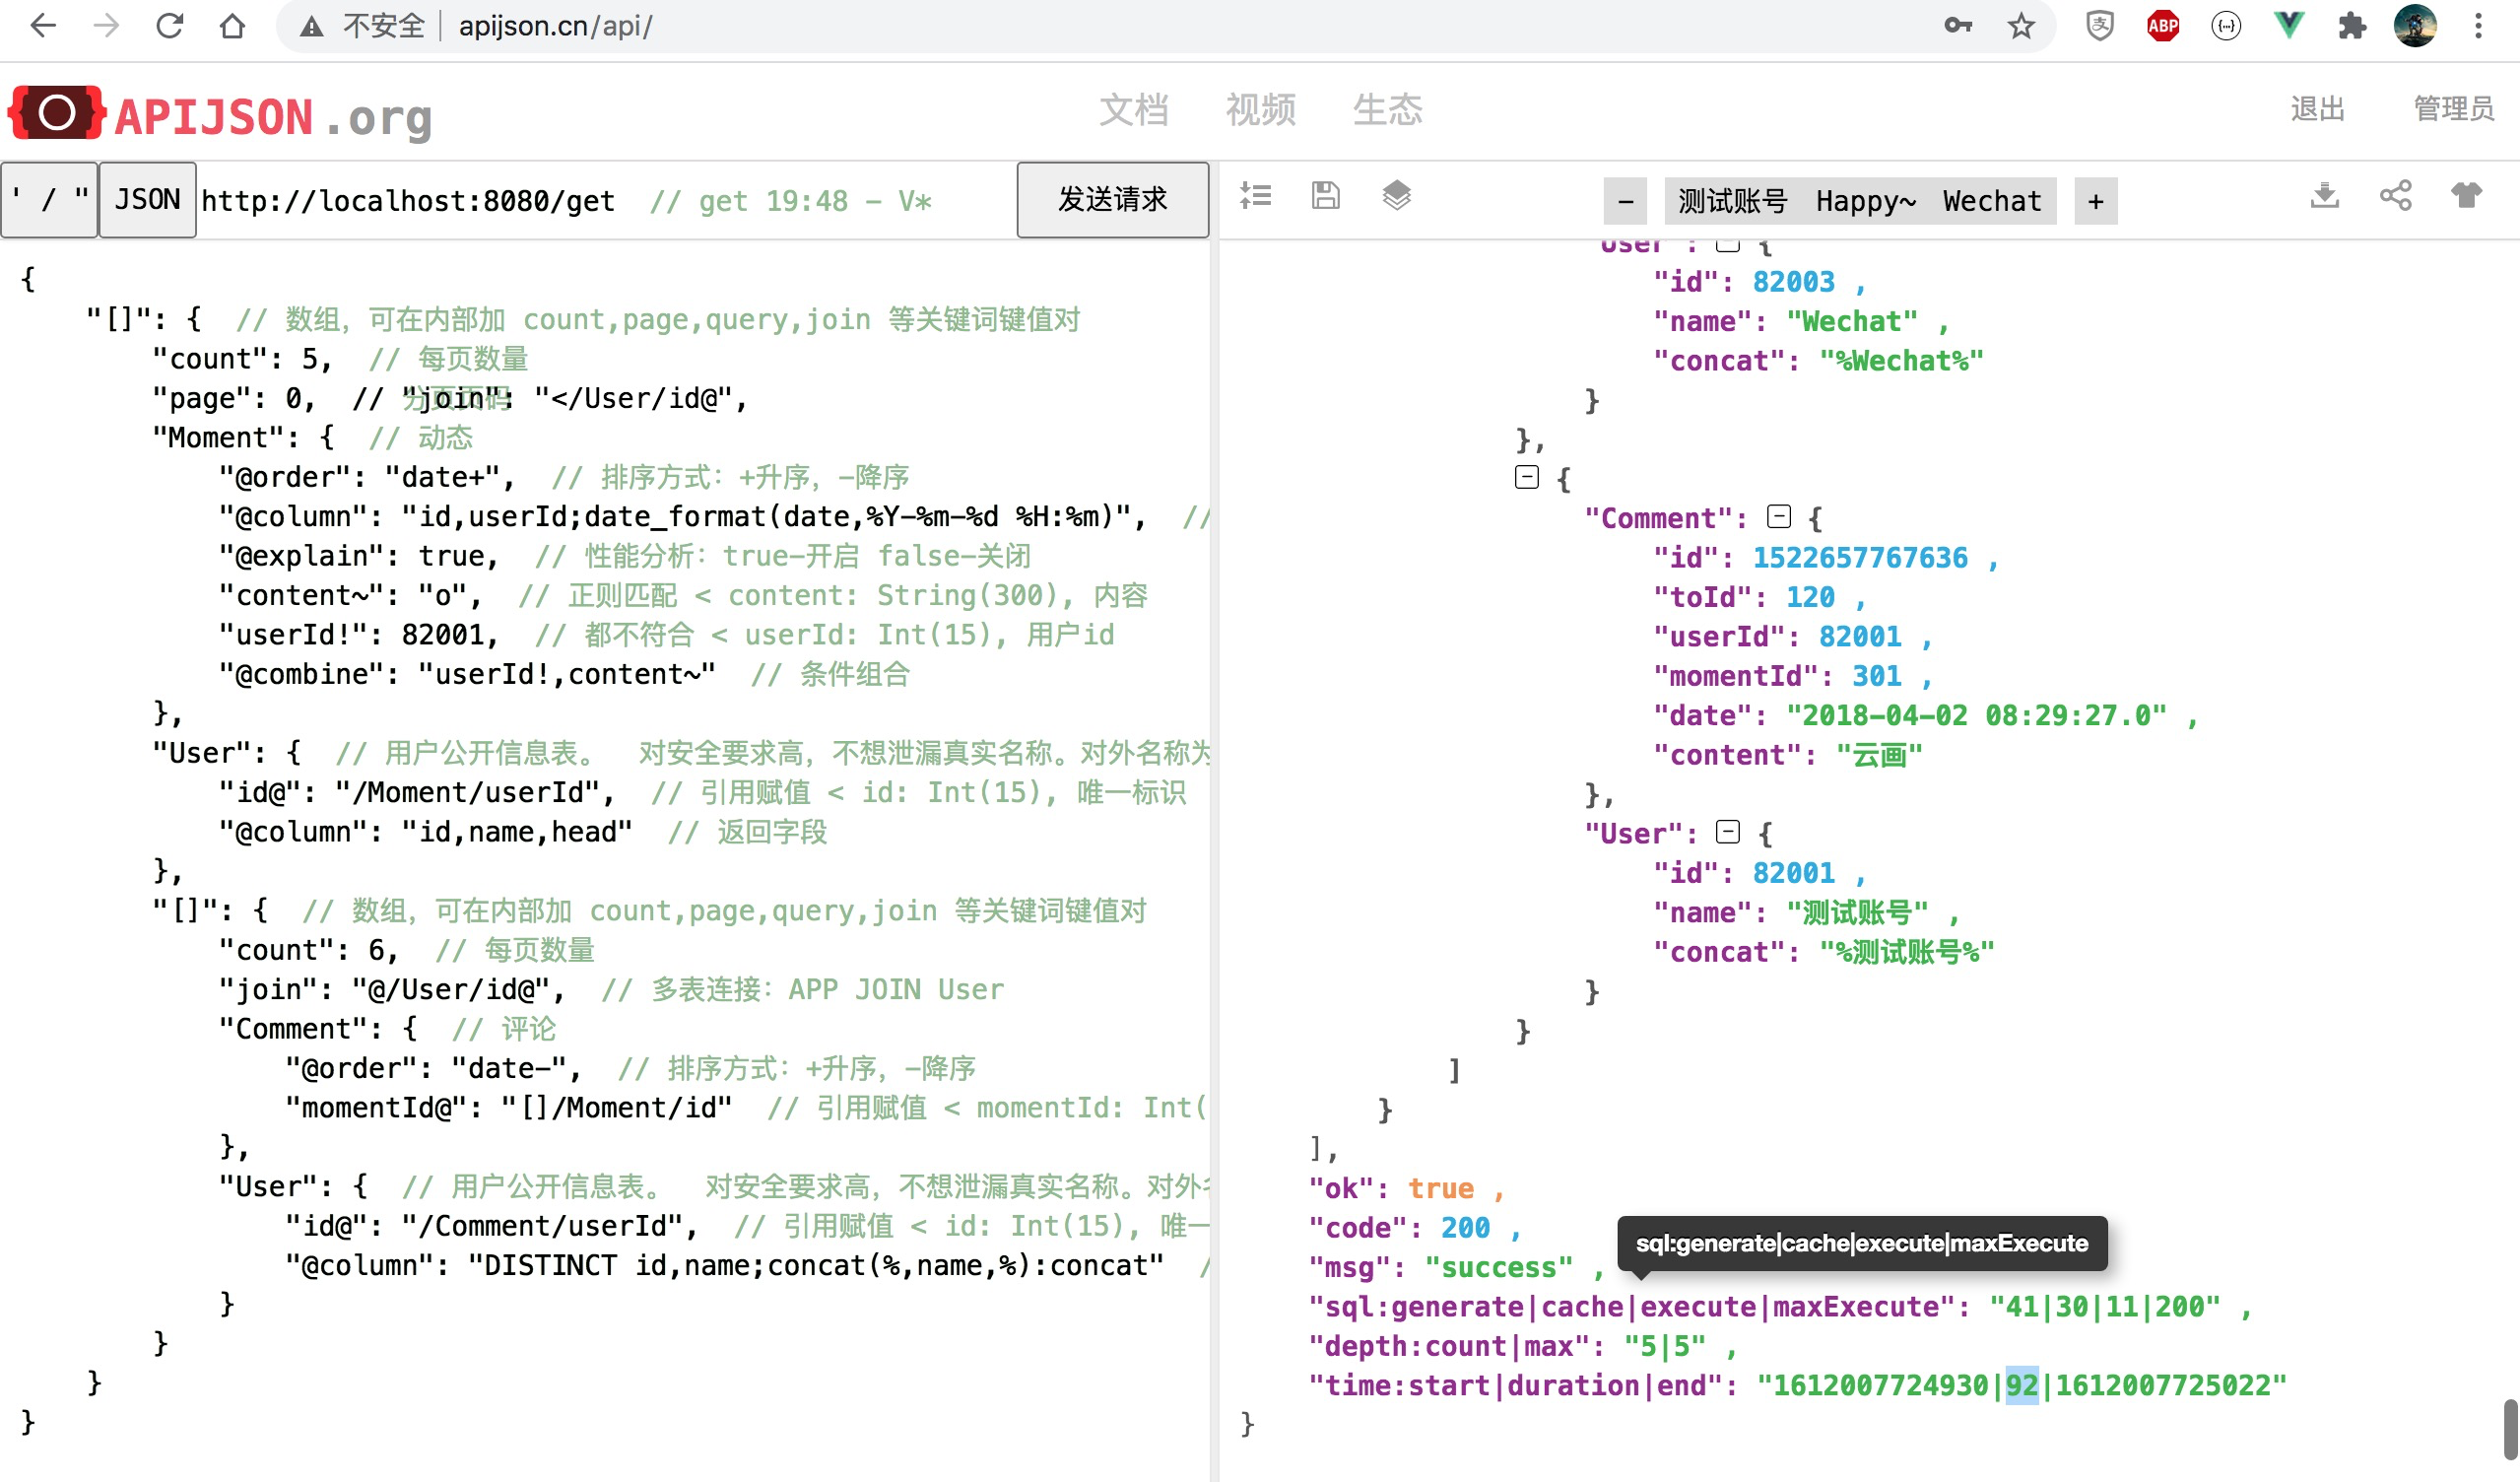
The comparison time before and after circle of friends list query is reduced to 34%, and the performance is improved by 192%, 2.9 times as much as the original:
Change to [], [] / User [], [] / [] combination, and the length count of each array is changed to 0 (corresponding to 100 records), and 100 * (1 + 100 + 100 * 2) = 30100 records are returned at most:

Note: the figure corresponding to 5651ms cannot be found. Replace it with the nearest figure
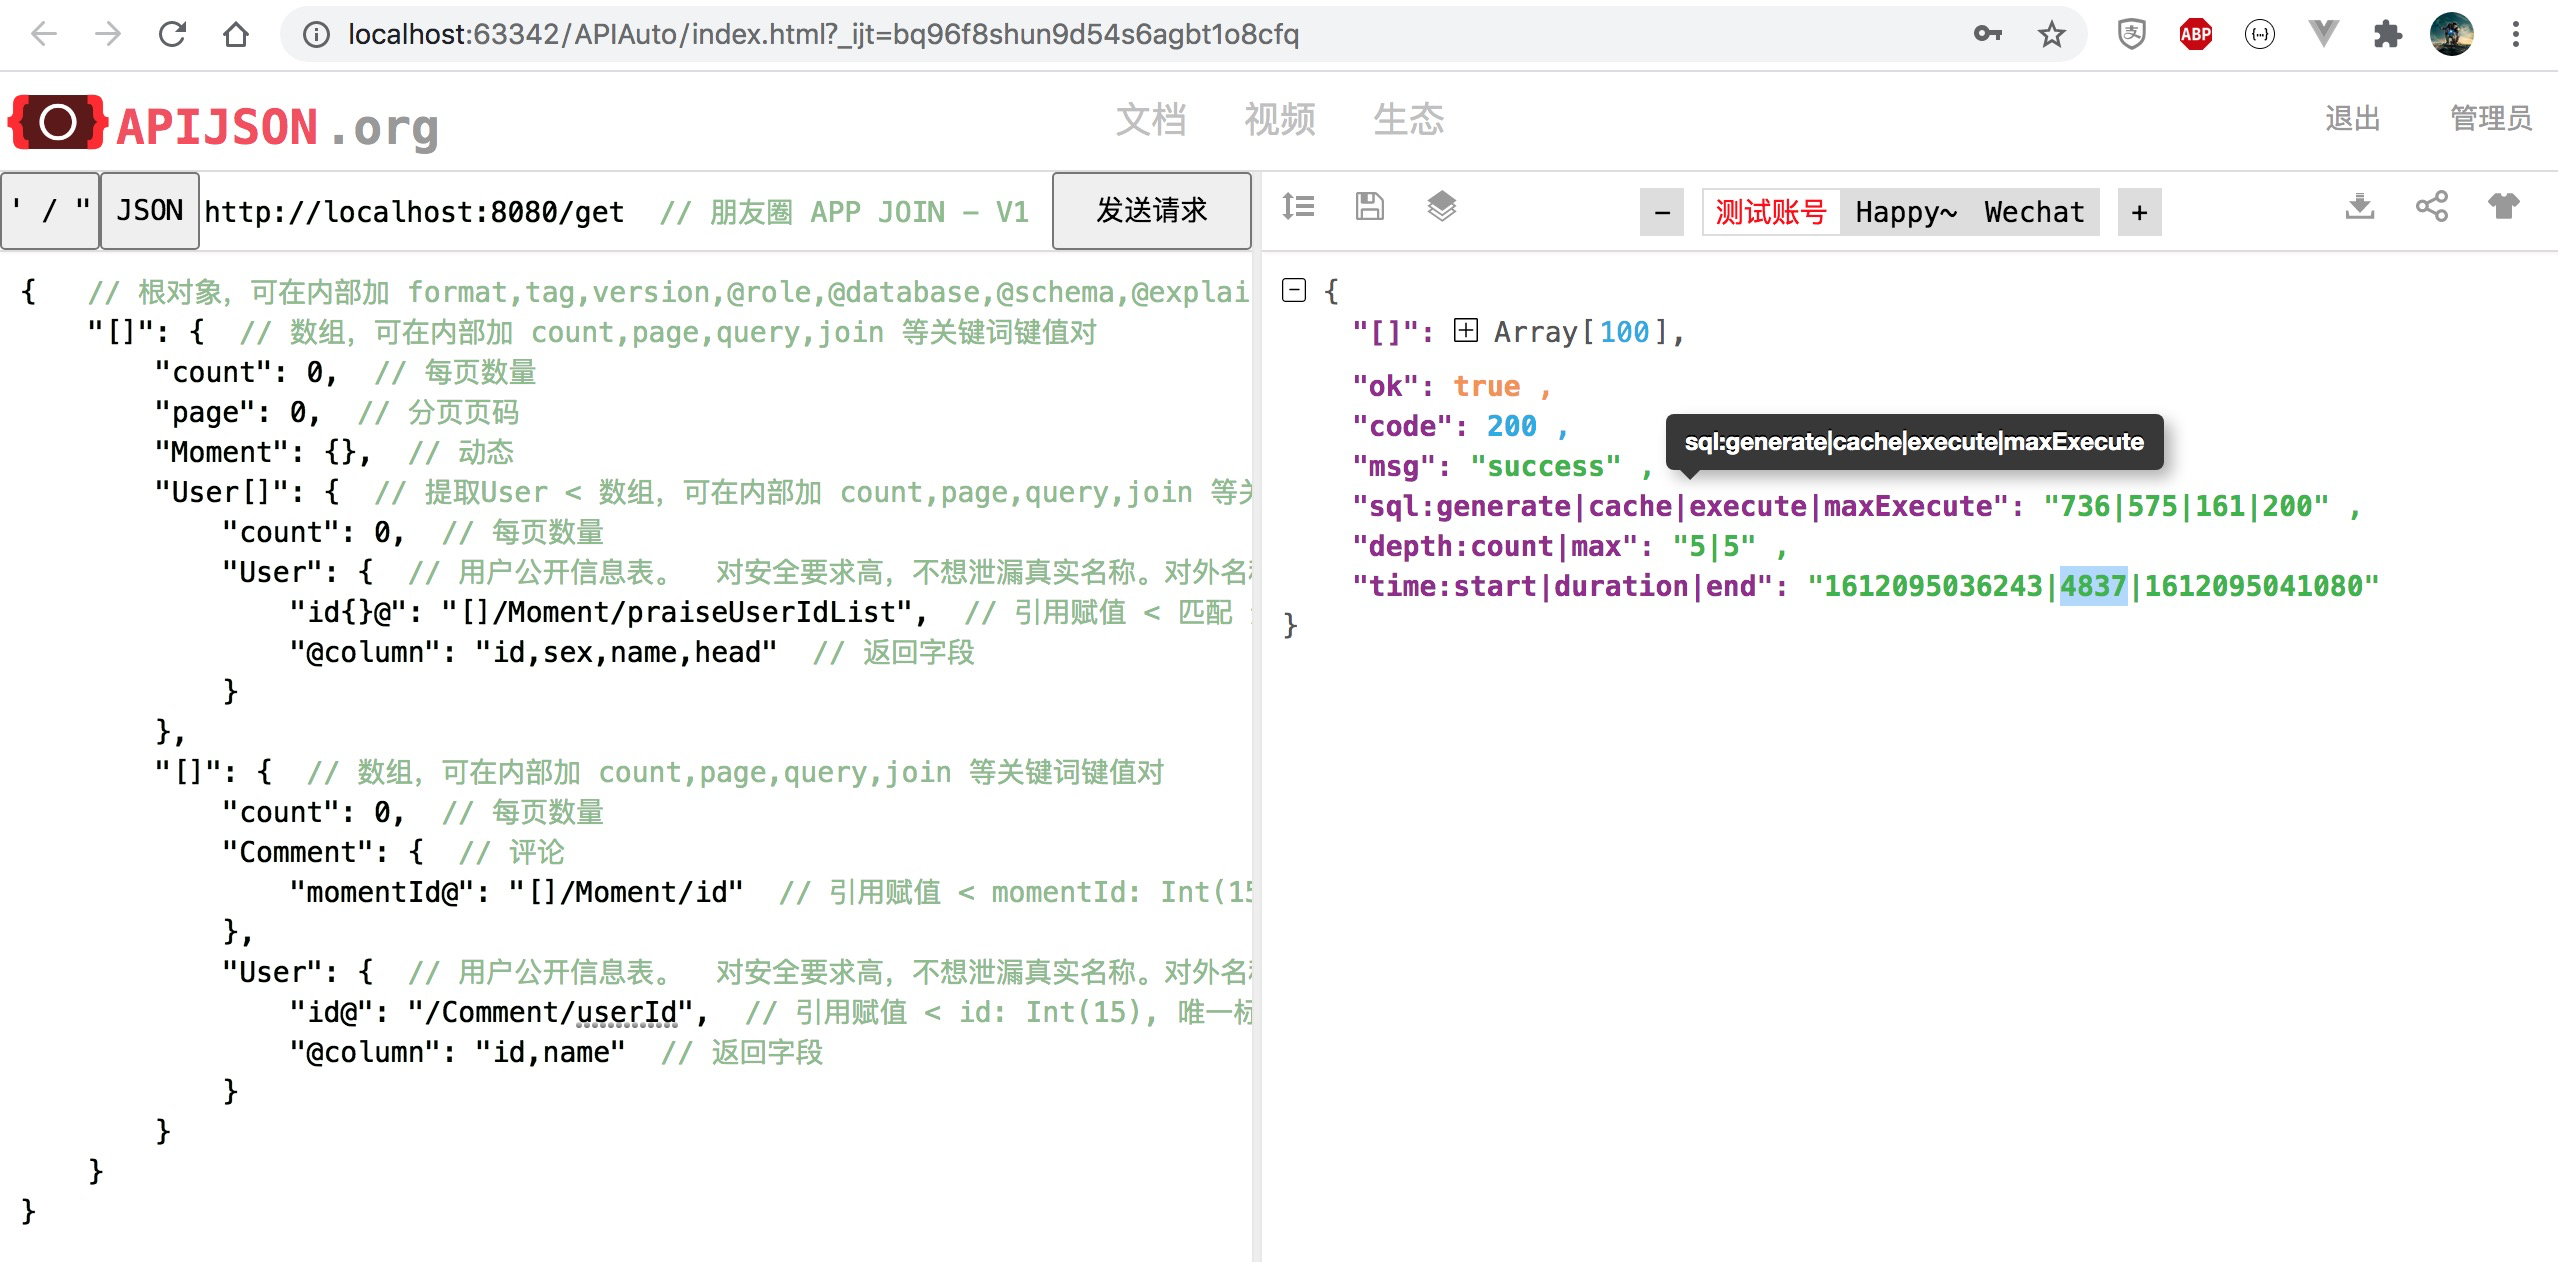
In this extreme case of simulating to C applications, the time consumption is reduced to 78%, and the performance is improved by 22%, 1.2} times as much as the original.
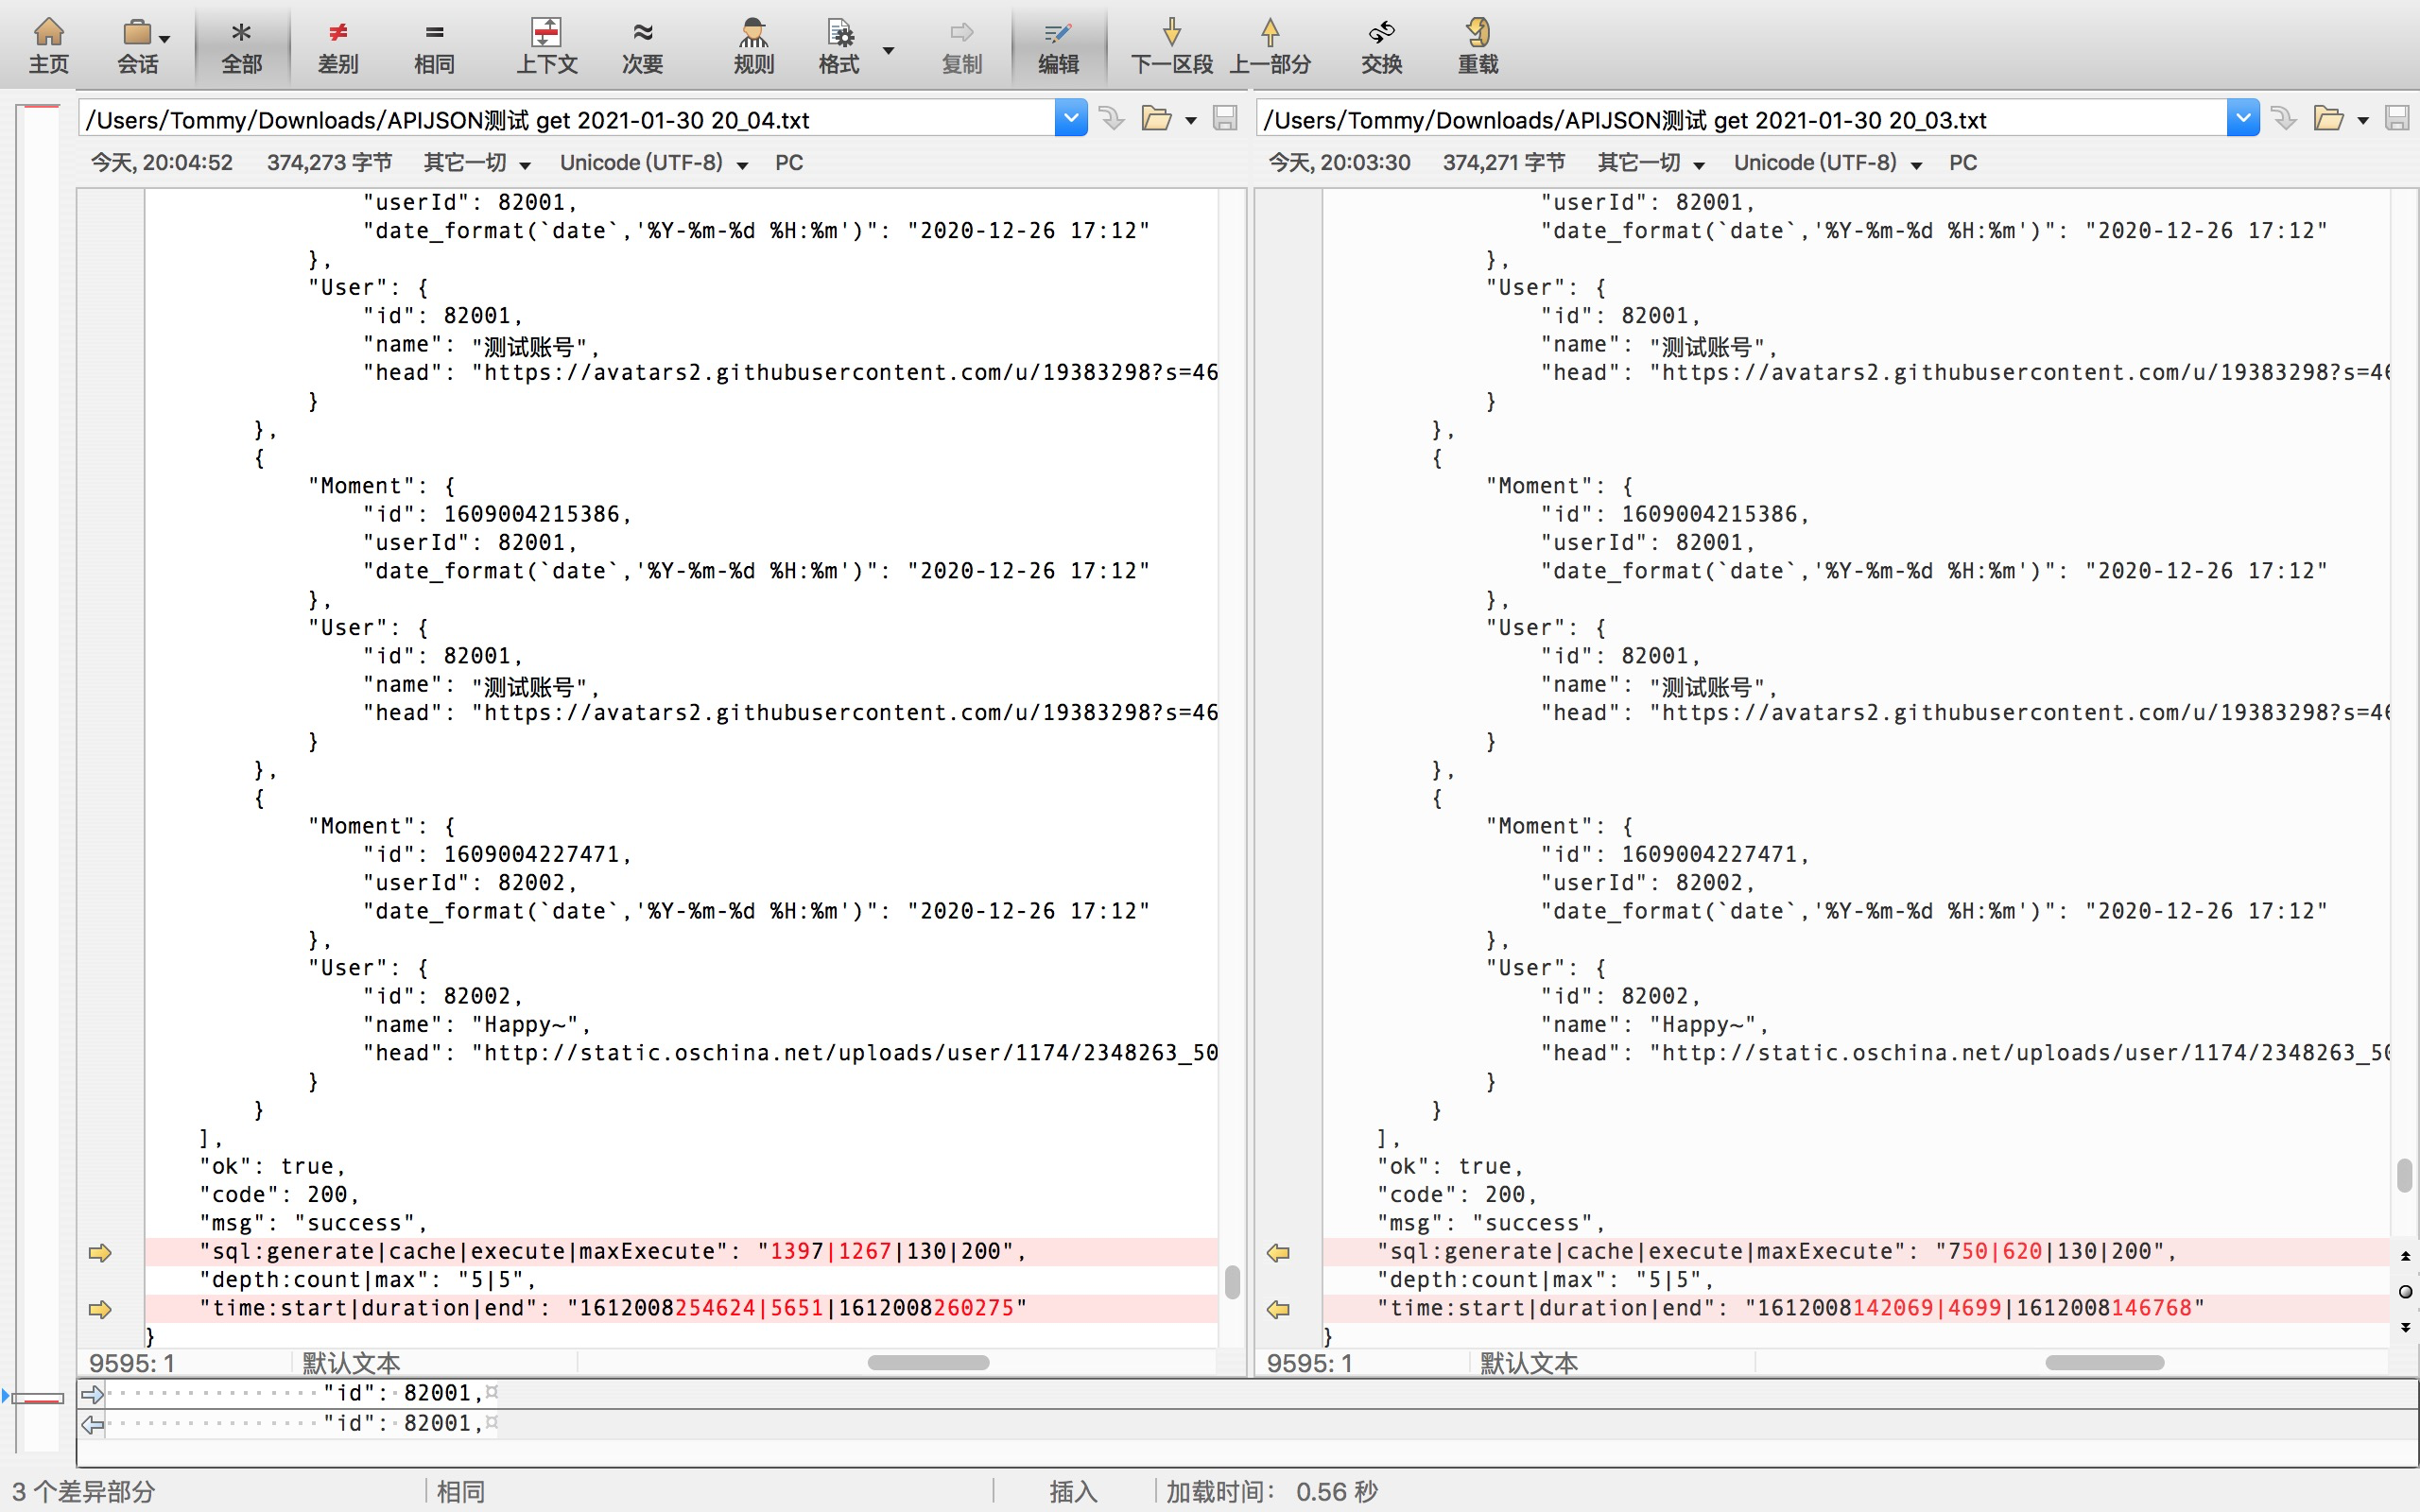
In this extreme case of simulating to C applications, the number of SQL generated is reduced from 1397 to 750, the time consumption is reduced to 83%, and the performance is improved by 20%, 1.2} times as much as the original.
At most, reduce the time consumption to 25%? It is estimated that the original 2s of their group can only be optimized to 500ms (about 200ms promised), and 30s can only be optimized to 7.5s.
God, the cows are blowing out. What should I do now Forget it, forget it. It's all a little. Go to bed first. Let them have a try tomorrow. Alas
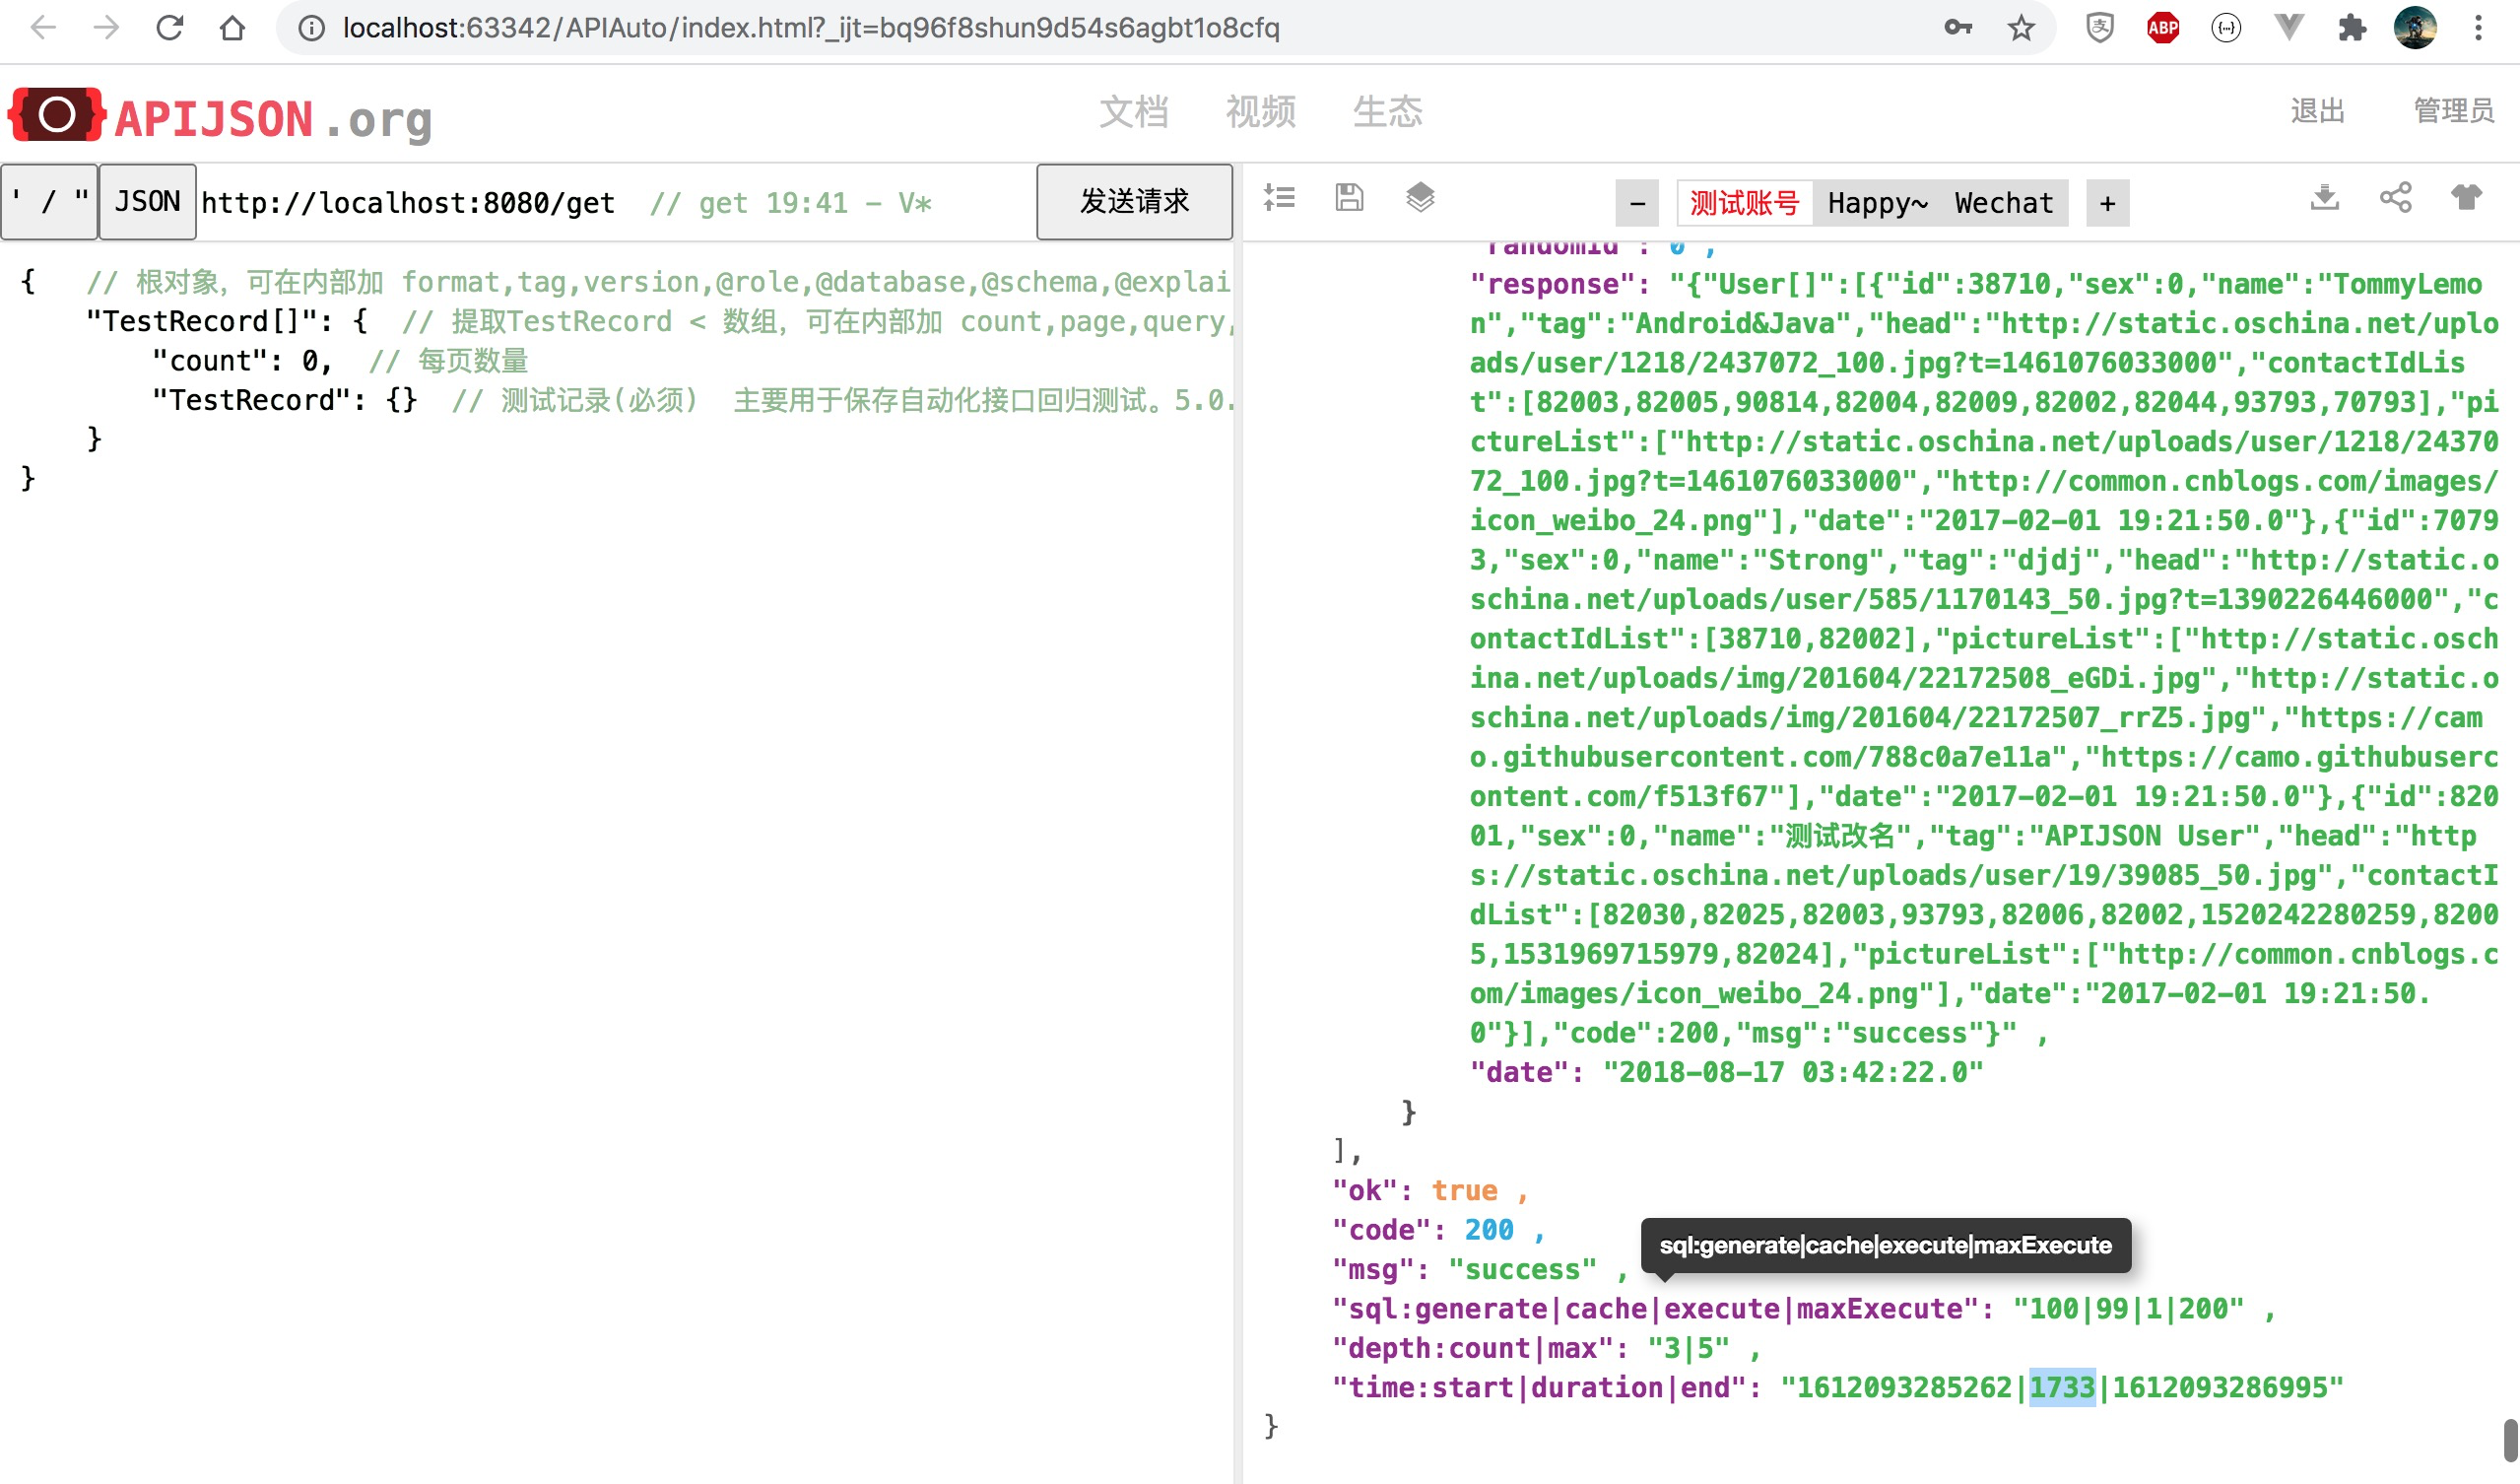
So I yawned and deployed APIJSON and APIAuto # apijson.cn , no problem with simple self-test, and then wash and sleep at more than two o'clock
(the self-test was repeated many times later. Although the results were close to the above, more conservative and low-key values were used in the Release)
The forenoon of the second day was announced to Tencent CSIG, a project team colleague updated APIJSON, and colleagues in the afternoon praised APIJSON awesome! Several screenshots were taken concurrently.
I was shocked when I saw LIMIT 1000000: good guy, I came up with the million data violence test in the online production environment. Don't young people talk about martial ethics?
---------- | ---------- | ---------- | ---------- | -------------
   Total   |  Received  | Time Total | Time Spent | Current Speed
   72.5M   |    72.5M   |   0:00:05  |   0:00:05  |     20.0M

/get >> http End of request:5624
I didn't control it for a moment. Remember to remember a few times. I shouted continuously in the company, "shit! One million five seconds! One million five seconds! It took five seconds to check one million records!"
Almost shouted the brainwashing advertisement "OMG, top it, top it!!!"
The surrounding colleagues were shocked. After a while, several back-end colleagues responded and praised them one after another!
Calm down and I'll analyze it carefully:
When they test the interface with CURL this time, the corresponding APIJSON service turns off the log, so they can't directly see the time-consuming of the service from receiving parameters to response results,
Therefore, according to the above data, the total time consumption is 5624ms - data 72.5M / download speed 20.0M per second = 1999ms, that is, the service execution process takes only 0.2s!
Obviously, the performance optimization effect of APIJSON is significantly better than expected. At the same time, the 100W record of 2.3KW large meter is only about 1s Tencent TDSQL Fast and fast!
.
.
However, according to the feedback of colleagues later, this time with conditions, it is actually less than 100W, only 12W data.
Instantly pulled me back from my plump ideal to the skinny reality. Well, the revolution has not yet succeeded, and we still need to make persistent efforts!
.
.
.
After several version iterations, 4.8 0 finally ushered in another significant performance improvement, and finally did it this time!
APIJSON 4.7.0 and 4.8 0 performance test results of a project of Tencent CSIG
1. Test environment
1.1 machine configuration
Tencent cloud tke docker pod, 4 cores / 16G.
1.2 db machine configuration
Tencent cloud 8-core 32000MB memory, 805GB storage space
1.3 test table DML and data volume (mysql 5.7)
CREATE TABLE `t_xxxx_xxxx` (
    `x_id` bigint(11) unsigned NOT NULL AUTO_INCREMENT,
    `x_xxxx_id` int(11) unsigned NOT NULL DEFAULT '0' COMMENT 'xID',
    `x_xid` int(11) unsigned NOT NULL DEFAULT '0' COMMENT 'xxID',
    `x_xx_id` int(11) unsigned NOT NULL DEFAULT '0' COMMENT 'xID',
    `x_xxxx_id` int(11) unsigned NOT NULL DEFAULT '0' COMMENT 'xxxID',
    `x_xxxxx_id` int(11) unsigned NOT NULL DEFAULT '0' COMMENT 'xxID',
    `x_xxxx_id` int(11) unsigned NOT NULL DEFAULT '0' COMMENT 'xxID',
    `x_uin` bigint(20) unsigned NOT NULL DEFAULT '0' COMMENT 'xxuin',
    `x_send_time` datetime DEFAULT NULL COMMENT 'Push message time',
    `x_xxxx_result` int(11) unsigned NOT NULL DEFAULT '0' COMMENT 'xx result',
    `x_xxx_xxxx_result` varchar(255) DEFAULT '' COMMENT 'xx result',
    `x_result` tinyint(4) unsigned NOT NULL DEFAULT '0' COMMENT '0 Error 1 correct 2 not set',
    `x_create_time` datetime NOT NULL DEFAULT CURRENT_TIMESTAMP COMMENT 'Creation time, Landing time',
    `x_credit` int(11) unsigned NOT NULL DEFAULT '0' COMMENT 'xx quantity',
    `x_xxxxxx_xxx_id` varchar(32) NOT NULL COMMENT 'Common parameters, Reporting application',
    `x_xxxxxx_source` varchar(32) NOT NULL COMMENT 'Common parameters, Escalation service name',
    `x_xxxxxx_server` varchar(32) NOT NULL COMMENT 'Common parameters, Reporting server ip',
    `x_xxxxxx_event_time` datetime NOT NULL COMMENT 'Common parameters, Reporting time',
    `x_xxxxxx_client` varchar(32) NOT NULL COMMENT 'Common parameters, client ip',
    `x_xxxxxx_trace_id` varchar(64) NOT NULL COMMENT 'Common parameters',
    `x_xxxxxx_sdk` varchar(16) NOT NULL COMMENT 'Common parameters, sdk edition',
    PRIMARY KEY (`x_id`, `x_uin`),
    UNIQUE KEY `udx_uid_xxxxid` (`x_uin`, `x_xxxx_id`),
    KEY `idx_xid` (`x_xid`)
) ENGINE = InnoDB DEFAULT CHARSET = utf8mb4 COMMENT = 'xx Event table'; -
Data volume: 18558903
-
mysql version: 5.7
-
Data distribution: use group by statistics based on x_xid to group by, get the following table:
select x_xid, count(x_id) counter from t_xxxx_xxxx group by x_xid order by counter desc limit 10;
| x_xid | counter |
|---|---|
| xxxx36 | 696376 |
| xxxx38 | 418576 |
| xxxx63 | 384503 |
| xxxx40 | 372080 |
| xxxx41 | 301364 |
| xxxx08 | 248243 |
| xxxx46 | 223820 |
| xxxx07 | 220234 |
| xxxx44 | 207721 |
| xxxx02 | 152795 |
1.4 log printing settings
Log.DEBUG = false;

AbstractParser.IS_PRINT_REQUEST_STRING_LOG = false;
AbstractParser.IS_PRINT_REQUEST_ENDTIME_LOG = false;
AbstractParser.IS_PRINT_BIG_LOG = false;
2. Test script (using Table[]: {Table: {}} format)
Script statistics method:
-
Statistics are based on the realtime output from the linux time command.
-
The test is divided into two scenarios: one without where condition and one with X_ XID in (xxxxxx36, xxxxxx38), which can match 100W + data to cover any data volume scenario between 10W and 100W. Here, select x is used in advance_ xid, count(x_id) c from t_ xxxx_ xxxx group by x_ xid order by c desc; This statement makes statistics on the table, X_ XID = xxx36, 696376 records, X_ XID = xxx38, there are 418576 records.
Script: apitest sh
#!/bin/bash
printf -- '--------------------------\n Start without where Condition test\n'
time curl  -X POST -H 'Content-Type:application/json' 'http://x.xxx.xx.xxx:xxxx/get' -d '{"T_xxxx_xxxx[]":{"count":100000, "T_xxxx_xxxx":{"@column":"x_uin,x_send_time,x_xxxx_id,x_xid,x_xx_id,x_xxxxx_id,x_xxxx_result,x_result,x_credit"}}}' > 10w_no_where.log

time curl  -X POST -H 'Content-Type:application/json' 'http://x.xxx.xx.xxx:xxxx/get' -d '{"T_xxxx_xxxx[]":{"count":200000, "T_xxxx_xxxx":{"@column":"x_uin,x_send_time,x_xxxx_id,x_xid,x_xx_id,x_xxxxx_id,x_xxxx_result,x_result,x_credit"}}}' > 20w_no_where.log

time curl  -X POST -H 'Content-Type:application/json' 'http://x.xxx.xx.xxx:xxxx/get' -d '{"T_xxxx_xxxx[]":{"count":500000, "T_xxxx_xxxx":{"@column":"x_uin,x_send_time,x_xxxx_id,x_xid,x_xx_id,x_xxxxx_id,x_xxxx_result,x_result,x_credit"}}}' > 50w_no_where.log

time curl  -X POST -H 'Content-Type:application/json' 'http://x.xxx.xx.xxx:xxxx/get' -d '{"T_xxxx_xxxx[]":{"count":800000, "T_xxxx_xxxx":{"@column":"x_uin,x_send_time,x_xxxx_id,x_xid,x_xx_id,x_xxxxx_id,x_xxxx_result,x_result,x_credit"}}}' > 80w_no_where.log

time curl  -X POST -H 'Content-Type:application/json' 'http://x.xxx.xx.xxx:xxxx/get' -d '{"T_xxxx_xxxx[]":{"count":1000000, "T_xxxx_xxxx":{"@column":"x_uin,x_send_time,x_xxxx_id,x_xid,x_xx_id,x_xxxxx_id,x_xxxx_result,x_result,x_credit"}}}' > 100w_no_where.log


printf -- '--------------------------\n Start band where Condition test\n'
time curl  -X POST -H 'Content-Type:application/json' 'http://x.xxx.xx.xxx:xxxx/get' -d '{"T_xxxx_xxxx[]":{"count":100000, "T_xxxx_xxxx":{"x_xid{}":[xxxx36,xxxx38],"@column":"x_uin,x_send_time,x_xxxx_id,x_xid,x_xx_id,x_xxxxx_id,x_xxxx_result,x_result,x_credit"}}}' > 10w_with_where.log

time curl  -X POST -H 'Content-Type:application/json' 'http://x.xxx.xx.xxx:xxxx/get' -d '{"T_xxxx_xxxx[]":{"count":200000, "T_xxxx_xxxx":{"x_xid{}":[xxxx36,xxxx38],"@column":"x_uin,x_send_time,x_xxxx_id,x_xid,x_xx_id,x_xxxxx_id,x_xxxx_result,x_result,x_credit"}}}' > 20w_with_where.log

time curl  -X POST -H 'Content-Type:application/json' 'http://x.xxx.xx.xxx:xxxx/get' -d '{"T_xxxx_xxxx[]":{"count":500000, "T_xxxx_xxxx":{"x_xid{}":[xxxx36,xxxx38],"@column":"x_uin,x_send_time,x_xxxx_id,x_xid,x_xx_id,x_xxxxx_id,x_xxxx_result,x_result,x_credit"}}}' > 50w_with_where.log

time curl  -X POST -H 'Content-Type:application/json' 'http://x.xxx.xx.xxx:xxxx/get' -d '{"T_xxxx_xxxx[]":{"count":800000, "T_xxxx_xxxx":{"x_xid{}":[xxxx36,xxxx38],"@column":"x_uin,x_send_time,x_xxxx_id,x_xid,x_xx_id,x_xxxxx_id,x_xxxx_result,x_result,x_credit"}}}' > 80w_with_where.log

time curl  -X POST -H 'Content-Type:application/json' 'http://x.xxx.xx.xxx:xxxx/get' -d '{"T_xxxx_xxxx[]":{"count":1000000, "T_xxxx_xxxx":{"x_xid{}":[xxxx36,xxxx38],"@column":"x_uin,x_send_time,x_xxxx_id,x_xid,x_xx_id,x_xxxxx_id,x_xxxx_result,x_result,x_credit"}}}' > 100w_with_where.log
That is, the large table recorded in MySQL 5.7 with a total of 1.9KW counts the total time of CRUL 10-20M/s network speed from initiating the request to receiving the returned packet
| Order of magnitude | 4.7. 0 (average of 5 times) | 4.8. 0 (average of 5 times) | Whether the packet is returned normally | where condition | Performance improvement |
|---|---|---|---|---|---|
| 10W | 1.739s | 1.159s | yes | nothing | 50%. That is ((1 / 1.159-1 / 1.739) / (1 / 1.739)) * 100% |
| 20W | 3.518s | 2.676s | yes | nothing | 31.5% |
| 50W | 9.257s | 6.952s | yes | nothing | 33.2% |
| 80W | 16.236s | 10.697s | -When Xmx=3192M, the packet cannot be returned normally. OOM error. Increase the - Xmx parameter and click ok. | nothing | 51.8% |
| 100W | 19.748s | 14.466s | -When Xmx=3192M, the packet cannot be returned normally. OOM error. Increase the - Xmx parameter and click ok | nothing | 36.5% |
| 10W | 1.928s | 1.392s | yes | "X_xid{}": [xxxxxx36, xxx38], covering more than 100W data. | 38.5% |
| 20W | 4.149s | 2.852s | yes | "x_xid{}":[xxxx36,xxxx38] | 45.5% |
| 50W | 10.652s | 7.231s | yes | "x_xid{}":[xxxx36,xxxx38] | 47.3% |
| 80W | 16.975s | 12.465s | Normal packet return after - Xmx adjustment | "x_xid{}":[xxxx36,xxxx38] | 36.2% |
| 100W | 20.632s | 16.481s | Normal packet return after - Xmx adjustment | "x_xid{}":[xxxx36,xxxx38] | 25.2% |
Thanks for the detailed test report given by my colleague, he was desensitized twice on the basis of his desensitization, and made public after confirming with him~
Take the previous apijson 4.6 0 connect the 2.3KW large strap and find out the 12W + data to estimate:
---------- | ---------- | ---------- | ---------- | -------------
   Total   |  Received  | Time Total | Time Spent | Current Speed
   72.5M   |    72.5M   |   0:00:05  |   0:00:05  |     20.0M

/get >> http End of request:5624
4.6. 0-4.7. 2 has no obvious performance optimization, so 4.7 0 only took about 2s. It should be because of the change of a table. The average amount of data per row has been reduced by about 65%, which is 35% of the original.
APIJSON 4.6.0 check the 100W data in the original 2.3KW large table, and estimate the time consumption according to the proportion of the data in the old and new tables = 20.632s / 65% = 31.7s;
APIJSON 4.6.0 check the 100W data in the original 2.3KW large table. According to the proportion of the data found in the same table, the estimated time consumption = 100W*72.5M/(12-13W)/(20M/s) = 27.9s-30.2s.
The estimation results of the two methods are basically the same. The whole service time after excluding the network time can also be estimated according to the proportion of the average data volume of each row of the 35% old and new tables:
APIJSON 4.6.0 check the original 2.3KW large table, 12W + data volume, service time = total time = 5.624s - data 72.5M / download speed 20.0Mbps = 2.00s;
APIJSON 4.7.0 check the 10W data volume in the 1.9KW large table. Service time = total time = 1.928s - data 72.5M*35%(10/12) / (download speed 10-20.0Mbps) = 0.00-0.87s;
APIJSON 4.8.0 check the 10W data volume in the 1.9KW large table. Service time = total time = 1.392s - data 72.5M*35%(10/12) / (download speed 10-20.0Mbps) = 0.00-0.33s, a decrease of 62%;
APIJSON 4.7.0 check the 100W data volume in the 1.9KW large table. Service time = total time consumption 20.632s - data 725M*35%(10/12) / (download speed 10-20.0Mbps) = 0.00-10.06s;
APIJSON 4.8.0 check the 100W data volume in the 1.9KW large table. Service time = total time consumption 16.481s - data 725M*35%(10/12) / (download speed 10-20.0Mbps) = 0.00-5.91s, a decrease of 41%.
That is, 100W records were found under the condition of 1.9KW large strap, apijson 4.8 The whole service of 0 takes less than 6s from the completion of receiving parameters to the beginning of returning data!


APIJSON - zero code interface and documentation
🏆 Tencent open source top ten, internal and external five awards 🚀 Zero code, hot update, fully automatic ORM library,
The back-end interface and document zero code, and the front-end (client) customizes the data and structure returned by JSON!