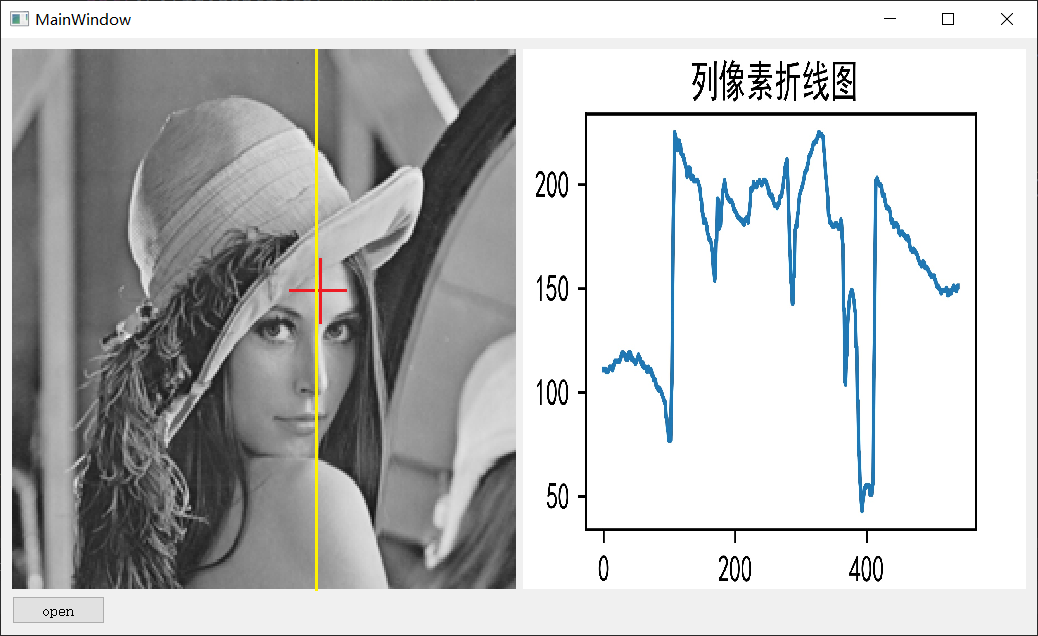
Scene: there are a series of images. You need to view the pixel value of each column of the image. You can read the image, specify the column, and then view it. However, it is troublesome. You have to modify each column. Then use the callback function slider, so that you don't have to modify the column every time, but if you change an image, you still have to modify the image path. So I want to make an interface. You can choose to open the image, and click a point in the image with the mouse to draw a broken line diagram of a whole column of pixel values in the column (of course, it can also be a row) where the point is located.
The final effect is as follows, which can be basically satisfied.
The code is as follows:
from PyQt5.QtWidgets import QApplication, QMessageBox, QFileDialog, QGridLayout
from PyQt5.QtGui import QPainter, QPixmap
from PyQt5 import uic,QtWidgets
from PyQt5.QtCore import Qt, QPoint
from plot2 import Ui_MainWindow # Here, plot2 is through plot2 UI to plot 2 Py file
import sys
import matplotlib
matplotlib.use("Qt5Agg") # Declare QT5
from matplotlib.backends.backend_qt5agg import FigureCanvasQTAgg as FigureCanvas
from matplotlib.figure import Figure
import matplotlib.pyplot as plt
import numpy as np
import cv2
plt.rcParams['font.sans-serif']=['SimHei'] # Show Chinese labels
plt.rcParams['axes.unicode_minus']=False
#Create a matplotlib graphics drawing class
class MyFigure(FigureCanvas):
def __init__(self,width=5, height=4, dpi=600):
#Step 1: create a Figure
self.fig = Figure(figsize=(width, height), dpi=dpi)
#Step 2: activate the Figure window in the parent class
super(MyFigure,self).__init__(self.fig) #This sentence is necessary, otherwise the graph cannot be displayed
#Step 3: create a subgraph for drawing graphics. 111 represents the subgraph number, such as subplot(1,1,1) of matlab
self.axes = self.fig.add_subplot(111)
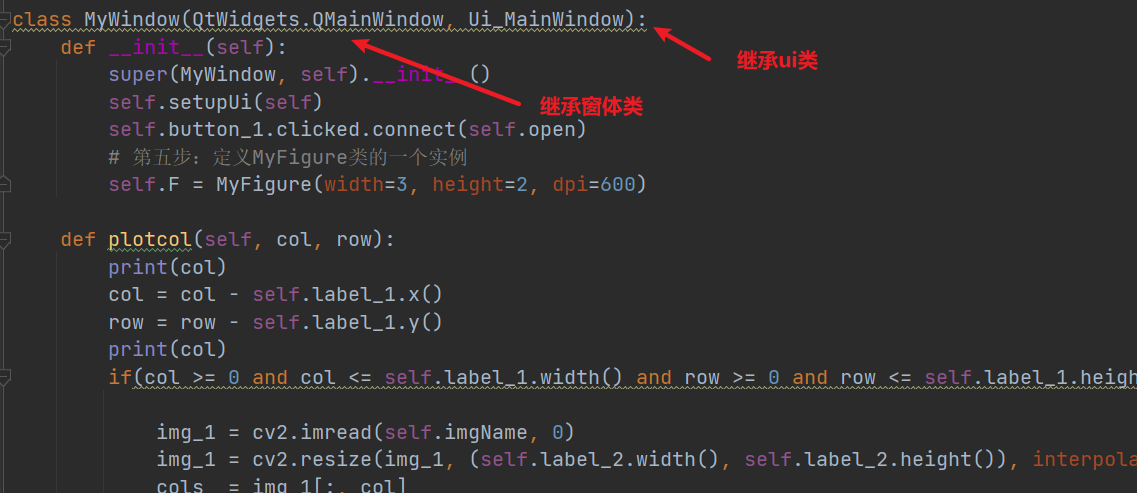
class MyWindow(QtWidgets.QMainWindow, Ui_MainWindow):
def __init__(self):
super(MyWindow, self).__init__()
self.setupUi(self)
self.button_1.clicked.connect(self.open)
# Step 5: define an instance of MyFigure class
self.F = MyFigure(width=3, height=2, dpi=600)
def plotcol(self, col, row):
print(col)
col = col - self.label_1.x()
row = row - self.label_1.y()
print(col)
if(col >= 0 and col <= self.label_1.width() and row >= 0 and row <= self.label_1.height()):
img_1 = cv2.imread(self.imgName, 0)
img_1 = cv2.resize(img_1, (self.label_2.width(), self.label_2.height()), interpolation=cv2.INTER_AREA)
cols_ = img_1[:, col]
x = np.arange(0, self.label_2.height(), 1)
self.F.axes.plot(x, cols_)
self.F.fig.suptitle("Column pixel line chart")
self.F.fig.savefig('tmp.jpg')
self.label_2.setPixmap(QPixmap('tmp.jpg').scaled(self.label_2.width(), self.label_2.height()))
self.F.axes.clear()
def open(self):
self.imgName, imgType = QFileDialog.getOpenFileName(self.label_1, "Open picture", "", "*.tiff;;*.jpg;;*.png;;All Files(*)")
self.jpg = QPixmap(self.imgName).scaled(self.label_1.width(), self.label_1.height())
# self.label.setPixmap(jpg)
if (self.jpg.isNull() != True):
self.label_1.setPixmap(self.jpg)
def mousePressEvent (self, event):
if event.button() == Qt.LeftButton:
print(event.pos())
self.plotcol(event.pos().x(), event.pos().y())
if __name__ == '__main__':
app = QtWidgets.QApplication(sys.argv)
mywindow = MyWindow()
mywindow.show()
sys.exit(app.exec_())After you have finished talking about the ui, use the tool to automatically convert it into a py file, as long as the ui contains these three components and their names correspond to each other.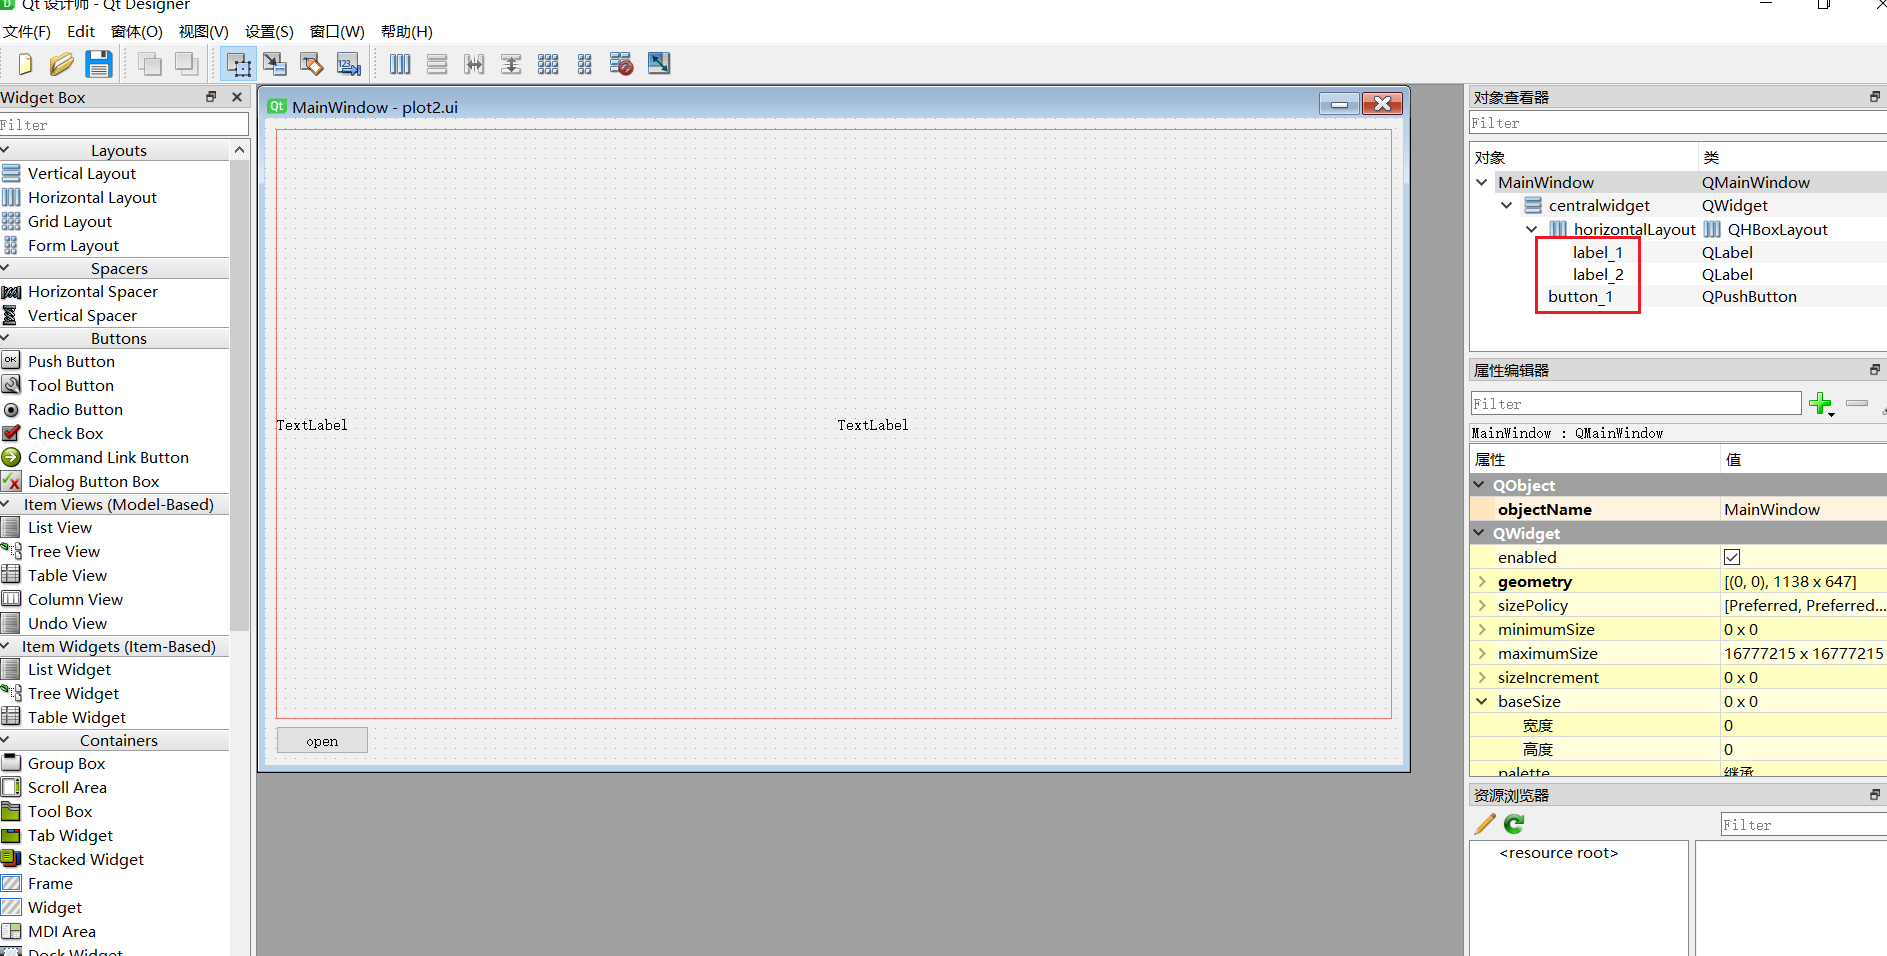
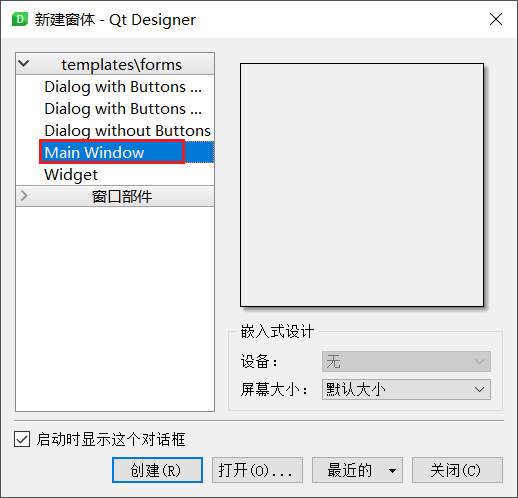
There are also some situations here. At the beginning, the selected forms are Dialog and widget. Both of them have tried, but the total preview of the running interface is inconsistent, but it is consistent if there is no layout. I couldn't do it for a long time. Finally, I changed it to the Main Window window window. It's OK.
Some other problems were encountered:
(1) At the beginning, I tried to load the dynamic ui, that is, it is not converted to py file, but the mouse event is needed later. There is no way to rewrite the mouse event function
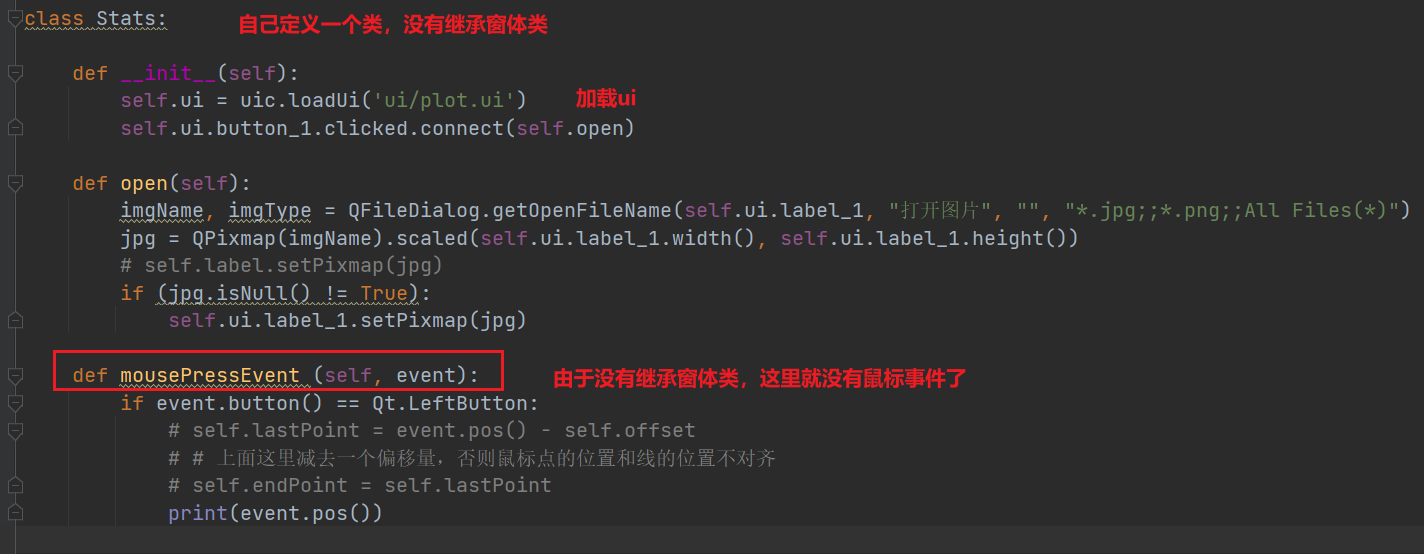
After converting it to py, it is easier to rewrite
(2) another problem is how to display the picture drawn by plot in the label component. There must be a method, but I don't know yet. The last method is stupid, that is, first save the picture drawn by plot as a picture, and then load the picture by label. Later, we will study the less stupid method.
(3) You should also convert the coordinates of the mouse click position to the coordinates in the corresponding image, and restrict the coordinates to draw only when they are inside the image.