Prometheus time series database - Calculation of alarm
In the previous article, the author described Prometheus's data insertion, storage and query in detail. But as a monitoring artifact, alarm calculation function is essential. The natural Prometheus also provides flexible and powerful alarm rules that allow us to play freely. In this article, the author will take the reader to see how Prometheus handles alarm rules.
Alarm architecture
Prometheus is only responsible for alarm calculation, and the specific alarm triggering is completed by AlertManager. If we don't want to change the AlertManager to complete the custom routing rules, we can also connect to another system through webhook (for example, a program that converts to kafka).
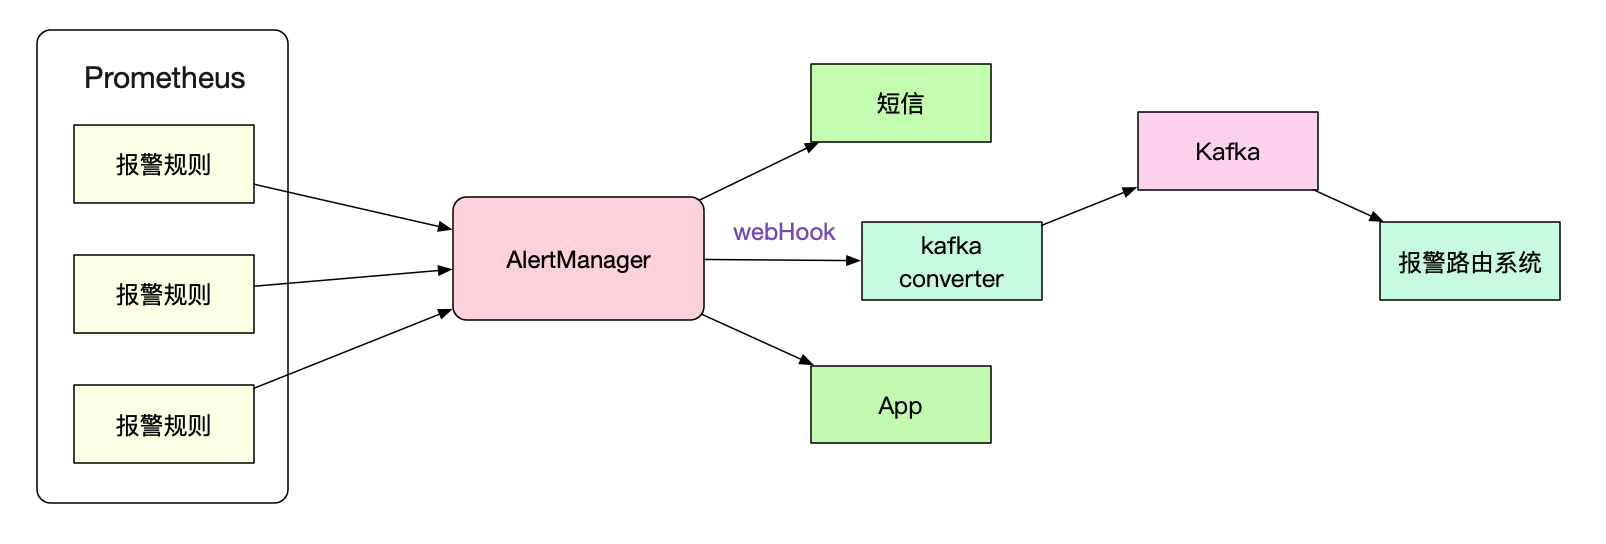
In this article, the author will not design alertManager, but focus on the calculation logic of Prometheus's own alarm rules.
One of the simplest alarm rules
rules:
	alert: HTTPRequestRateLow
	expr: http_requests < 100
	for: 60s
	labels:
		severity: warning
	annotations:
		description: "http request rate low"
The above rule is that if the number of http requests is less than 100 and lasts for 1min, we will start the alarm, and the alarm level is warning
When will this calculation be triggered
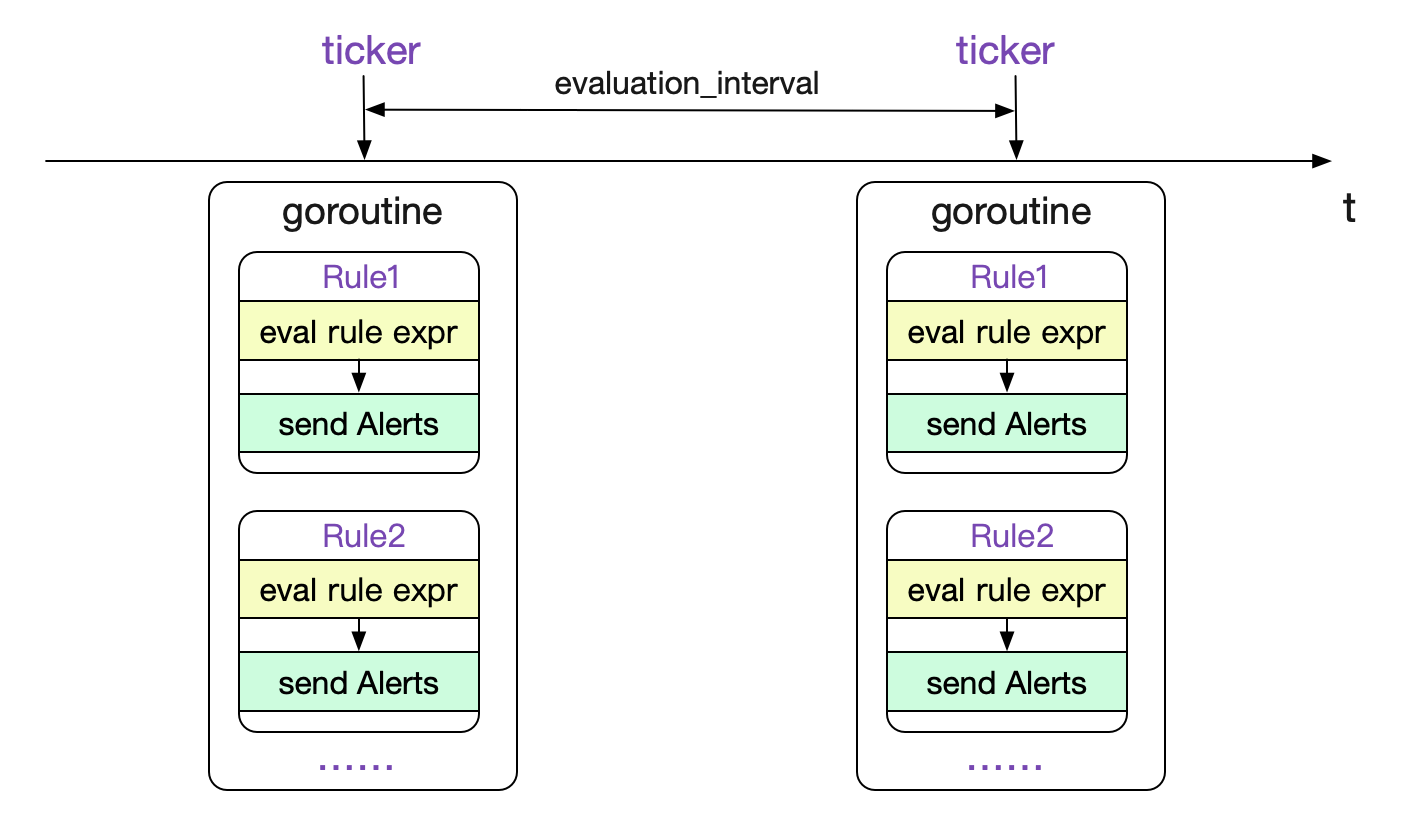
After loading the Rules, Prometheus follows the evaluation_interval is a global configuration to constantly calculate Rules. The code logic is as follows:
rules/manager.go

func (g *Group) run(ctx context.Context) {
	iter := func() {
		......
		g.Eval(ctx,evalTimestamp)
		......
	}
	// g.interval = evaluation_interval
	tick := time.NewTicker(g.interval)
	defer tick.Stop()
	......
	for {
		......
		case <-tick.C:
			......
			iter()
	}
}
The call of g.Eval is:
func (g *Group) Eval(ctx context.Context, ts time.Time) {
	// For all rule s
	for i, rule := range g.rules {
		......
		// First calculate whether there is data conforming to the rule
		vector, err := rule.Eval(ctx, ts, g.opts.QueryFunc, g.opts.ExternalURL)
		......
		// Then send
		ar.sendAlerts(ctx, ts, g.opts.ResendDelay, g.interval, g.opts.NotifyFunc)
	}
	......
}
The whole process is shown in the figure below:
Calculation of a single rule
As we can see, the most important thing is rule Eval this function. The code is as follows:
func (r *AlertingRule) Eval(ctx context.Context, ts time.Time, query QueryFunc, externalURL *url.URL) (promql.Vector, error) {
	// NewInstantQuery was finally called
	res, err = query(ctx,r.vector.String(),ts)
	......
	// Alarm assembly logic
	......
	// active alarm state transition
}
This Eval contains all logic for the calculation / assembly / transmission of alarms. We first focus on the most important computational logic. That is, the query. In fact, this query is a simple encapsulation of NewInstantQuery.
func EngineQueryFunc(engine *promql.Engine, q storage.Queryable) QueryFunc {
	return func(ctx context.Context, qs string, t time.Time) (promql.Vector, error) {
		q, err := engine.NewInstantQuery(q, qs, t)
		......
		res := q.Exec(ctx)
	}
}
That is, it performs a query for an instantaneous vector. The query expression is based on the alarm rule given earlier, that is
http_requests < 100
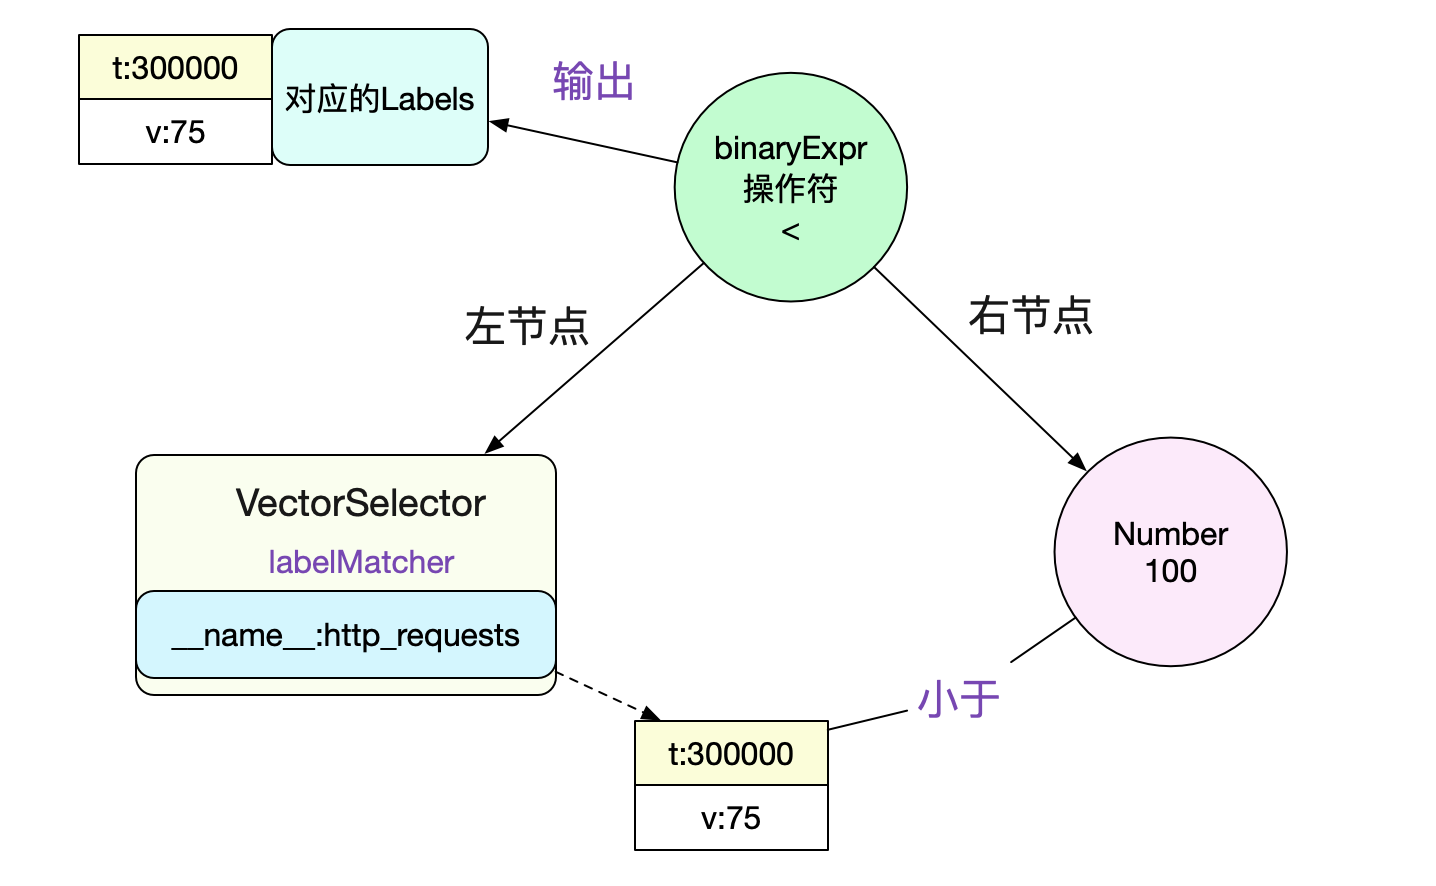
Since you want to evaluate the expression, the first step must be to construct it into an AST. The tree structure is shown in the following figure:
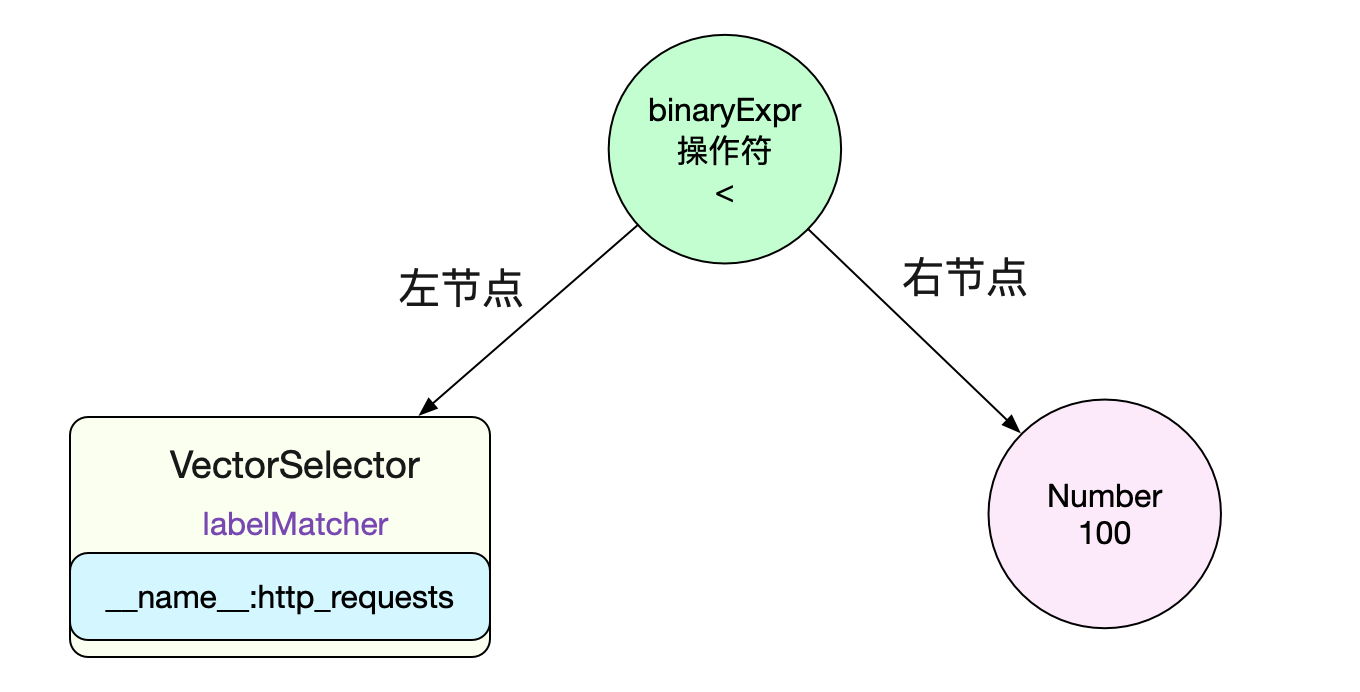
It is resolved that the left node is a VectorSelect and its lablelMatcher is
__name__:http_requests
Then we can evaluate the left node VectorSelector. You can directly use the inverted index to query in the head (because the instant query is the current time, it must be in memory).
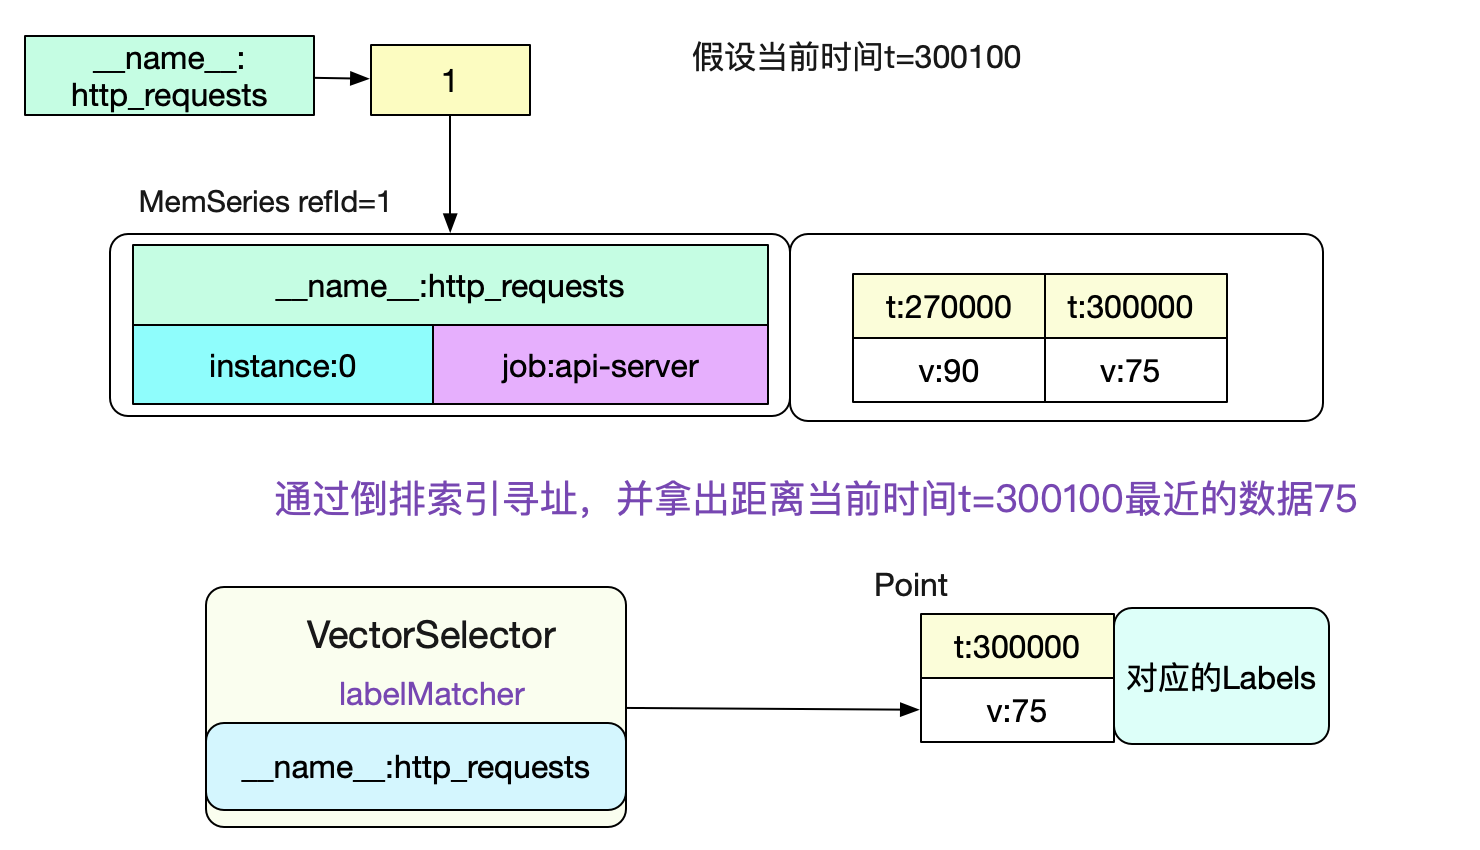
To know the specific calculation process, see the author's previous blog Prometheus time series database - data query. After calculating the data of the left node, we can compare it with the right node to calculate the final result. The specific code is:
func (ev *evaluator) eval(expr Expr) Value {
	......
	case *BinaryExpr:
	......
		case lt == ValueTypeVector && rt == ValueTypeScalar:
			return ev.rangeEval(func(v []Value, enh *EvalNodeHelper) Vector {
				return ev.VectorscalarBinop(e.Op, v[0].(Vector), Scalar{V: v[1].(Vector)[0].Point.V}, false, e.ReturnBool, enh)
			}, e.LHS, e.RHS)
	.......
}
The last function called is:
func (ev *evaluator) VectorBinop(op ItemType, lhs, rhs Vector, matching *VectorMatching, returnBool bool, enh *EvalNodeHelper) Vector {
	// All data sample s calculated for the left node
	for _, lhsSample := range lhs {
		......
		// Because LV = 75 on the left < rv = 100 on the right, and op is less
		/**
			vectorElemBinop(){
				case LESS
					return lhs, lhs < rhs
			}
		**/
		// The result obtained here is value = 75 and keep = true
		value, keep := vectorElemBinop(op, lv, rv)
		......
		if keep {
			......
			// Here 75 is put into the output, that is to say, we did get the data in the final calculation.
			enh.out = append(enh.out.sample)
		}
	}
}
As shown in the figure below:
Finally, our expr output is
sample {
	Point {t:0,V:75}
	Metric {__name__:http_requests,instance:0,job:api-server}

}
Alarm state transition
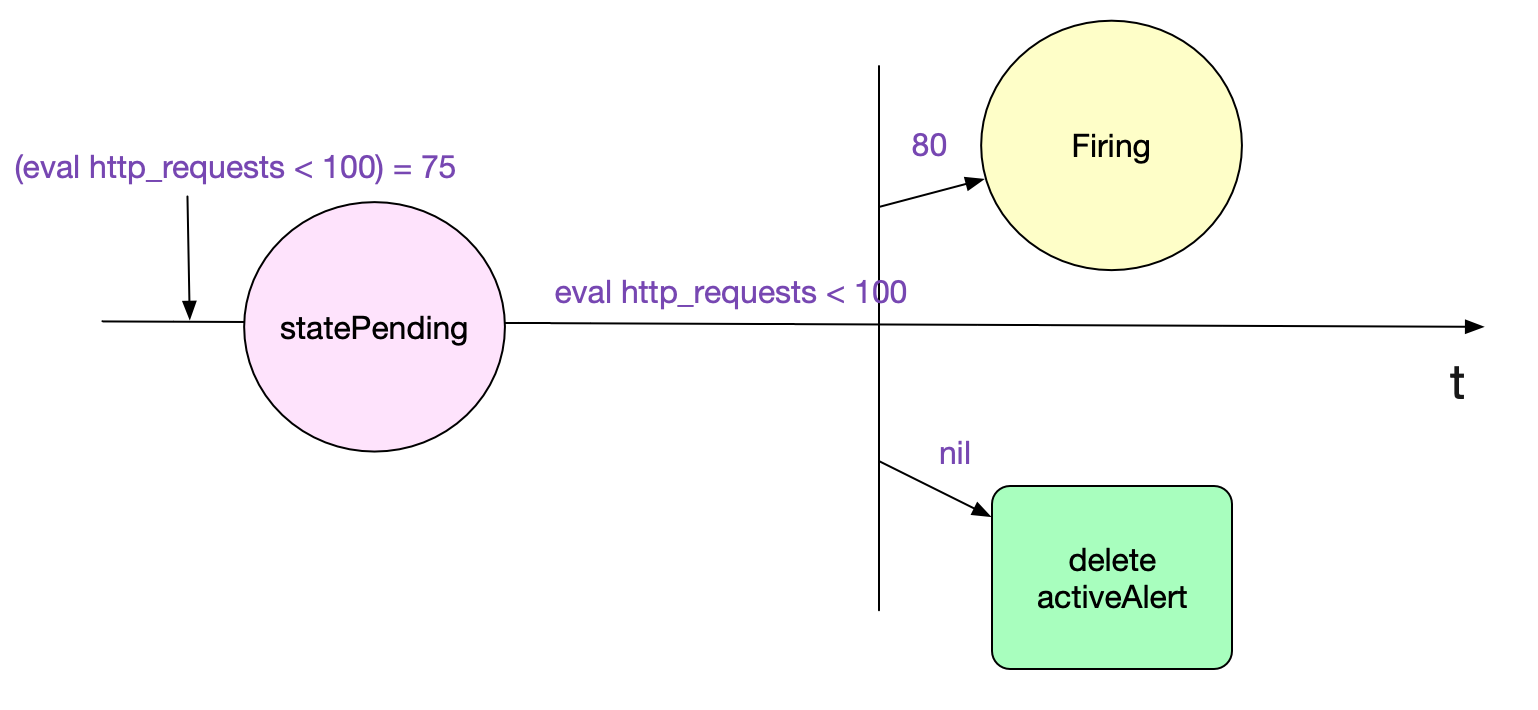
After the calculation process is finished, the author also talks about the state change of the alarm, that is, the for in the rule in the initial alarm rule, that is, the alarm lasts for(1min in the rule), and we really alarm. In order to achieve this function, a state machine is needed. Here, the author only expounds the logic from pending - > firing.
In the previous Eval method, there is the following paragraph
func (r *AlertingRule) Eval(ctx context.Context, ts time.Time, query QueryFunc, externalURL *url.URL) (promql.Vector, error) {
	for _, smpl := range res {
	......
			if alert, ok := r.active[h]; ok && alert.State != StateInactive {
			alert.Value = smpl.V
			alert.Annotations = annotations
			continue
		}
		// If this alarm is not in the active map, put it in the active map
		// Note that the hash here still has no zipper method, and there is a minimal probability hash conflict
r.active[h] = &Alert{
			Labels:      lbs,
			Annotations: annotations,
			ActiveAt:    ts,
			State:       StatePending,
			Value:       smpl.V,
		}
	}
	......
	// Transition logic of alarm state
	for fp, a := range r.active {
		// If the current r.active alarm is no longer in the result just calculated 		 if _, ok := resultFPs[fp]; !ok {
			// If the status is Pending to be sent
			if a.State == StatePending || (!a.ResolvedAt.IsZero() && ts.Sub(a.ResolvedAt) > resolvedRetention) {
				delete(r.active, fp)
			}
			......
			continue
		}
		// For an existing Active alarm, if its Active time is > r.holdduration, it is specified by for
		if a.State == StatePending && ts.Sub(a.ActiveAt) >= r.holdDuration {
			// We set the alarm to be sent
			a.State = StateFiring
			a.FiredAt = ts
		}
		......

	}
}
The logic of the above code is shown in the figure below:
summary
Prometheus, as a monitoring artifact, provides us with a variety of traversal. Its powerful alarm calculation function is one of them. Only by understanding the calculation principle of alarm can we make better use of it.