My latest and complete articles are in Pumpkin speak slowly www.pkslow.com com , the article update is only on the official website. Welcome to tea~~
1 Introduction
Previously in the article< Getting started with Istio in service grid - detailed record of Kubernetes installing Istio and using >I have described in detail how to install and use Istio on Kubernetes on Linux system, but after all, the server needs money. A few cents an hour is a small pattern, but I still want to install and use it on Mac.
2 install Istio
Kubernetes has been installed on my computer. You can refer to it< Start Kubernetes with Docker Desktop on Mac, and finally fix it after stepping on the pit >, now install Istio directly.
Download the corresponding installation package:
$ curl -L https://istio.io/downloadIstio | sh -
The contents are as follows:

Add istioctl in bin directory to PATH.
$ export ISTIO_HOME=/Users/larry/Software/istio/istio-1.10.3
$ export PATH=$PATH:$ISTIO_HOME/bin
Check if the installation can be performed:
$ istioctl x precheck
✔ No issues found when checking the cluster. Istio is safe to install or upgrade!
If there is no problem, you can start the installation:
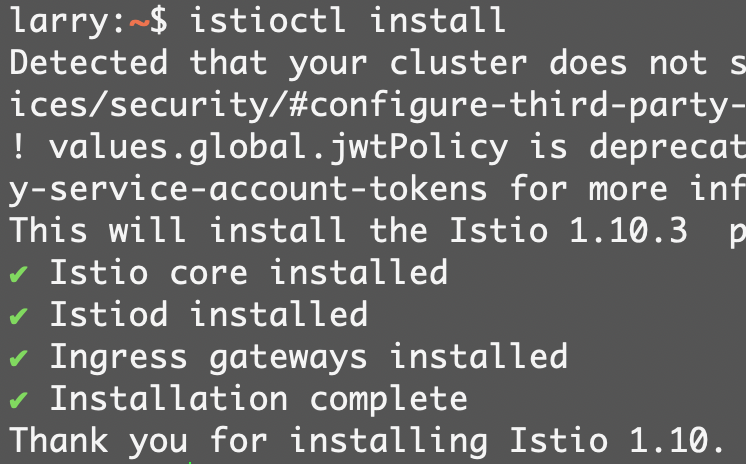
$ istioctl install
It takes some time to download the image. The successful installation is as follows:
You can do some simple checks:
# Check the Pod in the istio system command space
$ kubectl get pod -n istio-system
# Check resources
$ kubectl api-resources | grep istio
The results are as follows:

3 using istio
3.1 injection agent
Istio does not inject agents into other pods by default. You need to add a corresponding label to the Namespace:
$ kubectl label namespace default istio-injection=enabled
However, the existing Pod will not be injected. It doesn't matter. Let's use the officially provided examples to create some new resources:
$ kubectl apply -f istio-1.10.3/samples/bookinfo/platform/kube/bookinfo.yaml
It takes a long time to download the image because it is started for the first time, as shown in the following command:
$ watch 'kubectl get pod -l app -l version'
A few minutes later, it was finally done:

You can see that each Pod has two containers, one for application and the other for agent.
3.2 installation of monitoring plug-in
To better visually monitor the application, let's install some plug-ins:
$ kubectl apply -f istio-1.10.3/samples/addons
Same wait:
$ watch 'kubectl get pod -n istio-system'
After about 5 minutes, it was successfully started:

You can see many common monitoring software: Grafana, Prometheus, etc.
3.3 accessing resources externally
Istio provides us with the function of Gateway. We create a Gateway external exposure service for the application:
$ kubectl apply -f istio-1.10.3/samples/bookinfo/networking/bookinfo-gateway.yamlgateway.networking.istio.io/bookinfo-gateway createdvirtualservice.networking.istio.io/bookinfo created$ kubectl get gatewayNAME AGEbookinfo-gateway 17s$ kubectl get virtualservices.networking.istio.ioNAME GATEWAYS HOSTS AGEbookinfo ["bookinfo-gateway"] ["*"] 29s
Because I installed Ingress Controller a long time ago( Kubernetes installed Ingress with Helm and stepped on the pit used ), in order to prevent conflicts, delete the original:
# Install command, do not execute# helm install azure-ingress azure/nginx-ingress# Delete ingress controllerhelm delete azure ingress
Then you can access the application normally: http://localhost/productpage
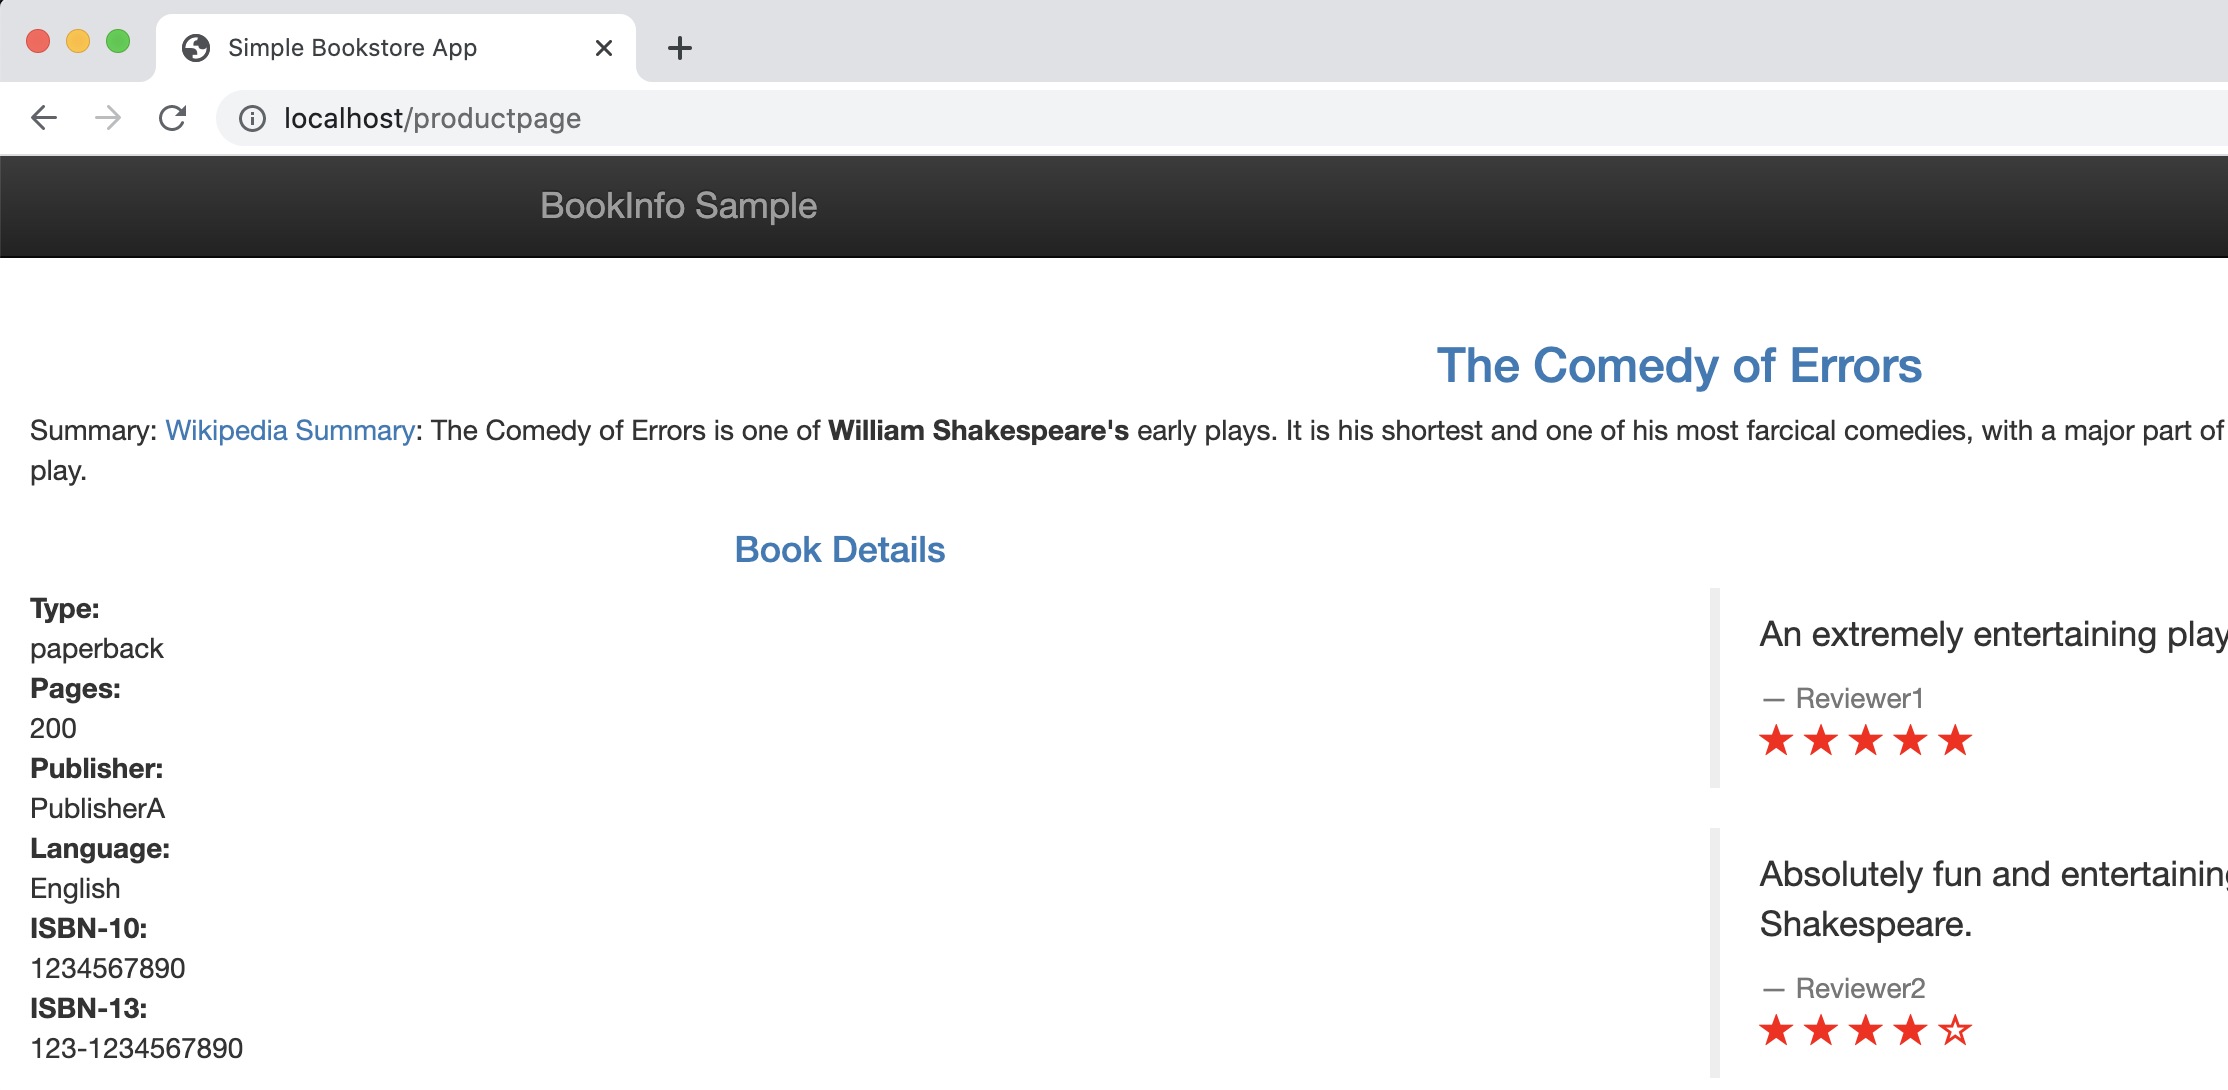
We can click more times and refresh more times to generate more traffic for subsequent viewing and monitoring.
3.4 view monitoring
Similarly, we also need to access the monitored content externally. Visit kiali as follows, which will directly open the browser for us:
$ istioctl dashboard kialihttp://localhost:20001/kiali
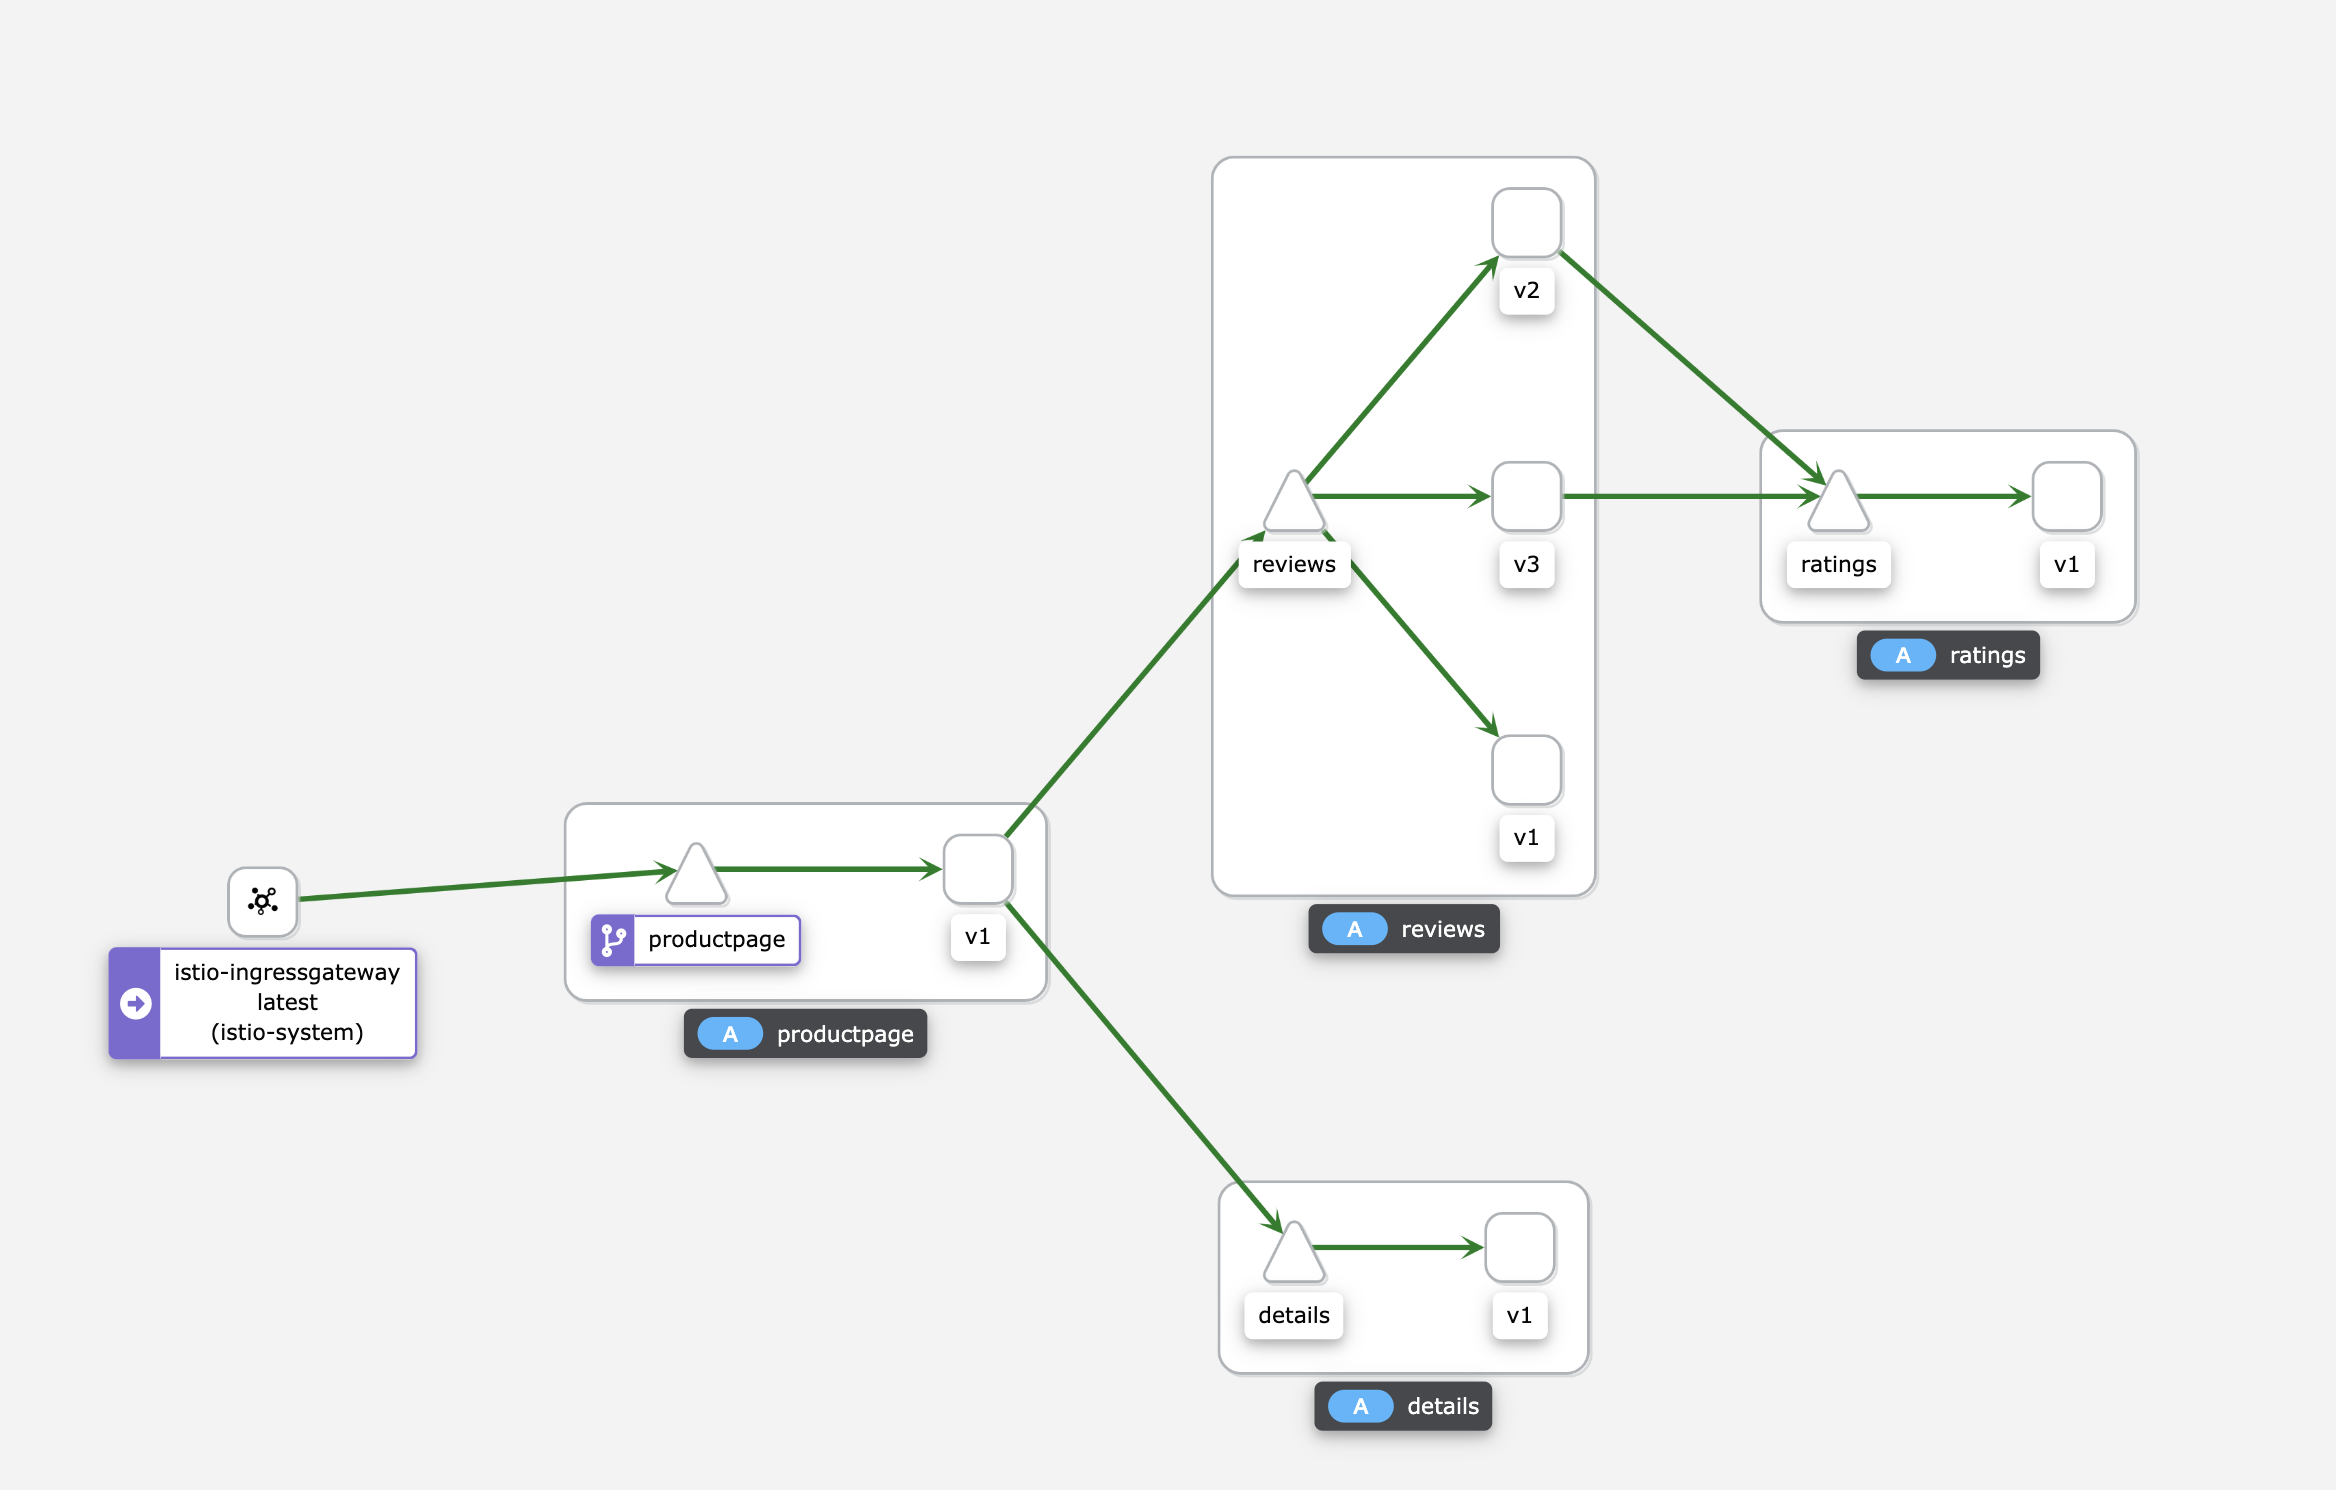
You can view the complete and clear flow trend diagram to know what components are and what the call relationship between them is:
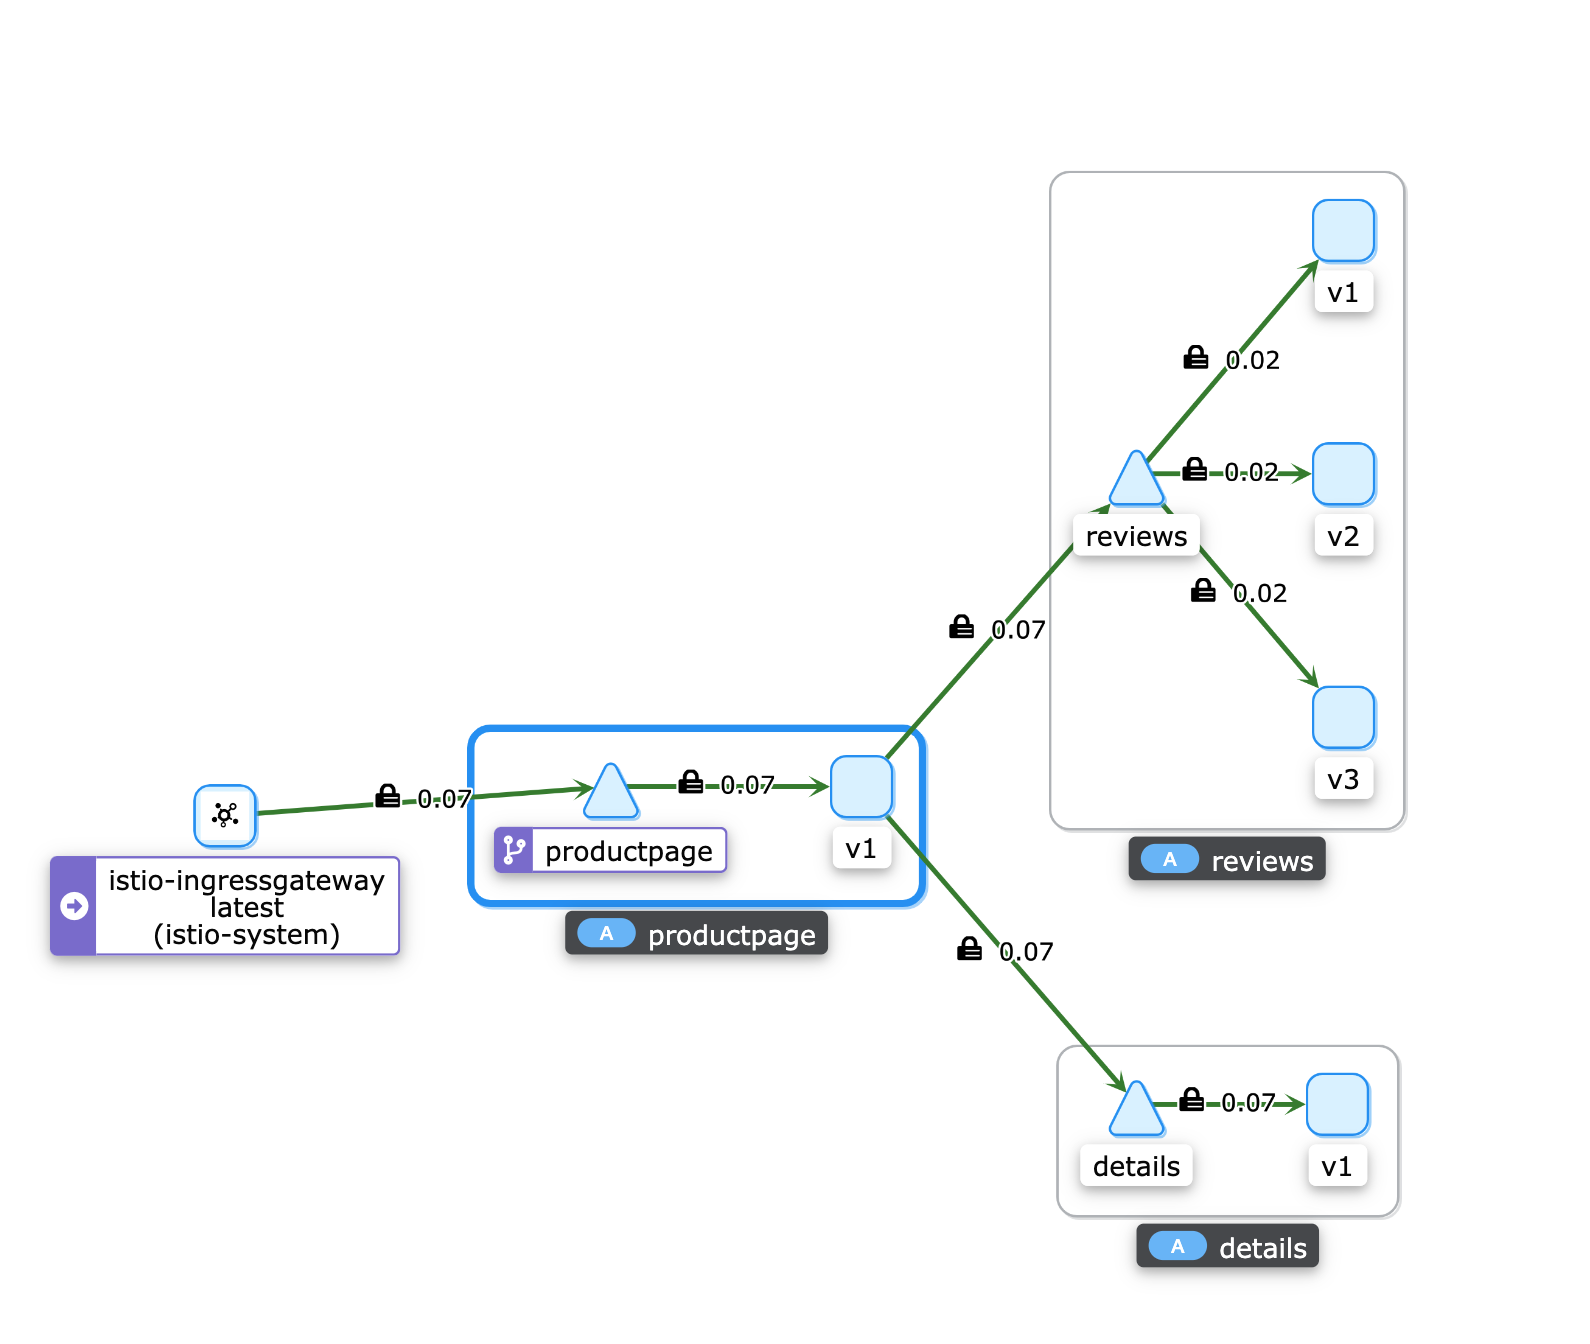
When viewing a specific component productpage, the applications and relationships directly associated with it will be displayed centered on it:
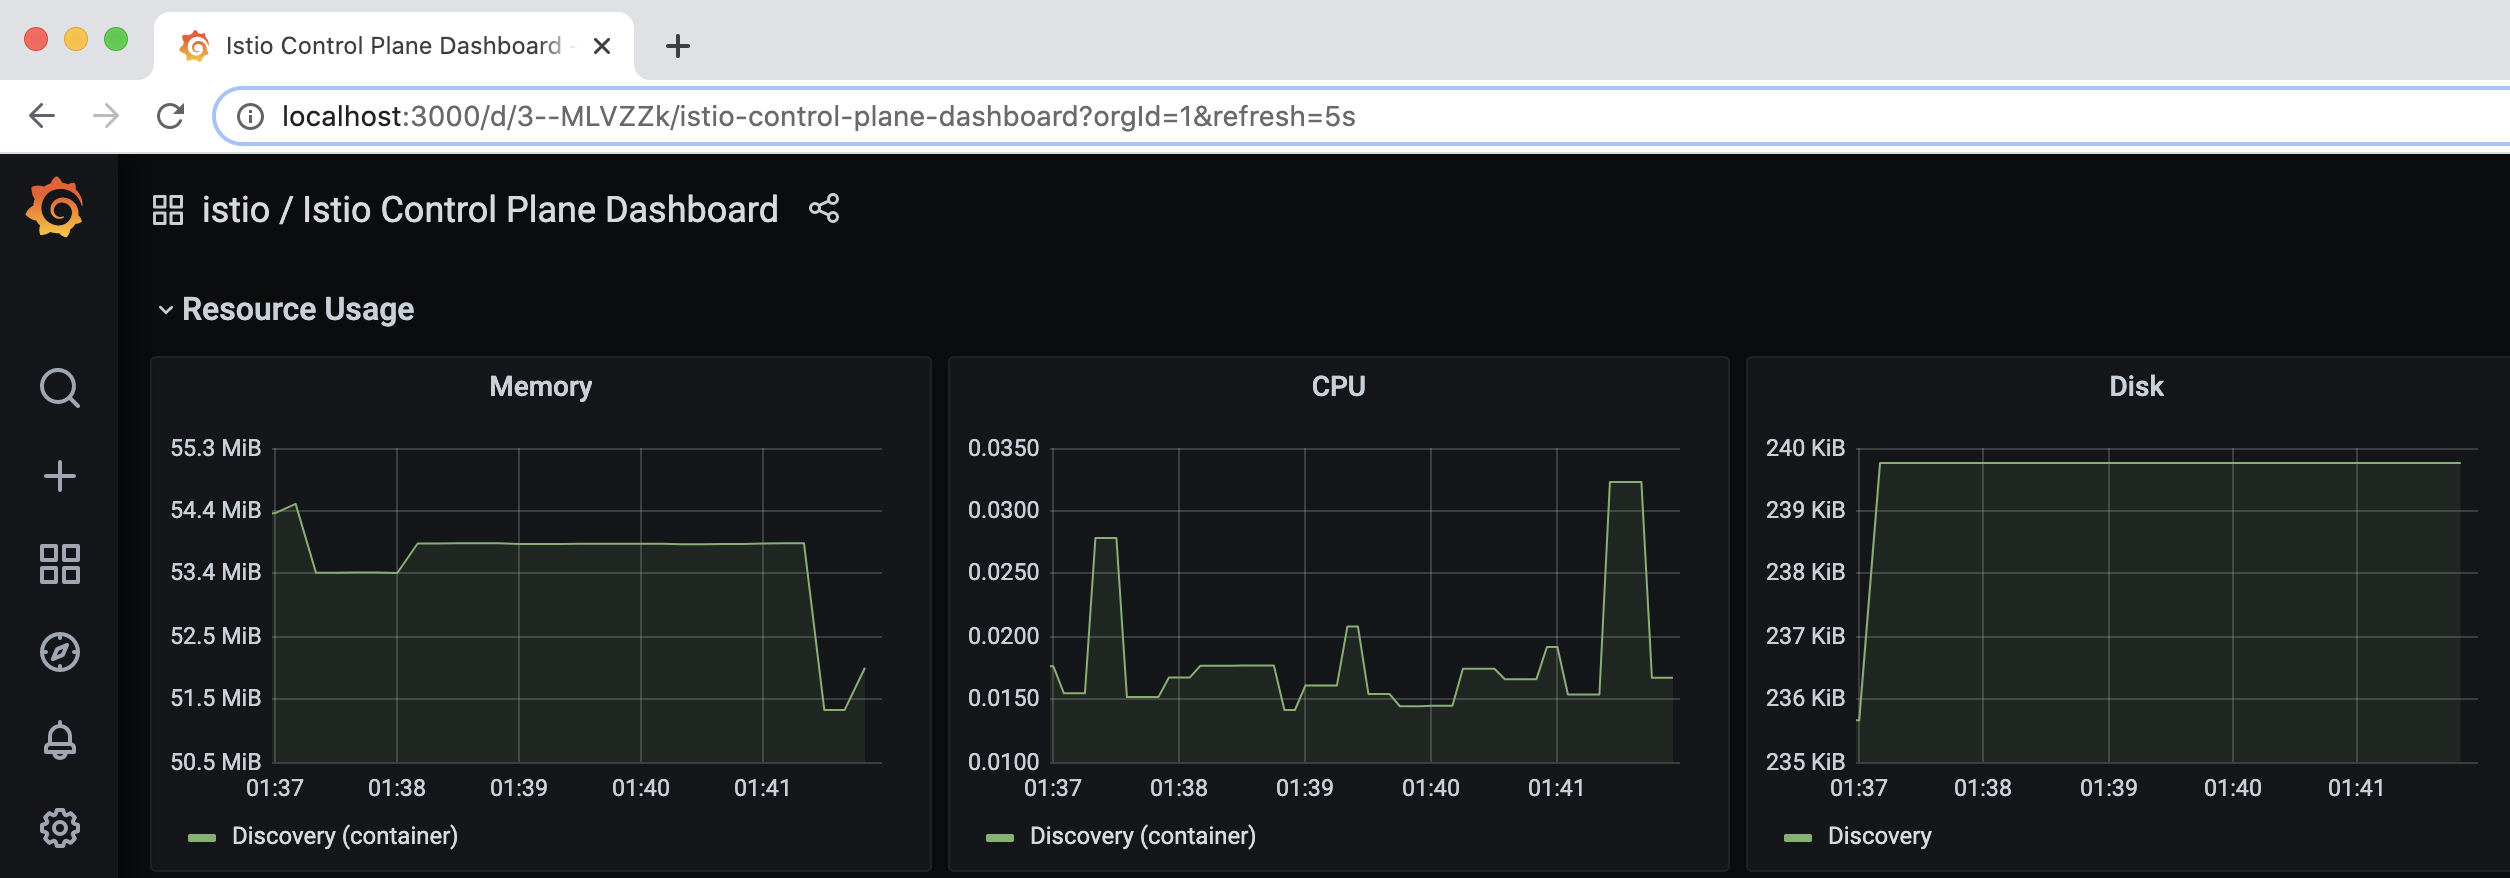
Of course, you can also view Grafana:
$ istioctl dashboard grafana
The interface is as follows:
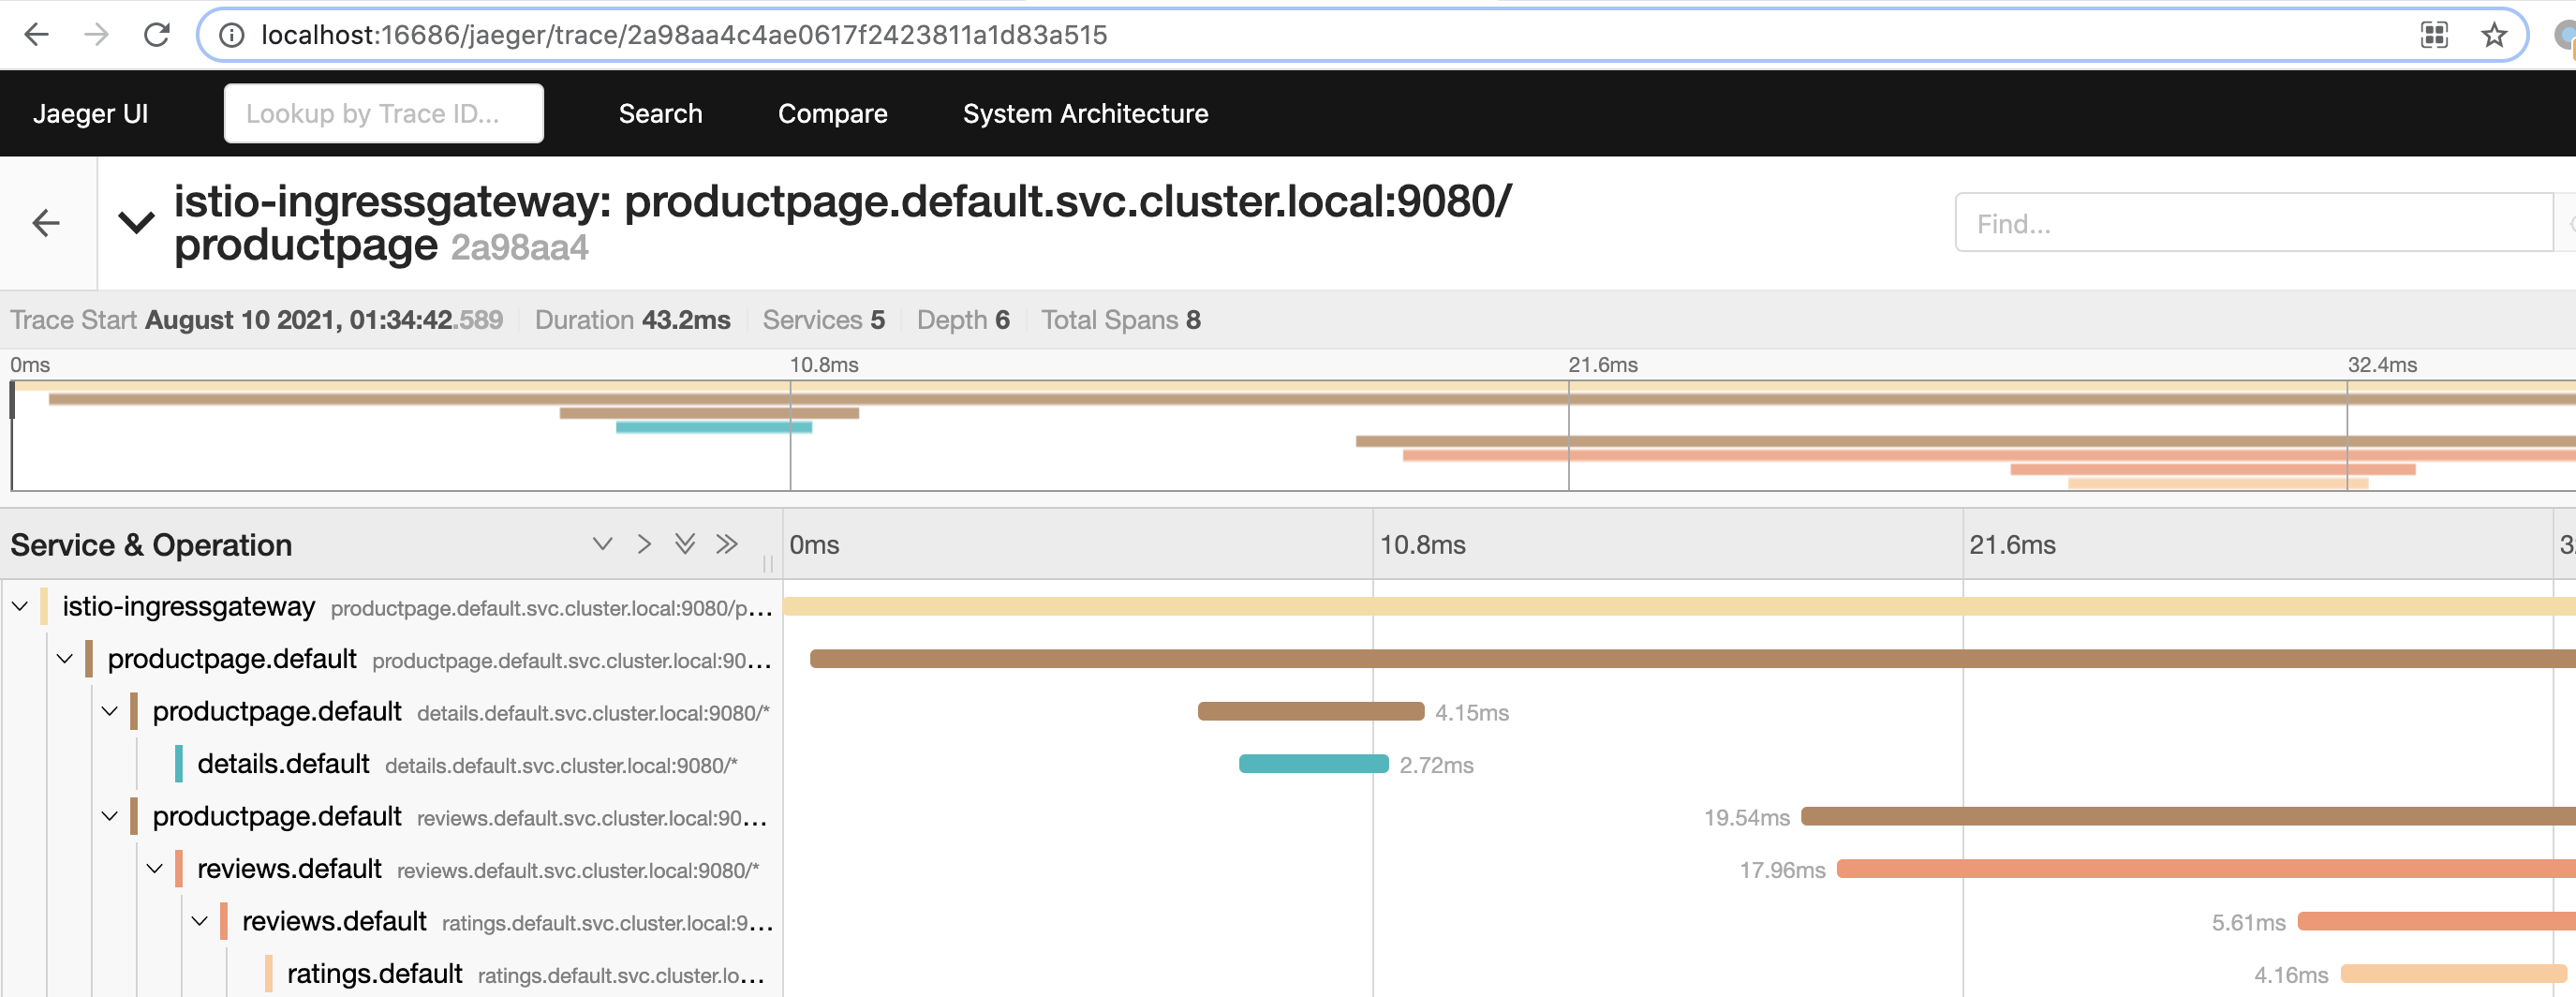
View Jaeger:
$ istioctl dashboard jaeger
The interface is as follows:
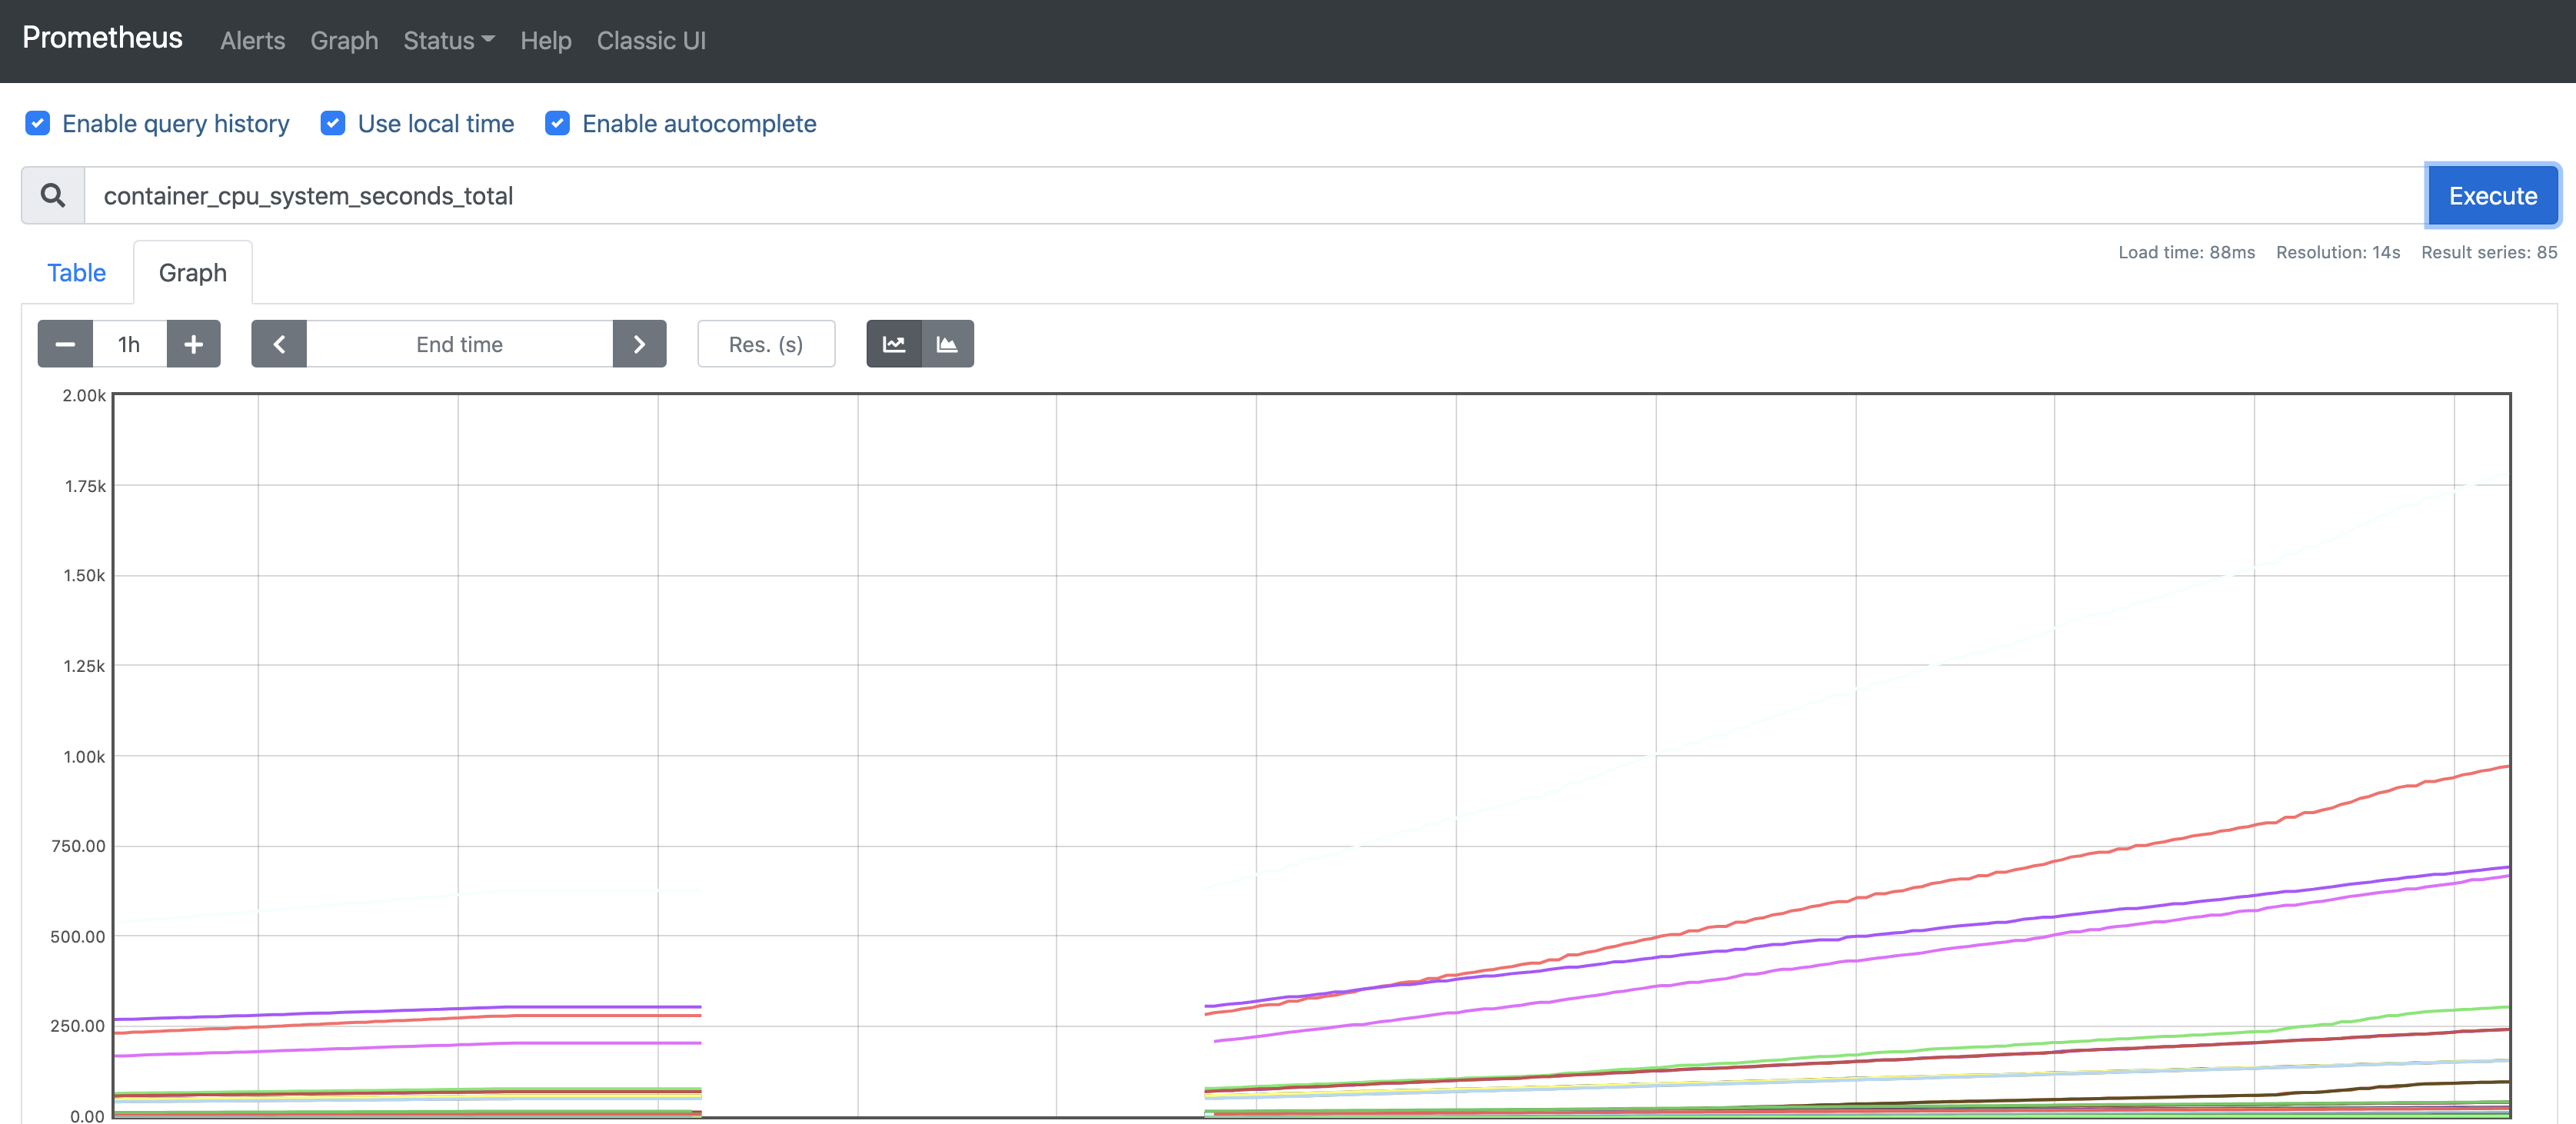
View Prometheus:
$ istioctl dashboard prometheus
The interface is as follows:
summary
Istio has provided us with many useful features, and the optical monitoring is very rich. Let's discuss more details later.