1, What is ELK?
Generally speaking, ELK is a combination of Elasticsearch, Logstash and Kibana. Among the three open source software, each software is used to complete different functions. ELK is also called ELK stack, and the official domain name is stactic Co, ELK stack has the following main advantages:
- Flexible processing: elastic search is a real-time full-text index with powerful search function
- The configuration is relatively simple: elasticsearch uses JSON interface, logstash uses module configuration, and kibana's configuration file is simpler.
- Efficient retrieval performance: Based on excellent design, although each query is real-time, it can also achieve the query second response of 10 billion data.
- Cluster linear expansion: both elastic search and logstash can be expanded flexibly and linearly
- Gorgeous front-end operation: kibana's front-end design is gorgeous and easy to operate
1. What is Elasticsearch?
It is a highly scalable open-source full-text search and analysis engine, which can realize real-time full-text search of data, support distributed and real ### ELK, and introduce common architectures and usage scenarios:

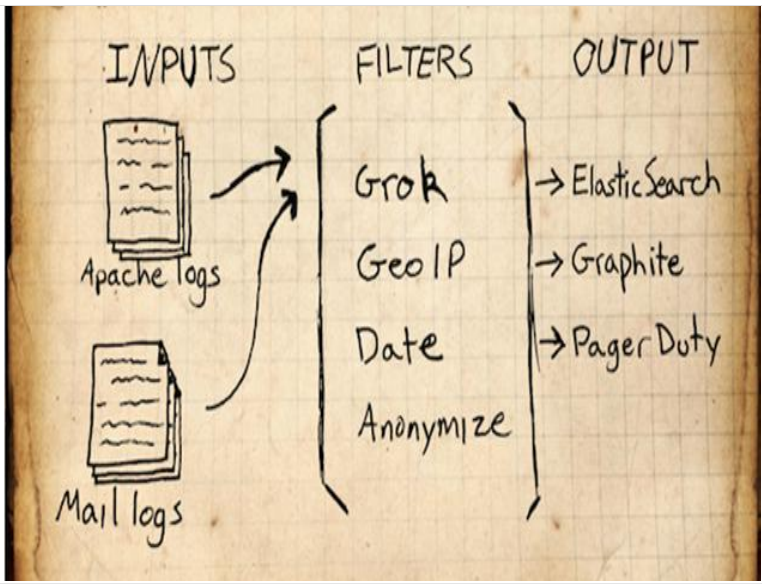
2. What is Logstash?
You can collect and forward logs through plug-ins, support log filtering, and support log parsing in common log and custom json formats.
3. What is kibana:
It mainly calls the data of elasticsearch through the interface and visualizes the front-end data

2, Introduction to common ELK architectures and usage scenarios:
ELK usage scenario:
- Log platform: using the fast retrieval function of elastic search, you can quickly query the required logs in a large amount of data.
- Order platform: use the rapid retrieval function of elastic search to retrieve the orders we need from a large number of orders.
- Search platform: use the fast retrieval function of elastic search to retrieve the data we need from a large amount of data.
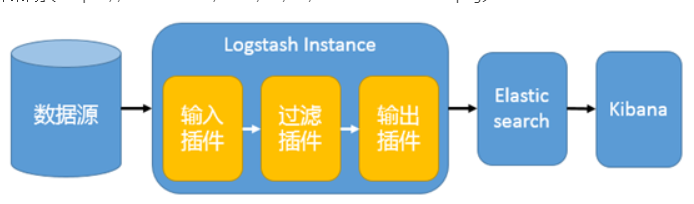
1) Simple architecture
This architecture is very simple and the use scenarios are limited. Beginners can build this architecture to understand how ELK works; In this architecture, there is only one instance of logstash, Elasticsearch, and Kibana. Logstash obtains data from a variety of data sources (such as log files, standard input Stdin, etc.) through the input plug-in, processes the data through the filter plug-in, and then outputs it to Elasticsearch through the Elasticsearch output plug-in, which is displayed through Kibana. It is now highly available and provides API interfaces to process large-scale log data, such as Nginx, Tomcat, system log, etc.
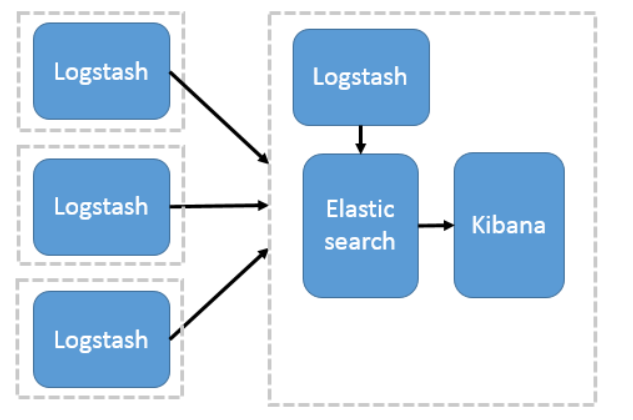
2) Use Logstash as the log collector
This structure needs to deploy Logstash on each server, which consumes CPU and memory resources. Therefore, it is more suitable for servers with rich computing resources. Otherwise, it is easy to degrade the server performance and even fail to work normally.
3) Using Beats as a log collector
This architecture introduces Beats as a log collector. At present, Beats includes four types:
- Packetbeat (collect network traffic data);
- Topbeat (collect CPU and memory usage data at system, process and file system levels);
- Filebeat (collect file data);
- Winlogbeat (collects Windows event log data).
Beats sends the collected data to Logstash. After being parsed and filtered by Logstash, beats sends it to Elasticsearch for storage and Kibana presents it to the user.
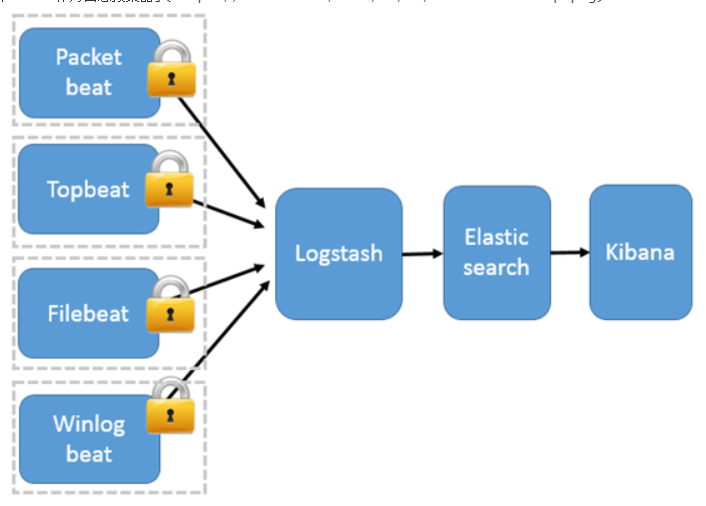

This architecture solves the problem that Logstash occupies high system resources on each server node. Compared with Logstash, Beats occupies almost negligible CPU and memory of the system. In addition, SSL/TLS encrypted transmission and two-way authentication between client and server are supported between Beats and Logstash to ensure communication security.
Therefore, this architecture is suitable for scenarios with high data security requirements and sensitive server performance.
4) Introducing message queuing mode
Beats does not support output to Message queue (except for the new version: version 5.0 and above), so there can only be logstash instances at the front and rear ends of the message queue. Logstash collects data from various data sources and only forwards it to the message queue without any processing and conversion (kafka, redis, rabbitMQ, etc.), then logstash takes the data from the message queue for transformation, analysis and filtering, outputs it to elastic search, and displays it graphically in kibana

3, Elasticsearch deployment
1. Deployment
There are three ways to deploy elasticsearch:
- rpm Package installation
- Source package installation
- docker install
Source code installation:
# Download source package
wget https://github.com/elastic/elasticsearch/archive/refs/tags/elasticsearch-7.12.1-linux-x86_64.tar.gz

# decompression
tar xf elasticsearch-7.12.1-linux-x86_64.tar.gz -C /usr/local/

# elasticsearch is Java dependent
yum install java-1.8.0* -y

# Validate Java
[root@es-01 ~]# java -version
openjdk version "1.8.0_292"
OpenJDK Runtime Environment (build 1.8.0_292-b10)
OpenJDK 64-Bit Server VM (build 25.292-b10, mixed mode)
View the contents of the complete configuration file (not installed by default in the source package)
[root@es-01 ~]# cat /usr/lib/systemd/system/elasticsearch.service
[Unit]
Description=Elasticsearch
Documentation=https://www.elastic.co
Wants=network-online.target
After=network-online.target

[Service]
LimitMEMLOCK=infinity
Type=notify
RuntimeDirectory=elasticsearch
PrivateTmp=true
Environment=ES_HOME=/usr/share/elasticsearch
Environment=ES_PATH_CONF=/etc/elasticsearch
Environment=PID_DIR=/var/run/elasticsearch
Environment=ES_SD_NOTIFY=true
EnvironmentFile=-/etc/sysconfig/elasticsearch

WorkingDirectory=/usr/share/elasticsearch

User=elasticsearch
Group=elasticsearch

ExecStart=/usr/share/elasticsearch/bin/systemd-entrypoint -p ${PID_DIR}/elasticsearch.pid --quiet

# StandardOutput is configured to redirect to journalctl since
# some error messages may be logged in standard output before
# elasticsearch logging system is initialized. Elasticsearch
# stores its logs in /var/log/elasticsearch and does not use
# journalctl by default. If you also want to enable journalctl
# logging, you can simply remove the "quiet" option from ExecStart.
StandardOutput=journal
StandardError=inherit

# Specifies the maximum file descriptor number that can be opened by this process
LimitNOFILE=65535

# Specifies the maximum number of processes
LimitNPROC=4096

# Specifies the maximum size of virtual memory
LimitAS=infinity

# Specifies the maximum file size
LimitFSIZE=infinity

# Disable timeout logic and wait until process is stopped
TimeoutStopSec=0

# SIGTERM signal is used to stop the Java process
KillSignal=SIGTERM

# Send the signal only to the JVM rather than its control group
KillMode=process

# Java process is never killed
SendSIGKILL=no

# When a JVM receives a SIGTERM signal it exits with code 143
SuccessExitStatus=143

# Allow a slow startup before the systemd notifier module kicks in to extend the timeout
TimeoutStartSec=75

[Install]
WantedBy=multi-user.target

# Built for packages-7.12.1 (packages)
docker installation
**cluster.name: Cluster name**

docker run -p 9200:9200 -p 9300:9300 -e "cluster.name=[Cluster name]" docker.elastic.co/elasticsearch/elasticsearch:7.12.1
Installation address
ElasticSearch Official website download address: https://www.elastic.co/cn/downloads/elasticsearch
 Download address of installation package of other versions on the official website: https://www.elastic.co/cn/downloads/past-releases#elasticsearch

Official document reference:
Filebeat:
https://www.elastic.co/cn/products/beats/filebeat
https://www.elastic.co/guide/en/beats/filebeat/5.6/index.html

Logstash:
https://www.elastic.co/cn/products/logstash
https://www.elastic.co/guide/en/logstash/5.6/index.html

Kibana:
https://www.elastic.co/cn/products/kibana
https://www.elastic.co/guide/en/kibana/5.5/index.html

Elasticsearch:
https://www.elastic.co/cn/products/elasticsearch
https://www.elastic.co/guide/en/elasticsearch/reference/5.6/index.html

elasticsearch Chinese community:
https://elasticsearch.cn/
2.rpm package installation
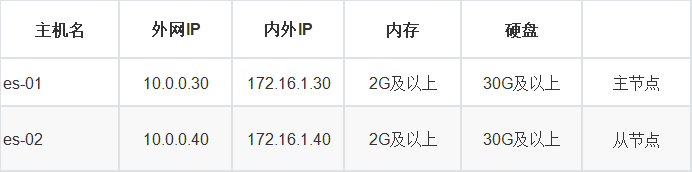
1) Node planning

2) System optimization
close selinux
[root@es01 ~]# setenforce  0
setenforce: SELinux is disabled
[root@es01 ~]# getenforce
Disabled

Turn off firewall
[root@es01 ~]# systemctl stop firewalld

close NetworkManager
[root@es01 ~]# systemctl disable --now NetworkManager

Set time zone
[root@es01 ~]# timedatectl set-timezone Asia/Shanghai

Sets the number of files that the program can open
[root@es01 ~]# vim /etc/security/limits.conf
[root@es01 ~]# grep -E ^[^#] /etc/security/limits.conf
* soft memlock unlimited
* hard memlock unlimited
* soft nofile 131072
* hard nofile 131072

restart
[root@es01 ~]# reboot
3) Download installation package
[root@es01 ~]# wget https://artifacts.elastic.co/downloads/elasticsearch/elasticsearch-7.12.1-x86_64.rpm
4) Installing the java environment
[root@es01 ~]# yum install java-1.8.0-* -y
[root@es01 ~]# java -version
openjdk version "1.8.0_292"
OpenJDK Runtime Environment (build 1.8.0_292-b10)
OpenJDK 64-Bit Server VM (build 25.292-b10, mixed mode)
5) Install elasticsearch
[root@es01 ~]# yum install java-1.8.0-* -y
6) Elastscearch sets the memory lock
=====Because the es data is in memory, if it is not locked, the es data will be unstable
[root@es01 ~]# vim /usr/lib/systemd/system/elasticsearch.service
LimitAS=infinity
LimitMEMLOCK=infinity  #Add this line below the LimitAS line in the [service] layer
[root@es01 ~]# systemctl daemon-reload
7) Modify elasticsearch lock memory size(
[root@es01 ~]# vim /etc/elasticsearch/jvm.options
-Xms1g  #Maximum locked memory 1g
-Xmx1g  #Minimum lock memory 1g
8) Modify es configuration file
[root@es-01 ~]# vim /etc/elasticsearch/elasticsearch.yml
[root@es-01 ~]# grep -E '^[^#]' /etc/elasticsearch/elasticsearch.yml

# # Set cluster name
cluster.name: es
# # Set cluster node name (node name is unique in the cluster)
node.name: node-01
# # Set data storage directory
path.data: /var/lib/elasticsearch
# # Set log storage directory
path.logs: /var/log/elasticsearch
# # Set memory lock
bootstrap.memory_lock: true
# # Set the listening IP to listen to all
network.host: 0.0.0.0
# # Set the listening port
http.port: 9200
# # Enable cross domain function
http.cors.enabled: true
http.cors.allow-origin: "*"
# # Set master node (not required for a single machine)
cluster.initial_master_nodes: node-01
# # Set the policy of participating in the election of master
discovery.zen.minimum_master_nodes: 2
# # Set node (all)
discovery.zen.ping.unicast.hosts: ["172.16.1.30","172.16.1.40"]
# # Are you qualified to participate in the election as a master node
node.master: true
be careful:
Set cluster node name (node name is unique in the cluster)
node.name: node-01
9) Configure graphical management interface
- This summary only needs to be executed by the master node, and multiple nodes can be managed through a container
- You need to use docker configuration to install the cluster head plug-in. This step needs to be executed after the test access in step 5
- For docker installation, the cluster head plug-in can be configured and installed, mainly including graphical elastic search
#1. Uninstall the old version
sudo yum remove docker \
docker-client \
docker-client-latest \
docker-common \
docker-latest \
docker-latest-logrotate \
docker-logrotate \
docker-engine
#2. Install the required installation package
sudo yum install -y yum-utils
# 3. Set the warehouse of the image
The default is foreign:
sudo yum-config-manager \
--add-repo \
https://download.docker.com/linux/centos/docker-ce.repo
Huawei cloud:
sudo yum-config-manager \
--add-repo \
https://repo.huaweicloud.com/dockerce/linux/centos/docker-ce.repo
Alibaba cloud:
sudo yum-config-manager --add-repo http://mirrors.aliyun.com/docker-ce/linux/centos/docker-ce.repo
# 4. Empty the cache
yum clean all && yum makecache fast
# 5. Install docker
yum install docker-ce docker-ce-cli containerd.io -y
# 6. Alibaba cloud accelerator
Open the alicloud official website product --> Container and Middleware --> Container and image services ACR --> Management console --> Mirror accelerator --> CentOS
sudo mkdir -p /etc/docker
sudo tee /etc/docker/daemon.json <<-'EOF'
{
"registry-mirrors": ["https://vf52ltmx.mirror.aliyuncs.com"]
}
EOF
#7. Start
sudo systemctl daemon-reload
sudo systemctl restart docker
Pull and run graphical management interface image
docker run -d -p 9100:9100 alvinos/elasticsearch-head
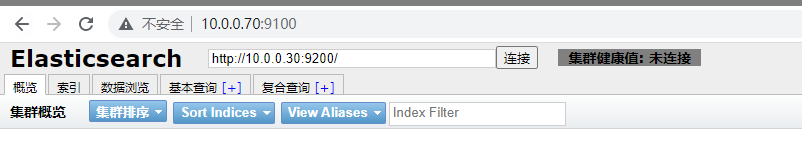
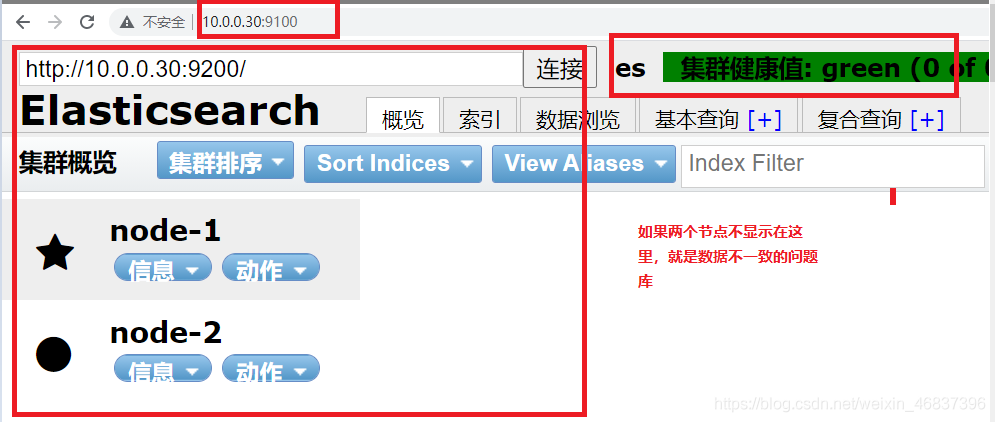
It can be accessed through the graphical interface. After adding master-slave, it can be managed through it
http://10.0. 0.30:9100 # Graphical management interface
10, Start
# start-up
systemctl start elasticsearch.service

# Start log can be monitored
[root@es-01 ~]# tailf /var/log/elasticsearch/Peng-by-es.log

# Detect boot port
[root@es-01 ~]# netstat -lntp | grep java
tcp6       0      0 :::9200                 :::*                    LISTEN      2865/java
tcp6       0      0 :::9300                 :::*                    LISTEN      2865/java
11, Test access
- **Test whether it can normally provide external services and access through IP+9200 port
http://10.0.0.30:9200
http://10.0. 0.30:9100 	#  Graphical management interface
elasticsearch monitoring
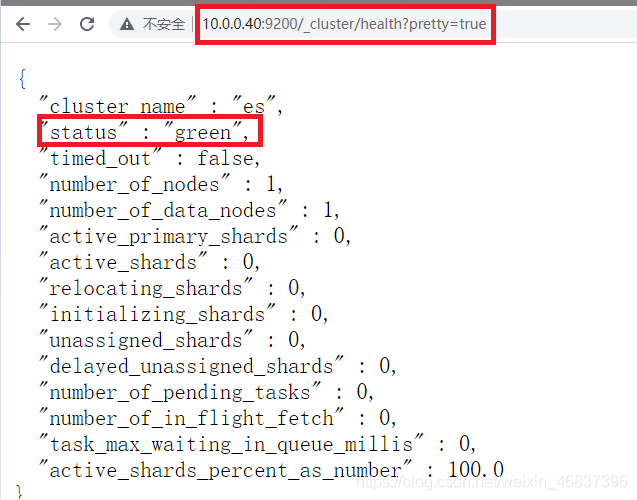
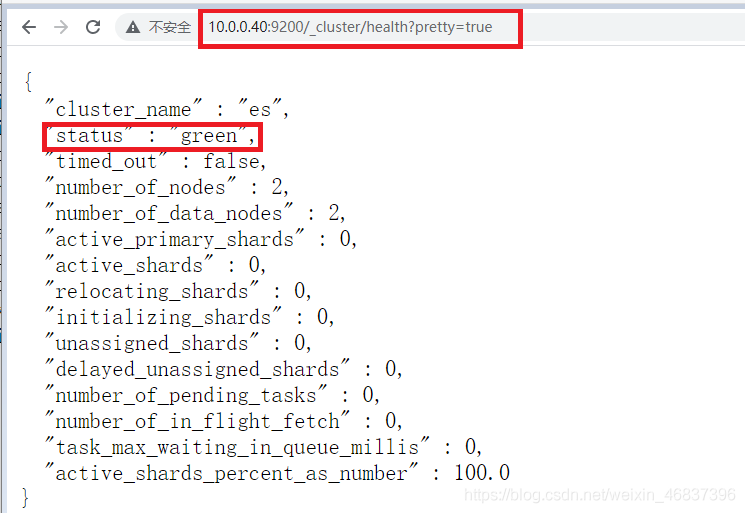
Access via browser: http://10.0.0.40:9200/_cluster/health?pretty=true For example, when status is analyzed, if it is equal to green, it is running normally. If it is equal to yellow, it means that the replica partition is lost, and red means that the primary partition is lost.
Multi node deployment (master-slave deployment)
Elastic search is separated from master-slave data nodes. According to nodes, it can also be divided into hot data nodes and cold data nodes.
-
1) Cluster node planning
2) Deploy master node es01
- Refer to the above single node deployment (including optimization), omitted~
3) Deploy slave node es-02
- Refer to the above single node deployment (including optimization), omitted~
-
Modify profile
1.Pull the of the master node and make the following modifications (the master node also needs to modify some contents)
scp 10.0.0.30:/etc/elasticsearch/elasticsearch.yml  /etc/elasticsearch/

# # Set cluster name
cluster.name: es
# # Set cluster node name (node name is unique in the cluster)
node.name: node-01
# # Set data storage directory
path.data: /var/lib/elasticsearch
# # Set log storage directory
path.logs: /var/log/elasticsearch
# # Set memory lock
bootstrap.memory_lock: true
# # Set the listening IP to listen to all
network.host: 0.0.0.0
# # Set the listening port
http.port: 9200
# # Enable cross domain function
http.cors.enabled: true
http.cors.allow-origin: "*"
# # Set master node (not required for a single machine)
cluster.initial_master_nodes: node-01
# # Set the policy of participating in the election of master
discovery.zen.minimum_master_nodes: 2
# # Set node (all)
discovery.zen.ping.unicast.hosts: ["172.16.1.30","172.16.1.40"]
# # Are you qualified to participate in the election as a master node
node.master: true

2.Set cluster node name (node name is unique in the cluster)
node.name: node-02

# # Set cluster name
cluster.name: es
# # Set cluster node name (node name is unique in the cluster)
node.name: node-02
# # Set data storage directory
path.data: /var/lib/elasticsearch
# # Set log storage directory
path.logs: /var/log/elasticsearch
# # Set memory lock
bootstrap.memory_lock: true
# # Set the listening IP to listen to all
network.host: 0.0.0.0
# # Set the listening port
http.port: 9200
# # Enable cross domain function
http.cors.enabled: true
http.cors.allow-origin: "*"
# # Set master node (not required for a single machine)
cluster.initial_master_nodes: node-01
# # Set the policy of participating in the election of master
discovery.zen.minimum_master_nodes: 2
# # Set node (all)
discovery.zen.ping.unicast.hosts: ["172.16.1.30","172.16.1.40"]
# # Are you qualified to participate in the election as a master node
node.master: false

================================================================================

Explanation:
node.name: es-01 		# Not participating in the election as a master node
node.data: true			# Allow data to be stored

Recommendation: master node nodes Set to the name of the master node, not recommended ip
cluster.initial_master_nodes: node-01

Reference configuration in production environment:
By default, each node has the qualification to become the master node. It also stores data and processes requests from clients;
In production, it is recommended to set more than 3 nodes in the cluster as master Node[ node.master: true node.data: false];
These nodes are only responsible for becoming master nodes and maintaining the status of the whole cluster;
Then set a batch according to the amount of data data Node[ node.master: false node.data: true].
4) Configure graphical management interface
- This summary only needs to be executed by the master node, and multiple nodes can be managed through a container
- You need to use docker configuration to install the cluster head plug-in. This step needs to be executed after the test access in step 5
-
For docker installation, the cluster head plug-in can be configured and installed, mainly including graphical elastic search
5) Start
systemctl start elasticsearch.service

PS:
This step is extremely prone to data inconsistency. It seems that it can be accessed normally when it is reflected on the login page,In fact, it is UUTD Yes, if there is a startup error in the middle, check whether the configuration file is configured incorrectly and restart.

resolvent:
rm -rf /var/lib/elasticsearch/*
systemctl restart elasticsearch.service
Test access
http://10.0.0.30:9200
http://10.0.0.40:9200

http://10.0. 0.30:9100 	#  Graphical management interface
jyh-node-01	# Master node
jyh-node-02	# Slave node
As an Http protocol, 9200 is mainly used for external communication
9300 as TCP protocol, jar s communicate with each other through TCP protocol
The ES clusters communicate with each other through 9300
resolvent:
#Troubleshooting of fault reporting:
This step is extremely prone to data inconsistency. When you log in to the web page, it seems that you can access it normally. In fact, it is very difficult UUID Is wrong. To do this, you can delete it first/var/lib/elasticsearch/*The following things, and then restart elasticsearch. That's it.
[root@es-02 ~]# systemctl stop elasticsearch.service
[root@es-02 ~]# rm -rf /var/lib/elasticsearch/*
[root@es-02 ~]# tail -f /var/log/elasticsearch/elaina-es.log  #Real time monitoring cluster logs to find problems
[root@es-02 ~]# systemctl start elasticsearch.service  #Execute start command for new window
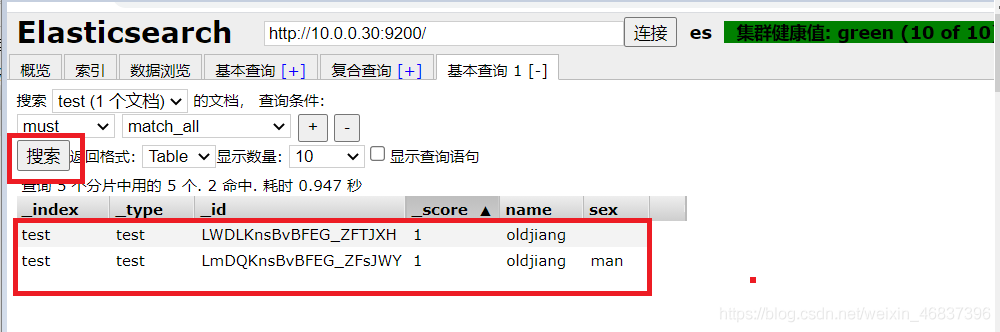
4, Test cluster performance
-
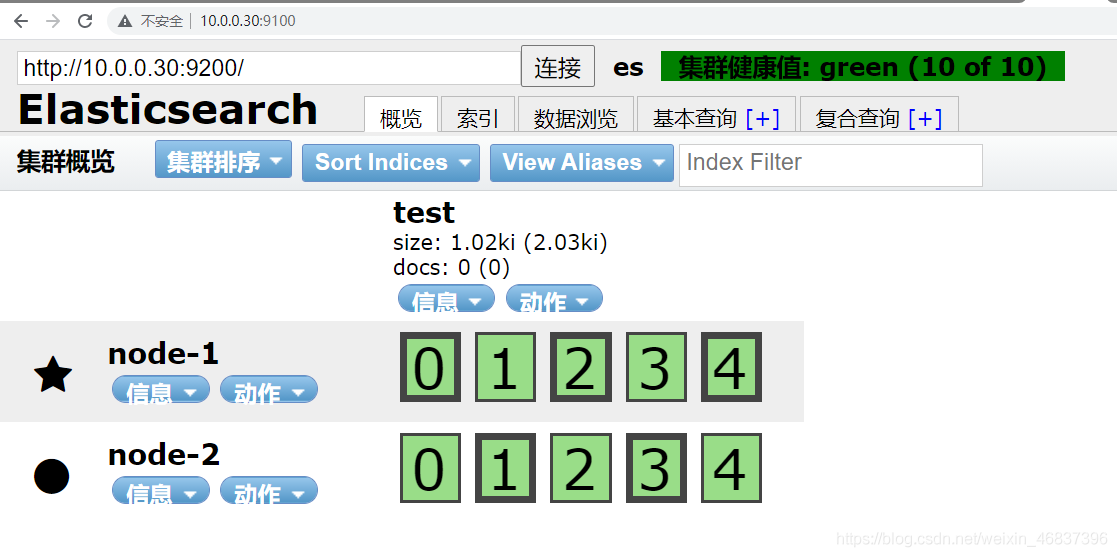
New index

-
Click overview to view
-
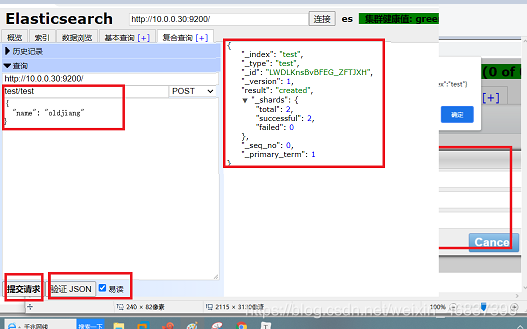
Click compound query
-
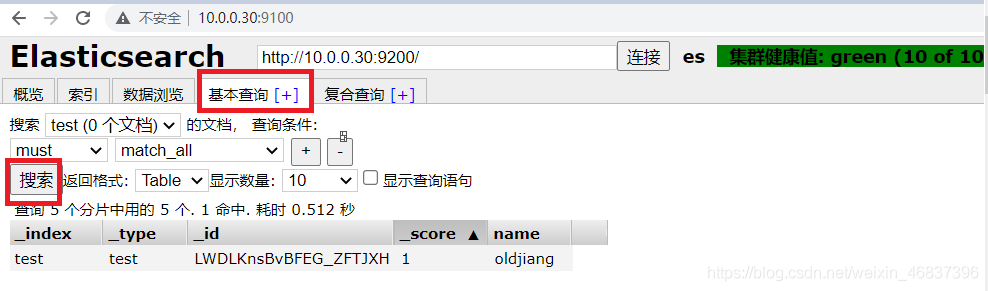
Click basic query
Add again

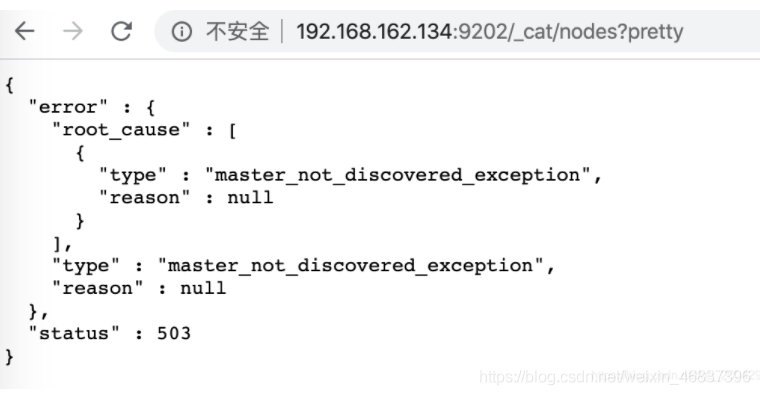
5, Supplement: after the es cluster is started, report to the master_not_discovered_exception error 503
Solve the problem of reporting to the master after the es cluster is started_ not_ discovered_ exception
After the ES cluster starts, enter in the browser: http://es ip address: Port/_ cat/nodes?pretty, the following error will be prompted:
{ "error" : { "root_cause" : [ { "type" : "master_not_discovered_exception", "reason" : null } ], "type" : "master_not_discovered_exception", "reason" : null }, "status" : 503 }
 Solution:
Specify the initial node in each profile:
cluster.initial_master_nodes: node-1
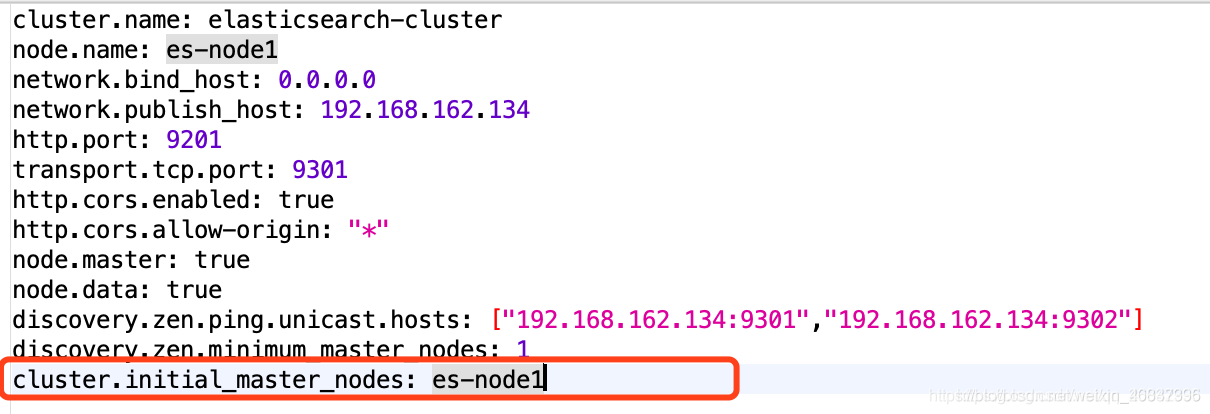
Restart the ES cluster and enter again in the browser http://es ip address: Port/_ cat/nodes?pretty, you can see that the cluster is started successfully: