preface
Refer to ArcGIS api 3.0 on esri's official website for the api used in the function implementation of this article and the classes involved that cannot be understood x for js: esri official website api , which introduces ArcGIS API in detail X introduction to various classes and online examples: esri official website online example , this is also learning ArcGIS API 3 Good material for X.
Content overview
- Basic drawing of Draw tool based on arcgis aqpi
- Expand drawing tools
- Source code demo download
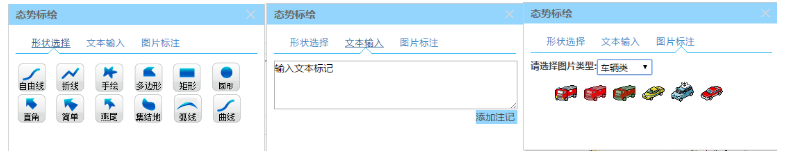
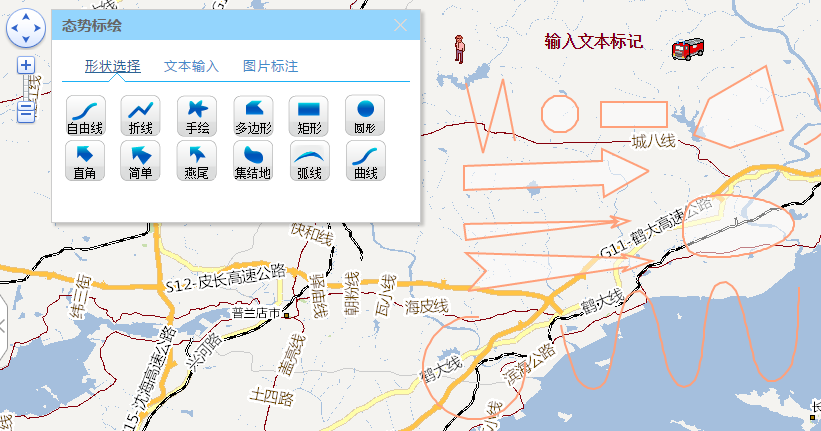
This chapter implements the map situation plotting function module, and the screenshot is as follows:
The core of this article is to call the Draw tool of arcgis aqpi: Draw
require(["esri/toolbars/draw"], function(Draw) { /* code goes here */ });
Constructor:
new Draw(map, options?)
Generally speaking, it is OK to pass the parameter map object in. Other parameters are optional, and the default is OK, unless you want to set them specifically.
The default paintable graphics type constant Constants:
ARROW    Draws an arrow.arrow
CIRCLE    Draws a circle.circular
DOWN_ARROW    Draws an arrow that points down.Down arrow
ELLIPSE    Draws an ellipse.ellipse
EXTENT    Draws an extent box.rectangle
FREEHAND_POLYGON    Draws a freehand polygon.Hand drawn polygon
FREEHAND_POLYLINE    Draws a freehand polyline.Hand drawn line
LEFT_ARROW    Draws an arrow that points left.left arrow
LINE    Draws a line.Line
MULTI_POINT    Draws a Multipoint.Multipoint
POINT    Draws a point.spot
POLYGON    Draws a polygon.polygon
POLYLINE    Draws a polyline.broken line
RECTANGLE    Draws a rectangle.rectangle
RIGHT_ARROW    Draws an arrow that points right.Right key head
TRIANGLE    Draws a triangle.triangle
UP_ARROW    Draws an arrow that points up.up arrow
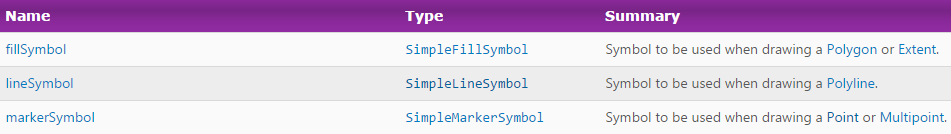
You can set the symbol style for drawing:
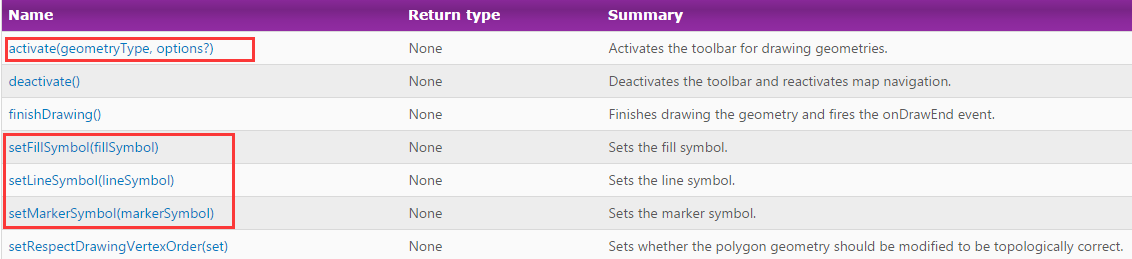
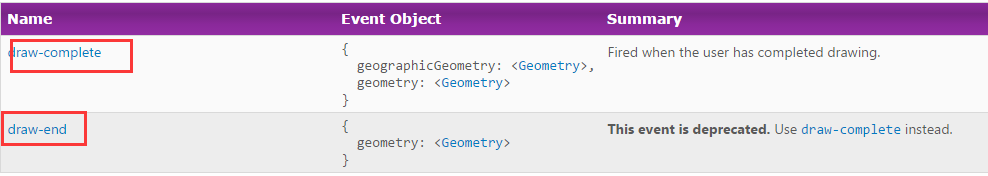
The activate function can activate the behavior that triggers drawing. After drawing, get the geometry in the drawing end event:
activate(geometryType, options?)
The idea of map plotting is to realize common point line and surface rendering by using Draw tool of arcgis api. However, special military situations such as swallow tail arrow, assembly ground, arcs, curves and simple arrows need to be customized to draw. Therefore, it is necessary to expand Draw tools to achieve it, and this is also the essence of this article.
- Let's talk about how to expand the Draw class js file in the project reference:
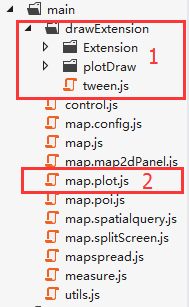
1. Inherit and expand the file directory of Draw; 2 is the js file to realize the situation plotting module.
First, you need to create a map HTML page reference:
<script type="text/javascript">
        //Configure arcgis to expand and resolve the path referenced by the sky map service class
        dojoConfig = {
            parseOnLoad: true,
            packages: [{
                name: 'tdlib',
                location: this.location.pathname.replace(/\/[^/]+$/, "") + "/js/tdlib"
            }],
            paths: {
                Extension: location.pathname.replace(/\/[^/]+$/, "") + "/js/main/drawExtension/Extension",
                ExtensionDraw: location.pathname.replace(/\/[^/]+$/, "") + "/js/main/drawExtension/plotDraw"
            }
        };
    </script>
Where paths represents the path to be referenced.
<script type="text/javascript" src="js/main/map.plot.js"></script>
Secondly, in map js file initialization refers to the expanded js files DrawEx and DrawExt:
(function () {
    dojo.require("Extension.DrawEx");
    dojo.require("ExtensionDraw.DrawExt");
})();
Finally, call plot in the situation plotting menu response event of the toolbar menu JS:
//Situation plotting
$("#bPlot").click(function () {
            //Initialize military potential plotting interface
            if (!DCI.Plot.isload)
                DCI.Plot.Init(map);
            if (DCI.Plot.dialog)
                DCI.Plot.dialog.close();
            DCI.Plot.dialog = jDialog.dialog({
                title: 'Situation plotting',
                width: 370,
                height: 200,
                left: 450,
                top: 200,
                modal: false, // Non modal, that is, the mask layer is not displayed
                content: DCI.Plot.Html
            });
            DCI.Plot.InitEvent();

});
- Talk about the idea of drawing tool call. Whether you call arcgis api's original drawing or expand drawing, you first create a Draw object, then listen to the Draw end callback function of Draw, obtain the drawn graphics and overlay them on the map display; The activate function of the Draw tool will trigger the Draw end callback function;
First, initialize the Draw tool object and the default symbol style symbol:
//Define default point, line, and face symbols
DCI.Plot.markerSymbol = new esri.symbol.SimpleMarkerSymbol(esri.symbol.SimpleMarkerSymbol.STYLE_CIRCLE, 8, new esri.symbol.SimpleLineSymbol(esri.symbol.SimpleLineSymbol.STYLE_SOLID, new dojo.Color([255, 69, 0]), 2), new dojo.Color([255, 255, 255, 1]));
            DCI.Plot.lineSymbol = new esri.symbol.SimpleLineSymbol(esri.symbol.SimpleLineSymbol.STYLE_SOLID, new dojo.Color([255, 160, 122]), 2);
            DCI.Plot.fillSymbol = new esri.symbol.SimpleFillSymbol(esri.symbol.SimpleFillSymbol.STYLE_SOLID, new esri.symbol.SimpleLineSymbol(esri.symbol.SimpleLineSymbol.STYLE_SOLID, new dojo.Color([255, 160, 122]), 2), new dojo.Color([255, 255, 255, 0.5]));
            //Initialize Draw
            DCI.Plot.toolbar = new Extension.DrawEx(map);
            DCI.Plot.toolbar.on("draw-end", DCI.Plot.addToMap);
            DCI.Plot.toolbar1 = new ExtensionDraw.DrawExt(map);
            DCI.Plot.toolbar1.on("draw-end", DCI.Plot.addToMap);
            //Draw of arcgis api
            DCI.Plot.drawToolbar = new esri.toolbars.Draw(map);
            DCI.Plot.drawToolbar.markerSymbol = DCI.Plot.markerSymbol;
            DCI.Plot.drawToolbar.lineSymbol = DCI.Plot.lineSymbol;
            DCI.Plot.drawToolbar.fillSymbol = DCI.Plot.fillSymbol;
            DCI.Plot.drawToolbar.on("draw-end", DCI.Plot.drawEnd);
Secondly, trigger the call to Draw:
case 0://plot_freehandline
                        DCI.Plot.drawFreeHandPolyline(null, function (geometry) {
                            symbol = DCI.Plot.lineSymbol;
                            DCI.Plot.drawEndPlot(geometry, symbol);
                        });
                        break;
                    case 1://plot_line
                        DCI.Plot.drawPolyline(null, function (geometry) {
                            symbol = DCI.Plot.lineSymbol;
                            DCI.Plot.drawEndPlot(geometry, symbol);
                        });
                        break;
                    case 2://emergency_freehand
                        DCI.Plot.drawFreeHandPolygon(null, function (geometry) {
                            symbol = DCI.Plot.fillSymbol;
                            DCI.Plot.drawEndPlot(geometry, symbol);
                        });
                        break;
                    case 3://plot_polygon
                        DCI.Plot.drawPolygon(null, function (geometry) {
                            symbol = DCI.Plot.fillSymbol;
                            DCI.Plot.drawEndPlot(geometry, symbol);
                        });
                        break;
                    case 4://plot_extent
                        DCI.Plot.drawExtent(null, function (geometry) {
                            symbol = DCI.Plot.fillSymbol;
                            DCI.Plot.drawEndPlot(geometry, symbol);
                        });
                        break;
                    case 5://emergency_freehand
                        DCI.Plot.drawCircle(null, function (geometry) {
                            symbol = DCI.Plot.fillSymbol;
                            DCI.Plot.drawEndPlot(geometry, symbol);
                        });
                        break;
                    case 6://Right angle arrow
                        DCI.Plot.drawStraightArrow(null, function (geometry) {
                            symbol = DCI.Plot.fillSymbol;
                            DCI.Plot.drawEndPlot(geometry, symbol);
                        });
                        break;
                    case 7://Simple arrow
                        DCI.Plot.toolbar.activate(Extension.DrawEx.FREEHAND_ARROW);
                      break;
                    case 8://Dovetail arrow
                        DCI.Plot.toolbar1.fillSymbol = DCI.Plot.fillSymbol;
                        DCI.Plot.toolbar1.activate("tailedsquadcombat");
                        break;
                    case 9://Assembly site
                        DCI.Plot.toolbar.activate(Extension.DrawEx.BEZIER_POLYGON);
                      break;
                    case 10://Arc
                        DCI.Plot.toolbar.activate(Extension.DrawEx.CURVE);
                      break;
                    case 11://curve
                        DCI.Plot.toolbar.activate(Extension.DrawEx.BEZIER_CURVE);
                      break;
//Draw point
        drawPoint: function (symbol, onDrawEnd) {
            DCI.Plot.onDrawEnd = onDrawEnd;
            if (symbol) {
                DCI.Plot.drawToolbar.markerSymbol = symbol;
            }
            DCI.Plot.drawToolbar.activate(esri.toolbars.Draw.POINT);
            DCI.Plot.disablePan();
        },
        //Draw a polyline
        drawPolyline: function (symbol, onDrawEnd) {
            this.onDrawEnd = onDrawEnd;
            if (symbol) {
                this.drawToolbar.lineSymbol = symbol;
            }
            this.drawToolbar.activate(esri.toolbars.Draw.POLYLINE);
            this.disablePan();
        },
        //Free line
        drawFreeHandPolyline: function (symbol, onDrawEnd) {
            this.onDrawEnd = onDrawEnd;
            if (symbol) {
                this.drawToolbar.lineSymbol = symbol;
            }
            this.drawToolbar.activate(esri.toolbars.Draw.FREEHAND_POLYLINE);
            this.disablePan();
        },
        //Draw polygon
        drawPolygon: function (symbol, onDrawEnd) {
            this.onDrawEnd = onDrawEnd;
            if (symbol) {
                this.drawToolbar.fillSymbol = symbol;
            }
            this.drawToolbar.activate(esri.toolbars.Draw.POLYGON);
            this.disablePan();
        },
        //Hand drawn polygon
        drawFreeHandPolygon: function (symbol, onDrawEnd) {
            this.onDrawEnd = onDrawEnd;
            if (symbol) {
                this.drawToolbar.fillSymbol = symbol;
            }
            this.drawToolbar.activate(esri.toolbars.Draw.FREEHAND_POLYGON);
            this.disablePan();
        },
        //Draw a circle
        drawCircle: function (symbol, onDrawEnd) {
            this.onDrawEnd = onDrawEnd;
            if (symbol) {
                this.drawToolbar.fillSymbol = symbol;
            }
            this.drawToolbar.activate(esri.toolbars.Draw.CIRCLE);
            this.disablePan();
        },
        //Draw rectangle
        drawExtent: function (symbol, onDrawEnd) {
            this.onDrawEnd = onDrawEnd;
            if (symbol) {
                this.drawToolbar.fillSymbol = symbol;
            }
            this.drawToolbar.activate(esri.toolbars.Draw.EXTENT);
            this.disablePan();
        },
        //Right angle arrow
        drawStraightArrow: function (symbol, onDrawEnd) {
            this.onDrawEnd = onDrawEnd;
            if (symbol) {
                this.drawToolbar.fillSymbol = symbol;
            }
            this.drawToolbar.activate(esri.toolbars.Draw.ARROW);
            this.disablePan();
        },
Finally, add drawing graphics to display on the map:
/**
  * Function called after drawing
*/
drawEndPlot: function (geometry,symbol) {
            var title = "title";
            var htmlCon = "Test content test content";
            var attr = { "title": title, "content": htmlCon};
            var graphic = new esri.Graphic(geometry, symbol, attr);
            DCI.Plot.graphicslayer.add(graphic);
            DCI.Plot.deactivateDraw();
            DCI.Plot.map.setMapCursor('auto');//Set the mouse cursor
}
/**
         * Expand the function called after drawing
        */
        addToMap: function (evt) {
            DCI.Plot.map.setMapCursor('auto');//Set the mouse cursor
            var symbol;
            DCI.Plot.toolbar.deactivate();
            DCI.Plot.toolbar1.deactivate();
            switch (evt.geometry.type)
            {
                case "point":
                case "multipoint":
                    symbol = DCI.Plot.markerSymbol;
                    break;
                case "polyline":
                    symbol = DCI.Plot.lineSymbol;
                    break;
                default:
                    symbol = DCI.Plot.fillSymbol;
                    break;
            }
            var title = "title";
            var htmlCon = "Test content test content";
            var attr = { "title": title, "content": htmlCon};
            var graphic = new esri.Graphic(evt.geometry, symbol, attr);
            DCI.Plot.graphicslayer.add(graphic);
        }