1, Prometheus monitoring container
Prometheus is an open source monitoring tool for cloud native applications. As the first monitoring tool graduated from CNCF, developers have great hopes for Prometheus. In the Kubernetes community, many people believe that Prometheus is the first scheme for monitoring in container scenarios and has become the developer of container monitoring standards.
2, What is cdadvisor
Container advisor is an open source container monitoring tool of Google, which can be used to monitor the usage and performance of container resources. It runs as a daemon to collect, aggregate, process, and export information about running containers. Specifically, the component will record its resource isolation parameters, historical resource usage, histogram of complete historical resource usage and network statistics for each container.
Cdadvisor supports Docker containers and other types of containers as much as possible, striving to be compatible and adaptable to all types of containers.
From the above introduction, we can know that cdadvisor is used to monitor the container engine. Due to the practicability of its monitoring, Kubernetes has integrated it with Kubelet by default, so we don't need to deploy the coadvisor component separately to expose the running information of the container in the node. We can directly use the index collection address provided by Kubelet component.
Cadvisor is used for collection, Prometheus is used as the data source, and Grafana is used for display.
Environmental preparation:
| host name | IP | Required software |
|---|---|---|
| master | 192.168.91.138 | docker-ce,prometheus,grafan |
| node1 | 192.168.91.137 | docker-ce,node_exporter |

3, node1 node deployment coadvisor
Pull the official google/cadvisor image on the client host
[root@node1 ~]# docker pull google/cadvisor
Run cadvisor container
[root@node1 ~]# docker run \
--volume=/:/rootfs:ro \
--volume=/var/run:/var/run:ro \
--volume=/sys:/sys:ro \
--volume=/var/lib/docker/:/var/lib/docker:ro \
--volume=/dev/disk/:/dev/disk:ro \
--publish=8080:8080 \
--detach=true \
--name=cadvisor \
--privileged \
--device=/dev/kmsg \
google/cadvisor

aaaadb87f18c11448e7be4a77b329372d5b90e300687f21709badacb384bfdb7

[root@node1 ~]# docker images | grep cadvisor
google/cadvisor                                      latest    eb1210707573   3 years ago    69.6MB
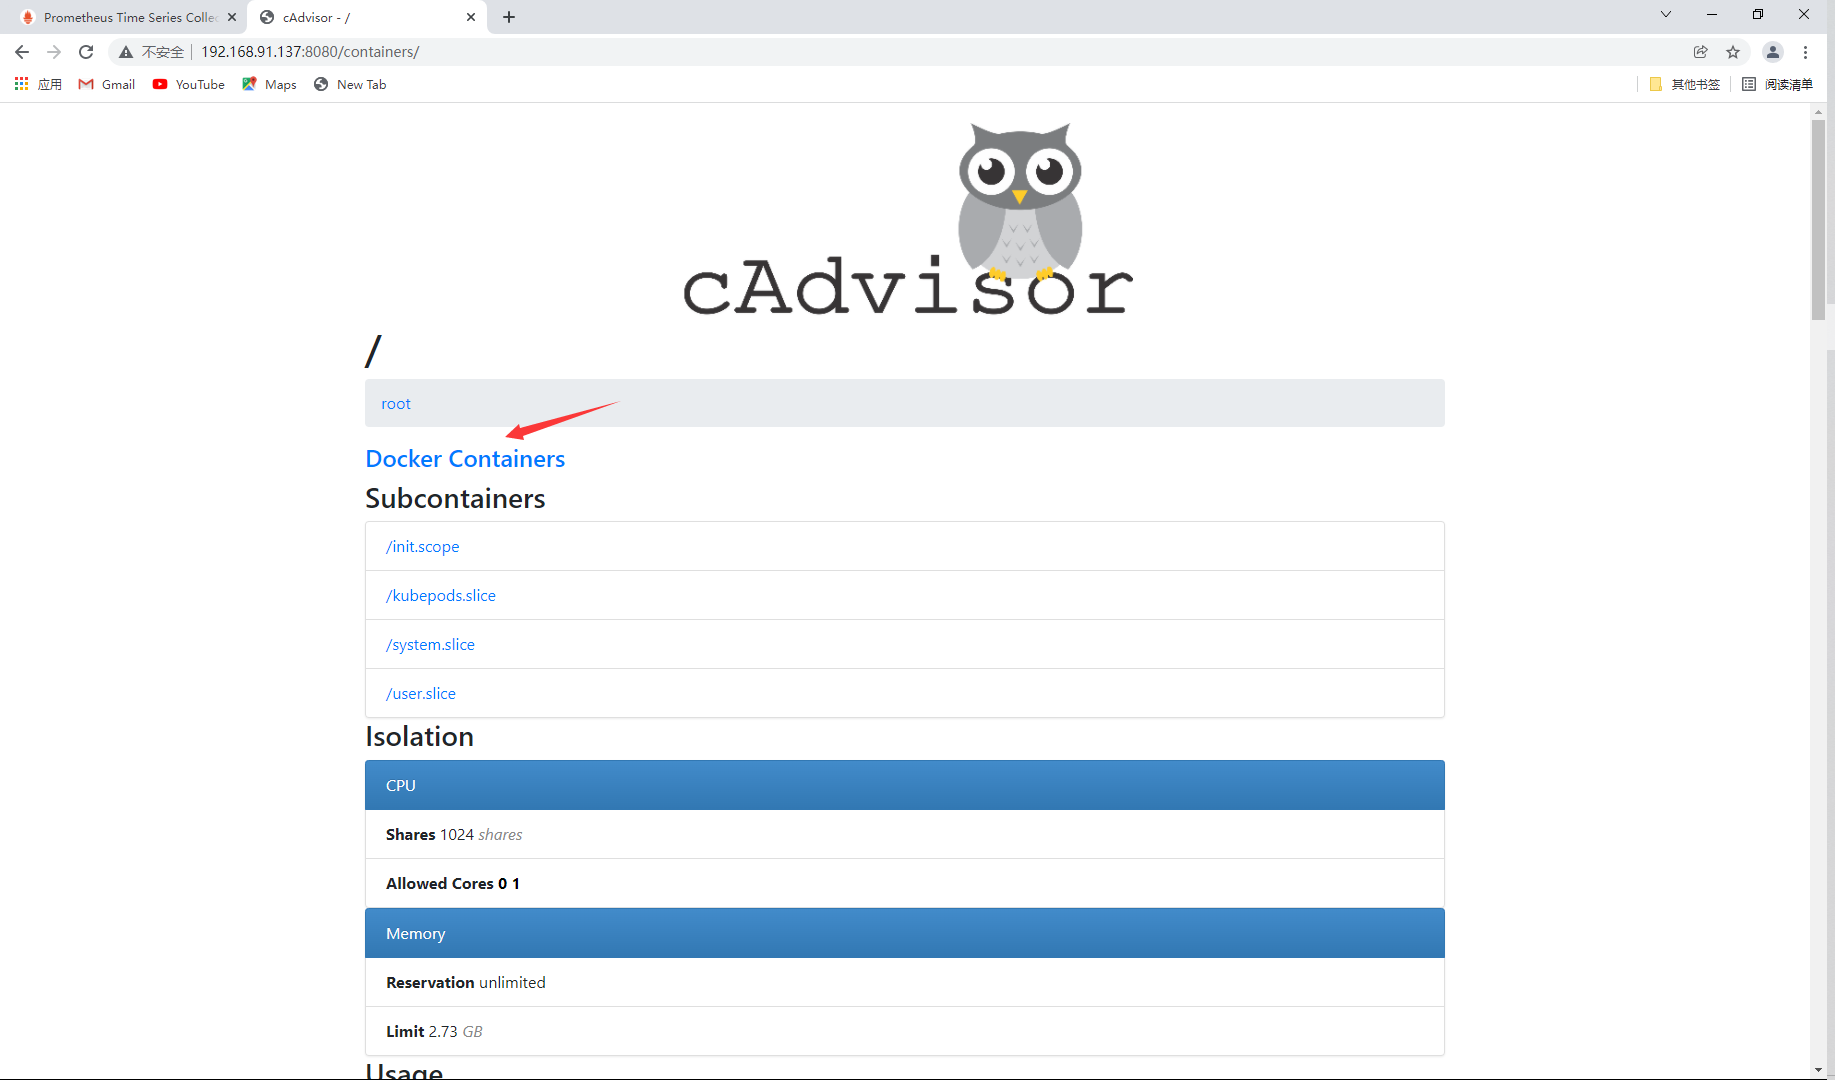
Page access
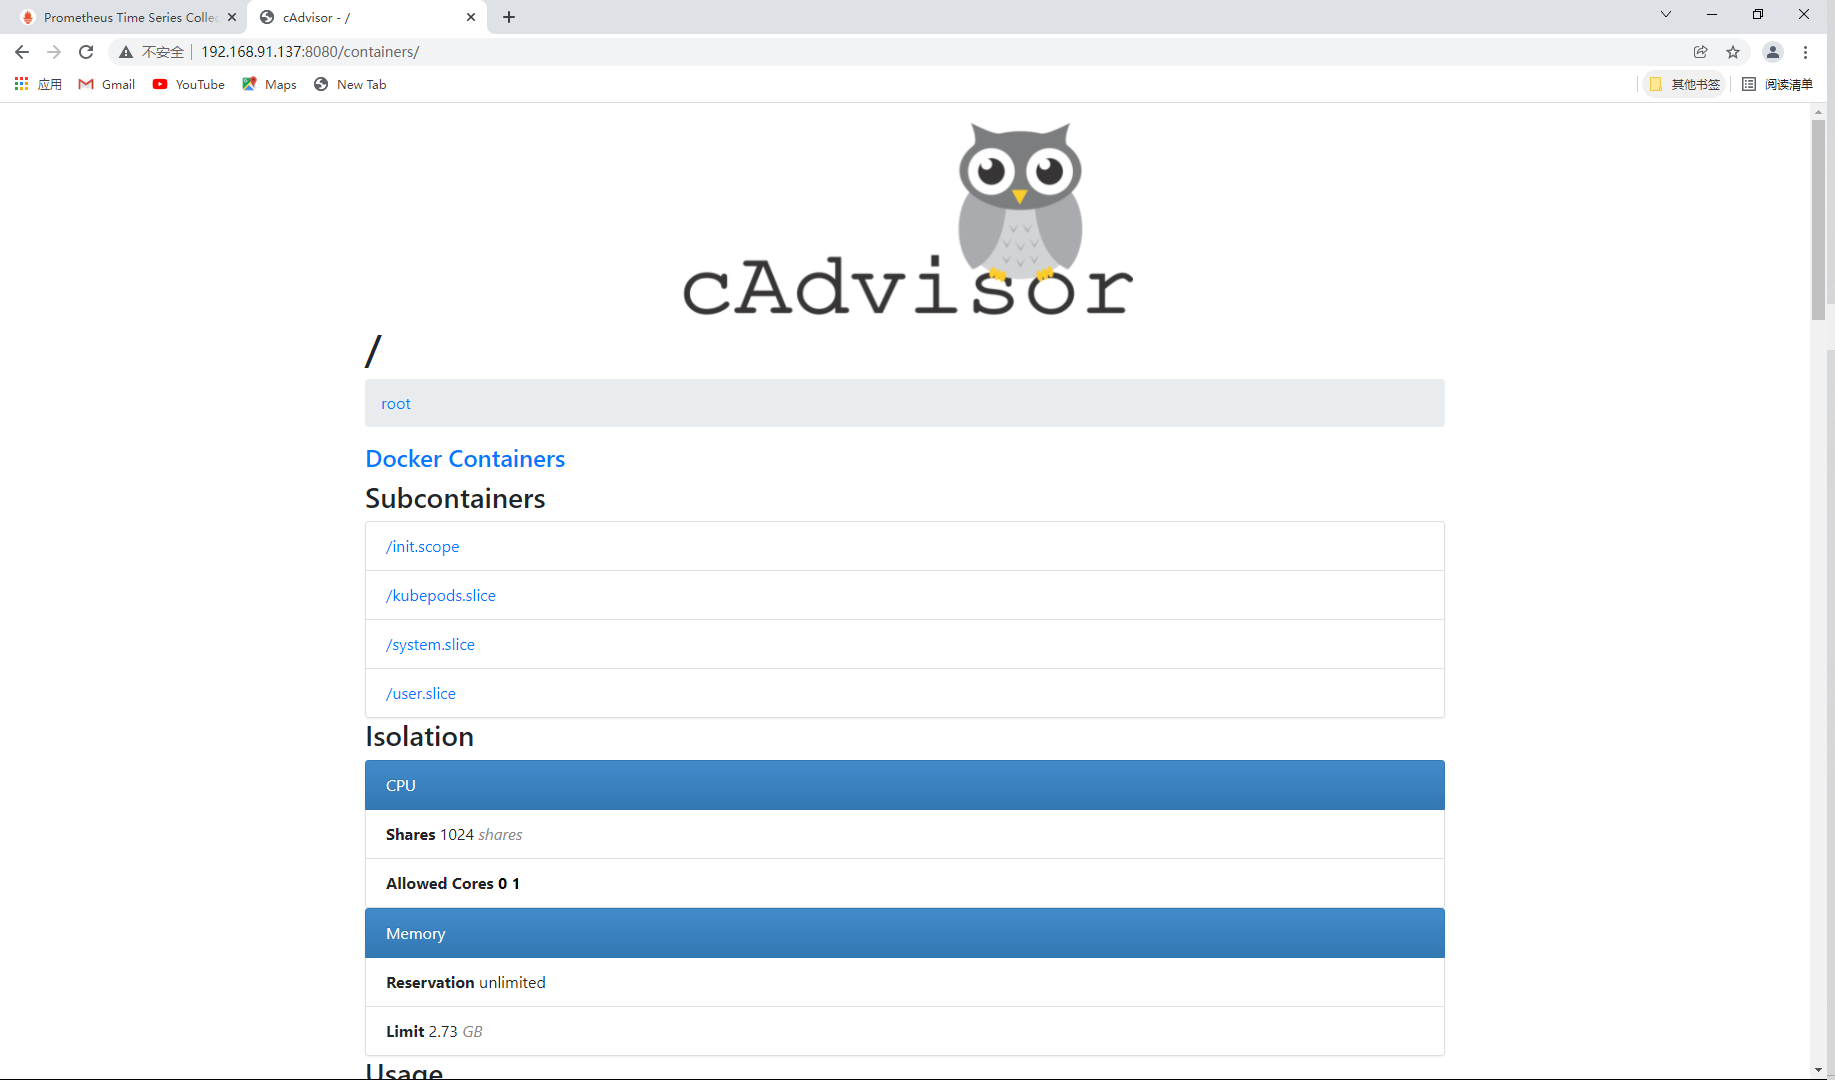
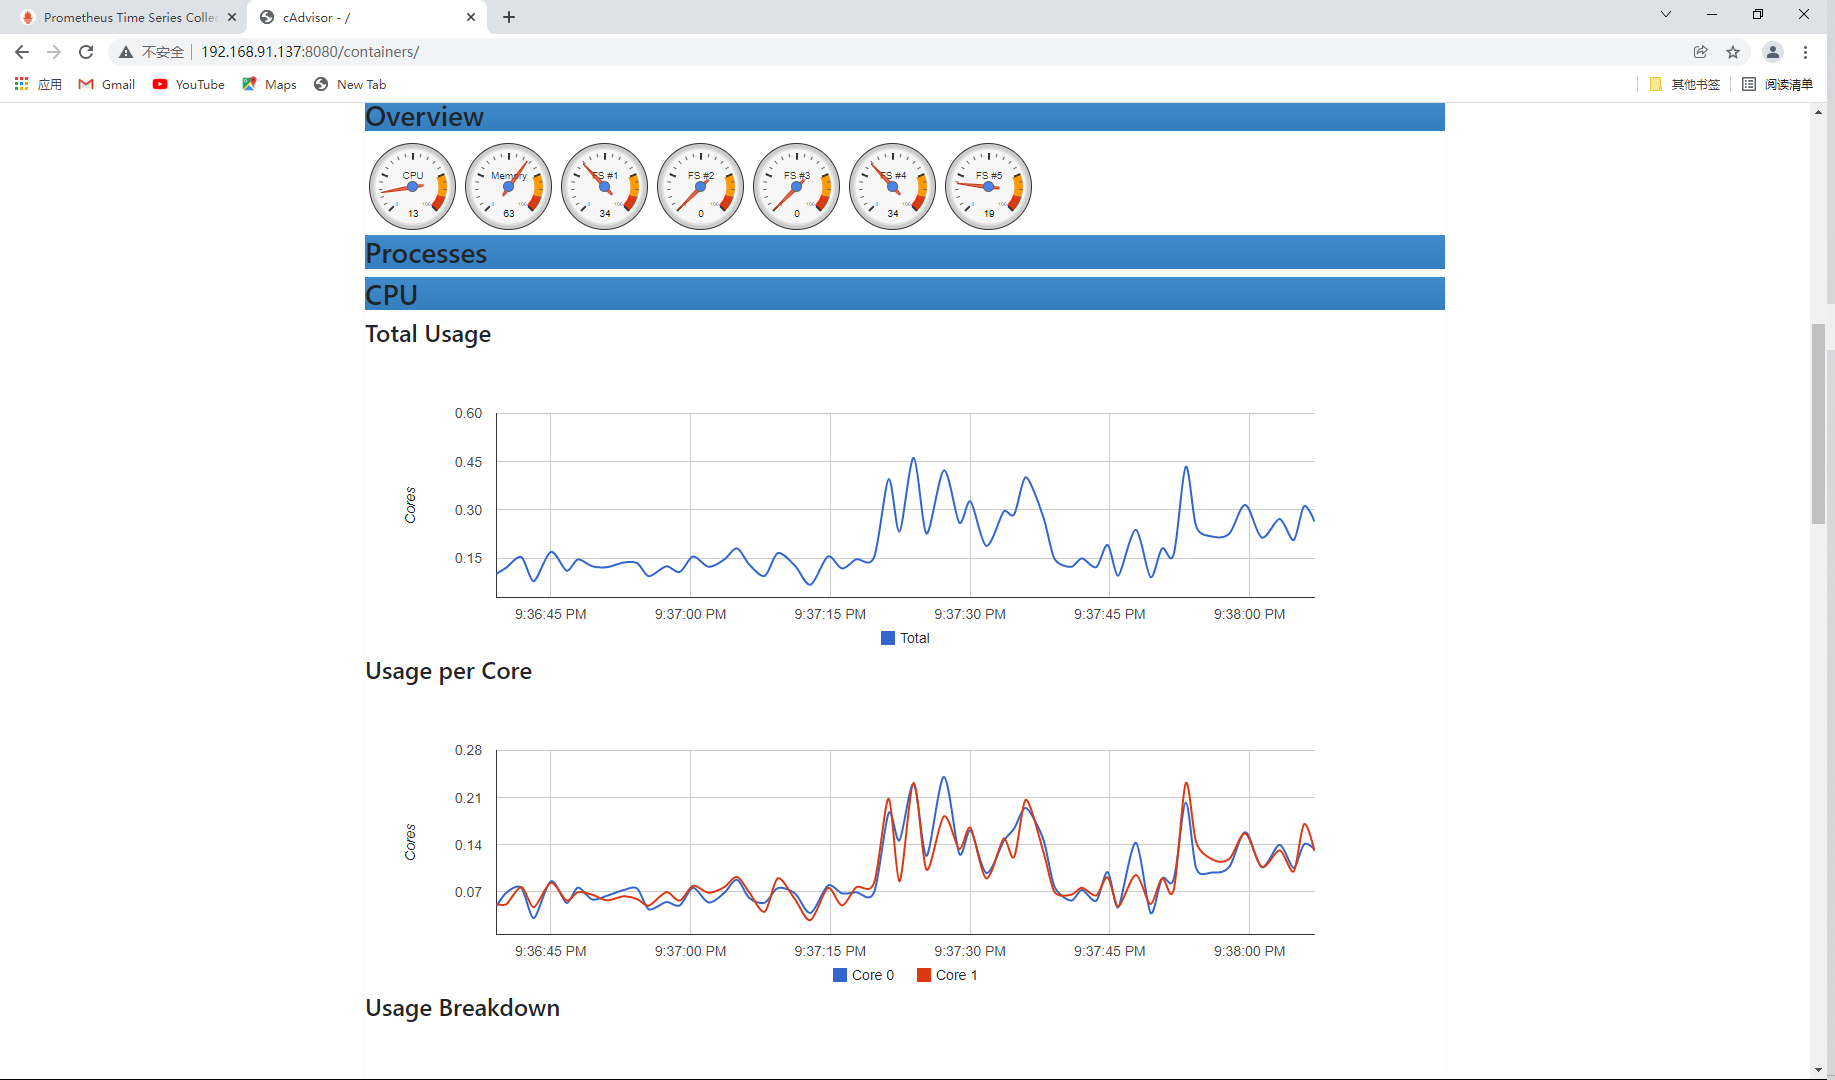
Look down like
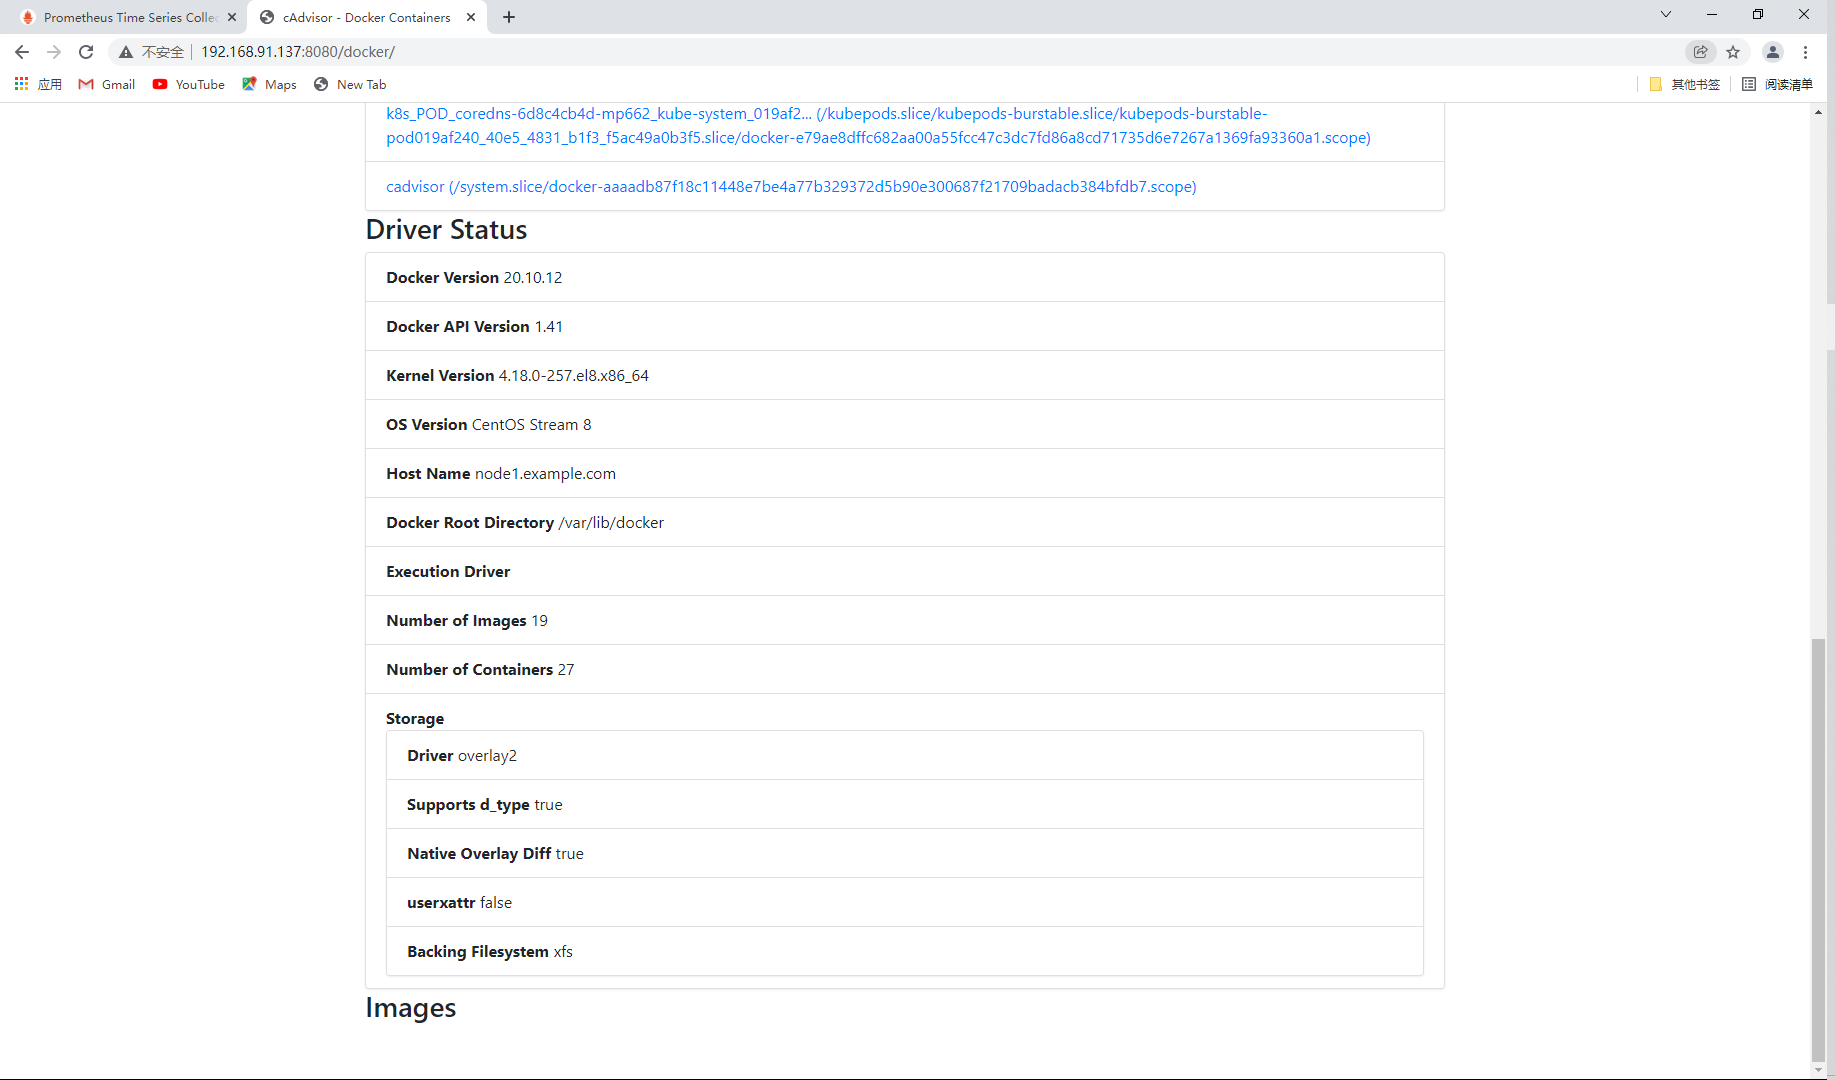
View the container details of the node
You can see the container name, docker version, operating system, node host name, container root directory and other information
Configure Prometheus. On the master host YML file
So that prometheus can receive the information collected by cadvisor, so as to monitor the host where cadvisor is located
[root@master ~]# vim /opt/prometheus.yml
  - job_name: "prometheus"

    # metrics_path defaults to '/metrics'
    # scheme defaults to 'http'.

    static_configs:
      - targets: ["localhost:9090"]

  - job_name: amu_node1
    static_configs:
      - targets: ["192.168.91.137:9100"]

  - job_name: "cadvisor"			// Add task name
    static_configs:
      - targets: ["192.168.91.137:8080"]	// Add access IP

// Restart the prometheus container
[root@master ~]# docker restart prometheus
prometheus

[root@master ~]# docker ps | grep prometheus
d8b1bac0d5ff   prom/prometheus                                     "/bin/prometheus --c..."   29 hours ago     Up 9 seconds    0.0.0.0:9090->9090/tcp, :::9090->9090/tcp   prometheus
Web access
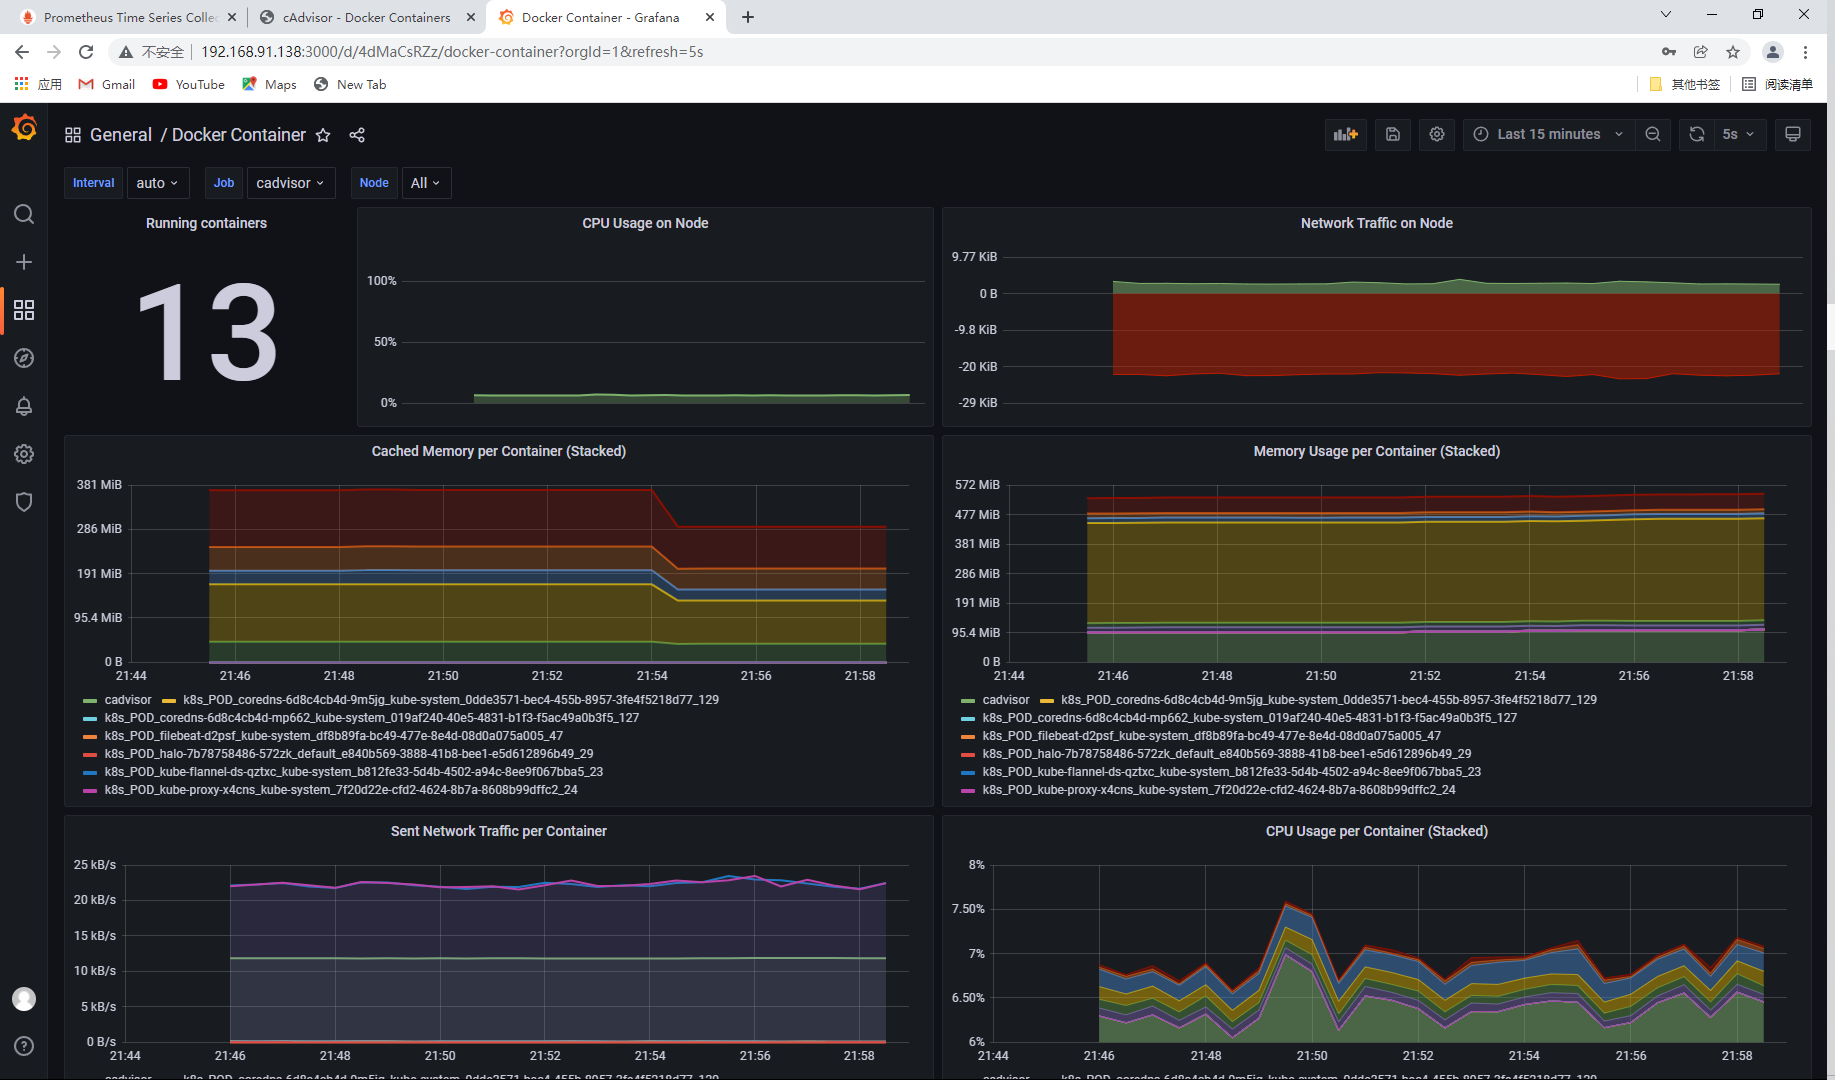
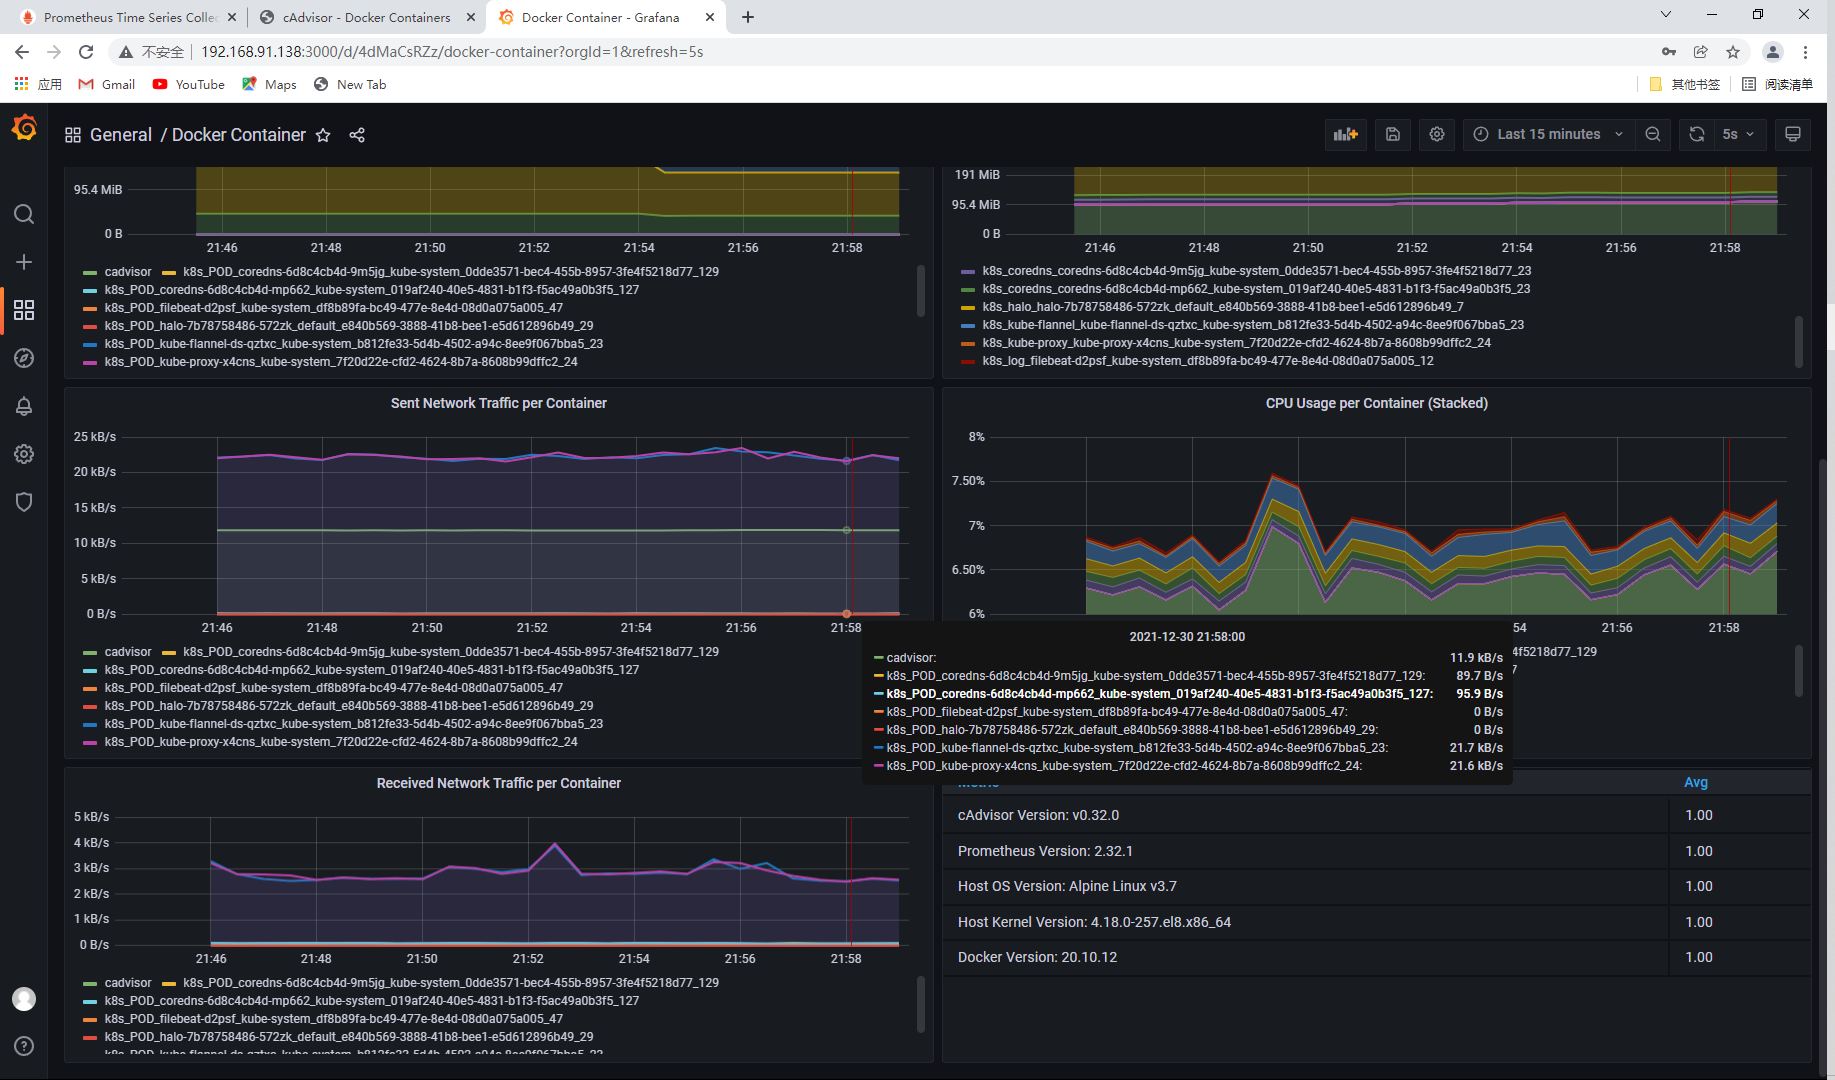
View monitoring

Start the grafana container
[root@master ~]# docker images | grep gra
grafana/grafana                                                   latest    9b957e098315   2 weeks ago    275MB

[root@master ~]# docker run -dit --name grafan -p 3000:3000 grafana/grafana
af898dfa5134c1a27784e19d8813a1293719193ecded58f7af0fef64be94a412

[root@master ~]# docker ps | grep grafan
af898dfa5134   grafana/grafana                                     "/run.sh"                13 seconds ago   Up 12 seconds   0.0.0.0:3000->3000/tcp, :::3000->3000/tcp   grafan
Add access address
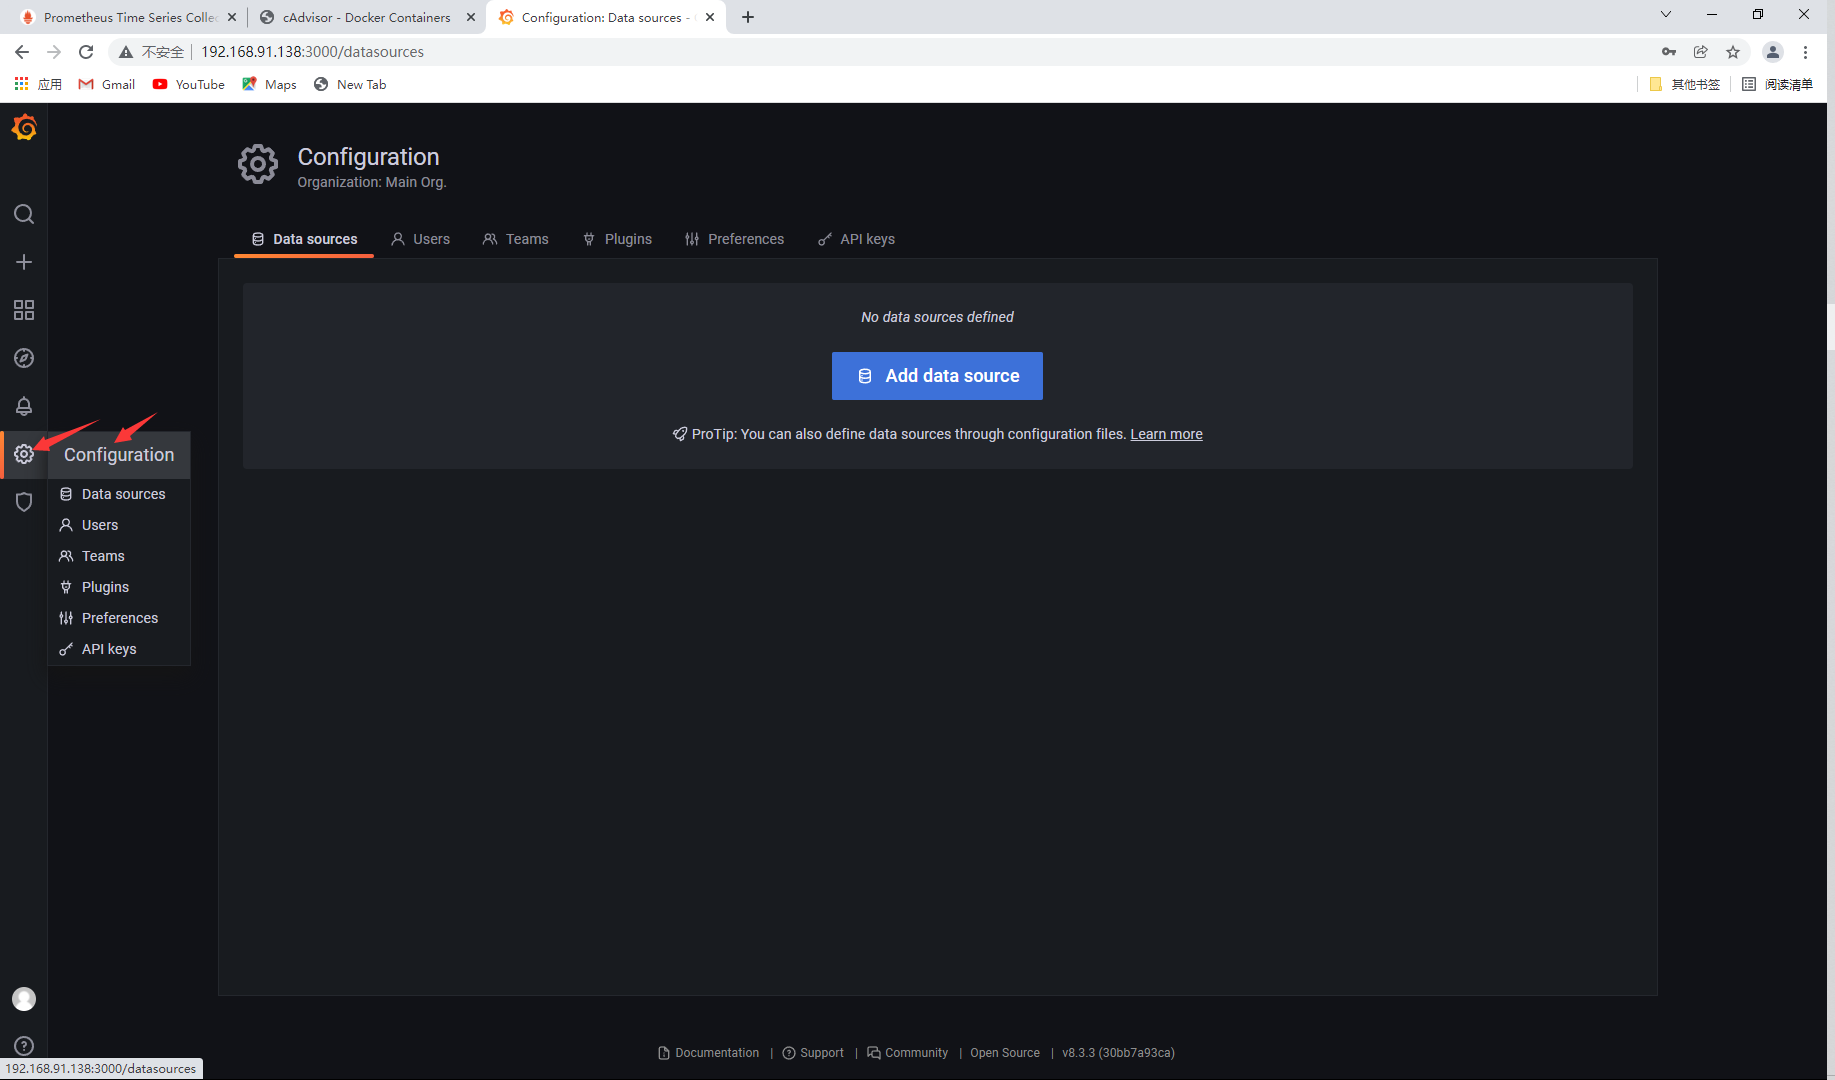
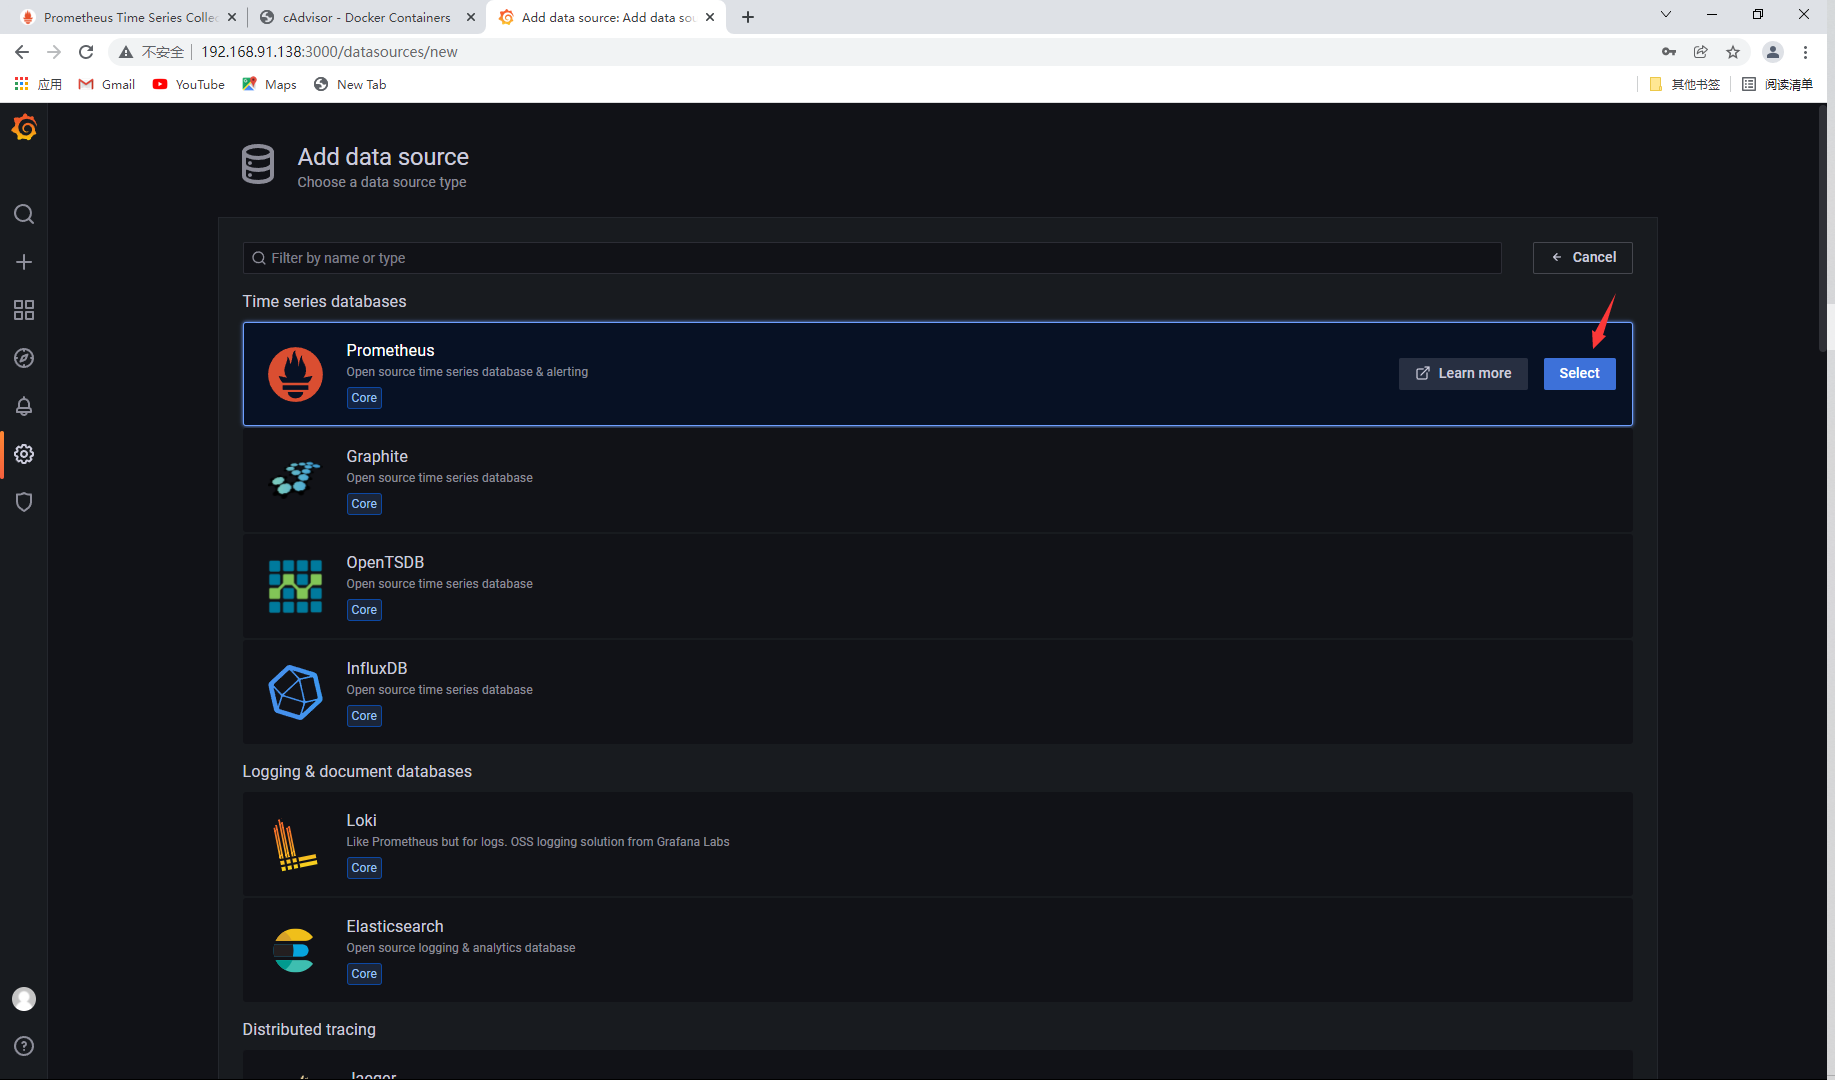
Add IP and save
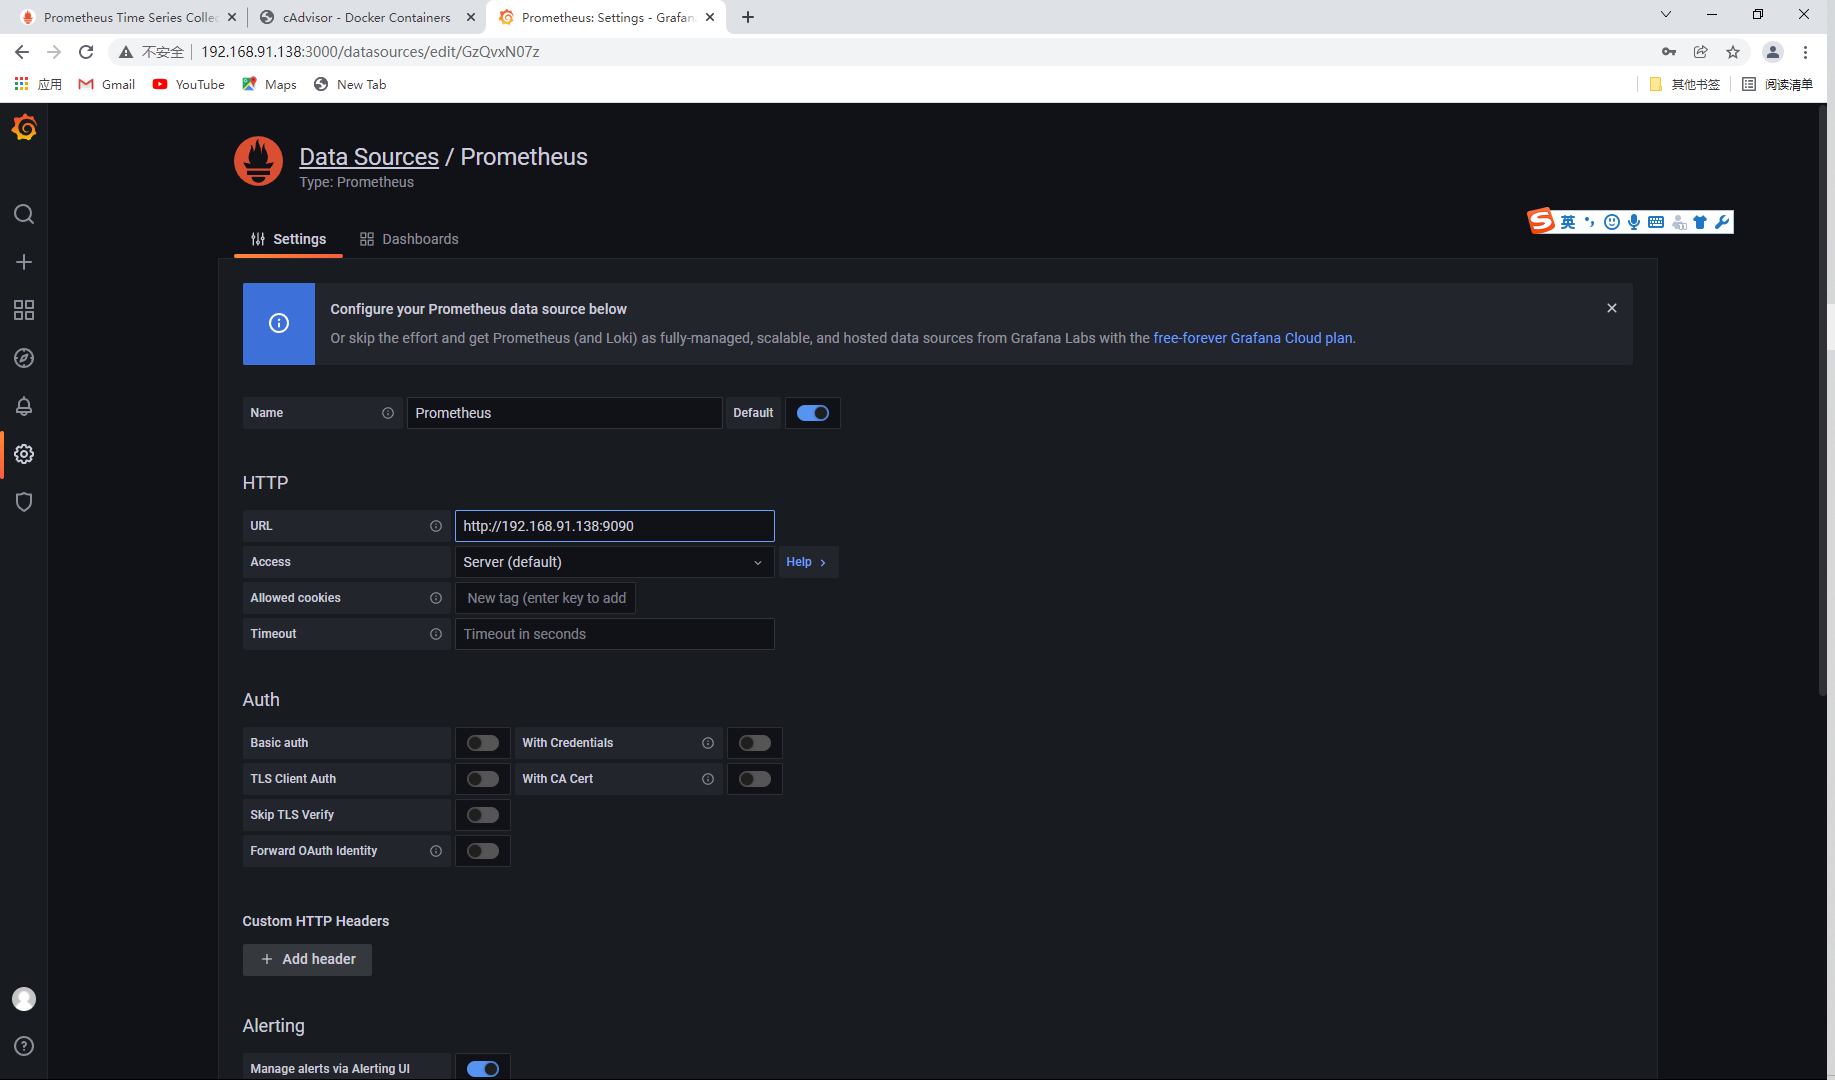
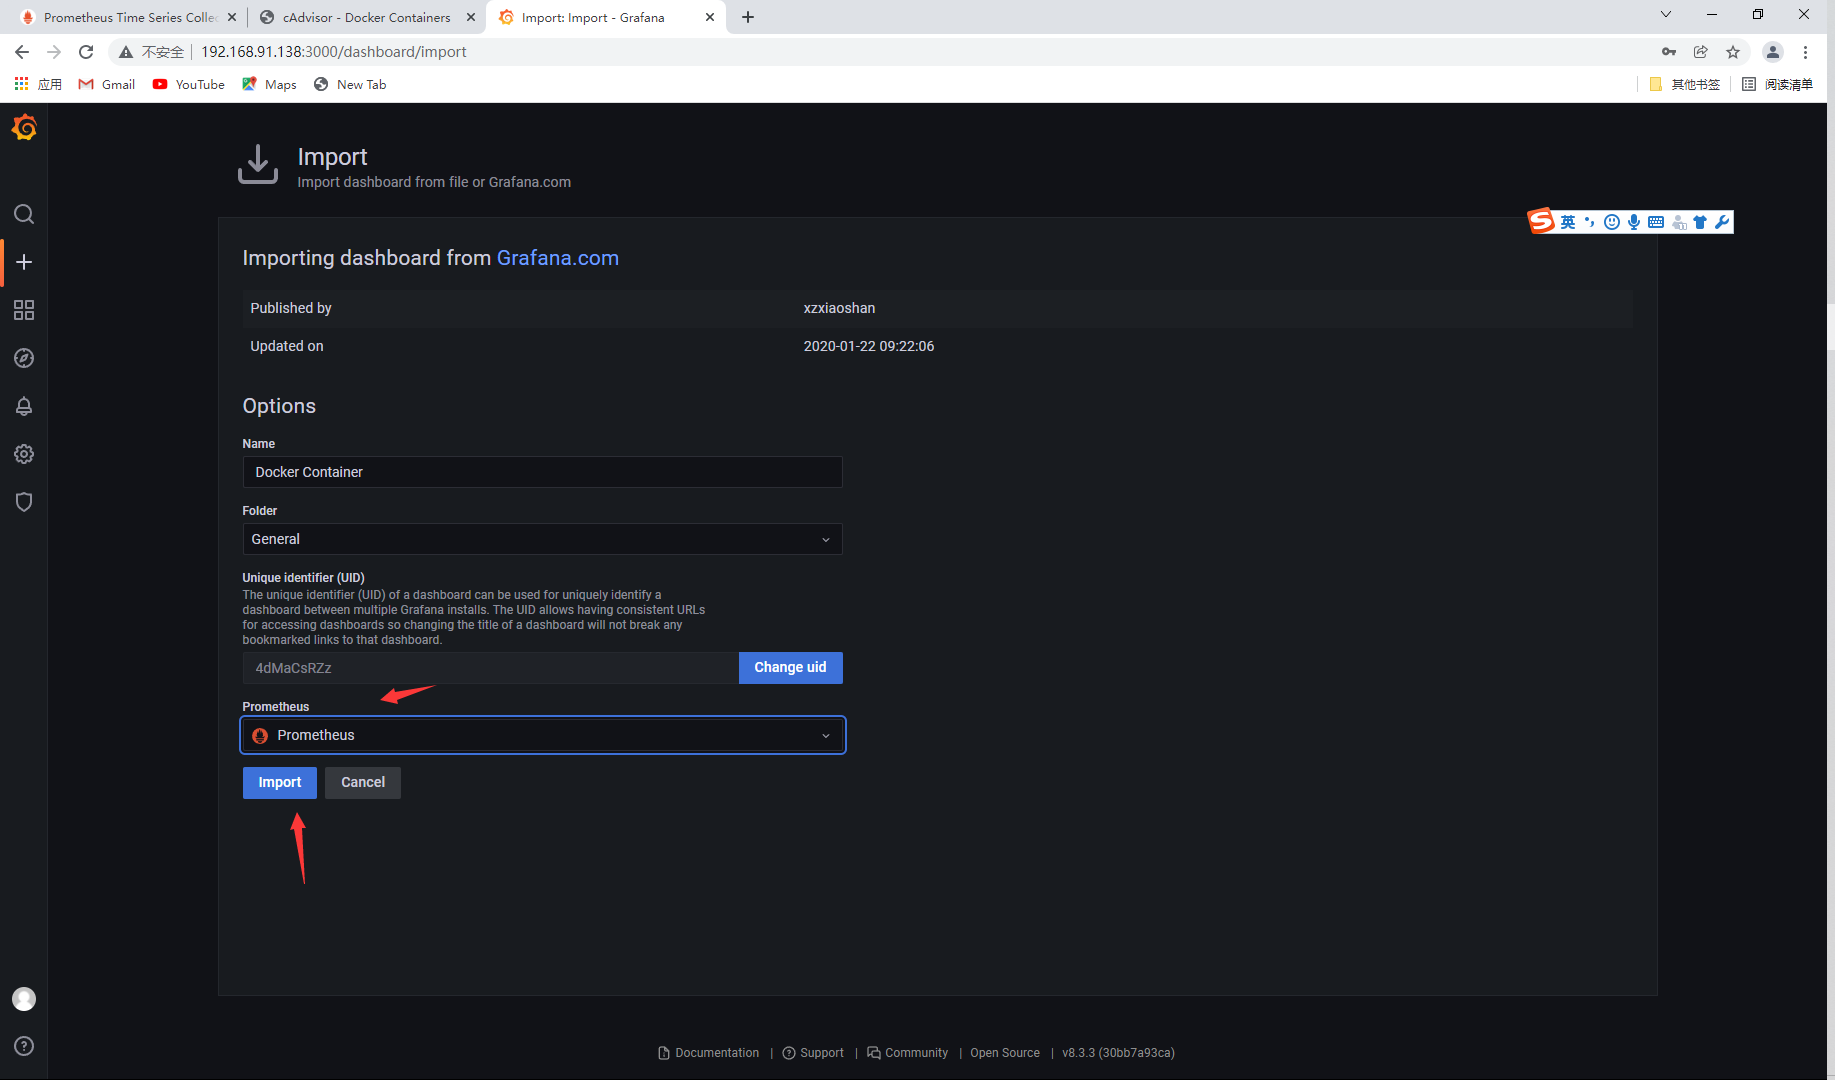
Import template
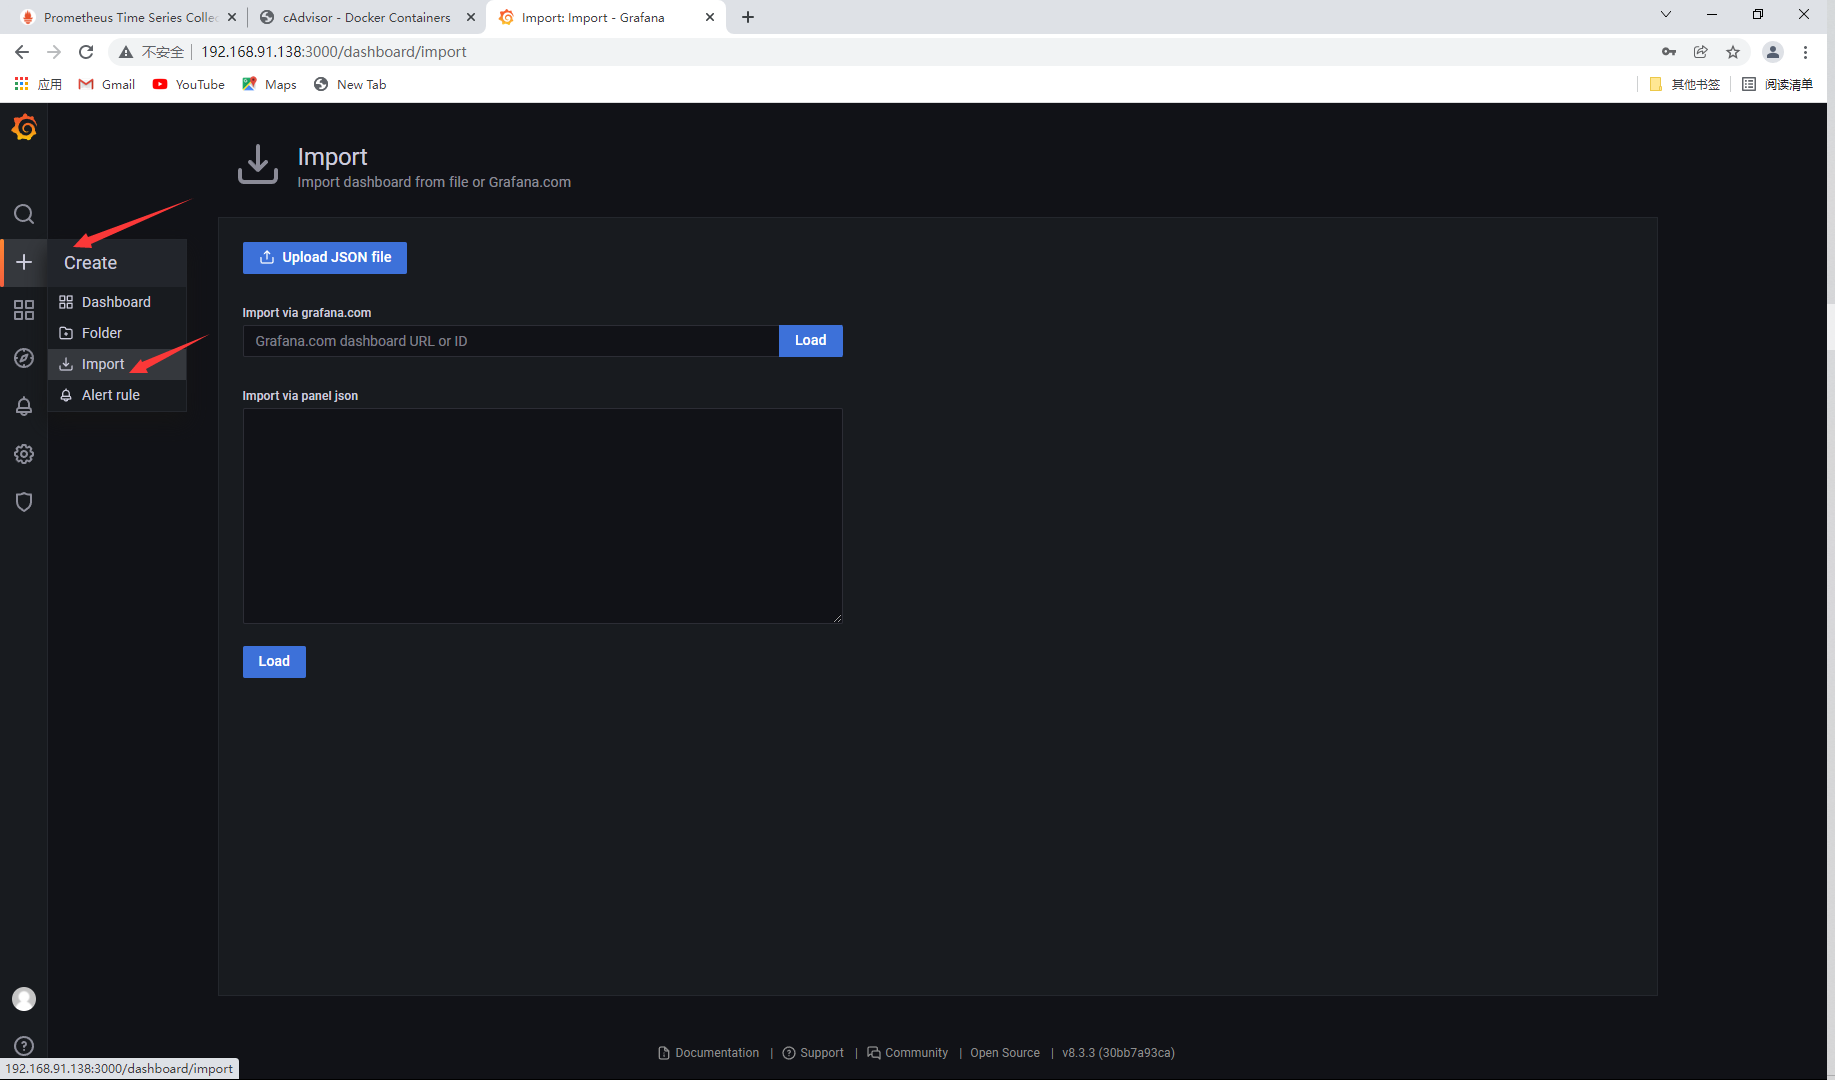
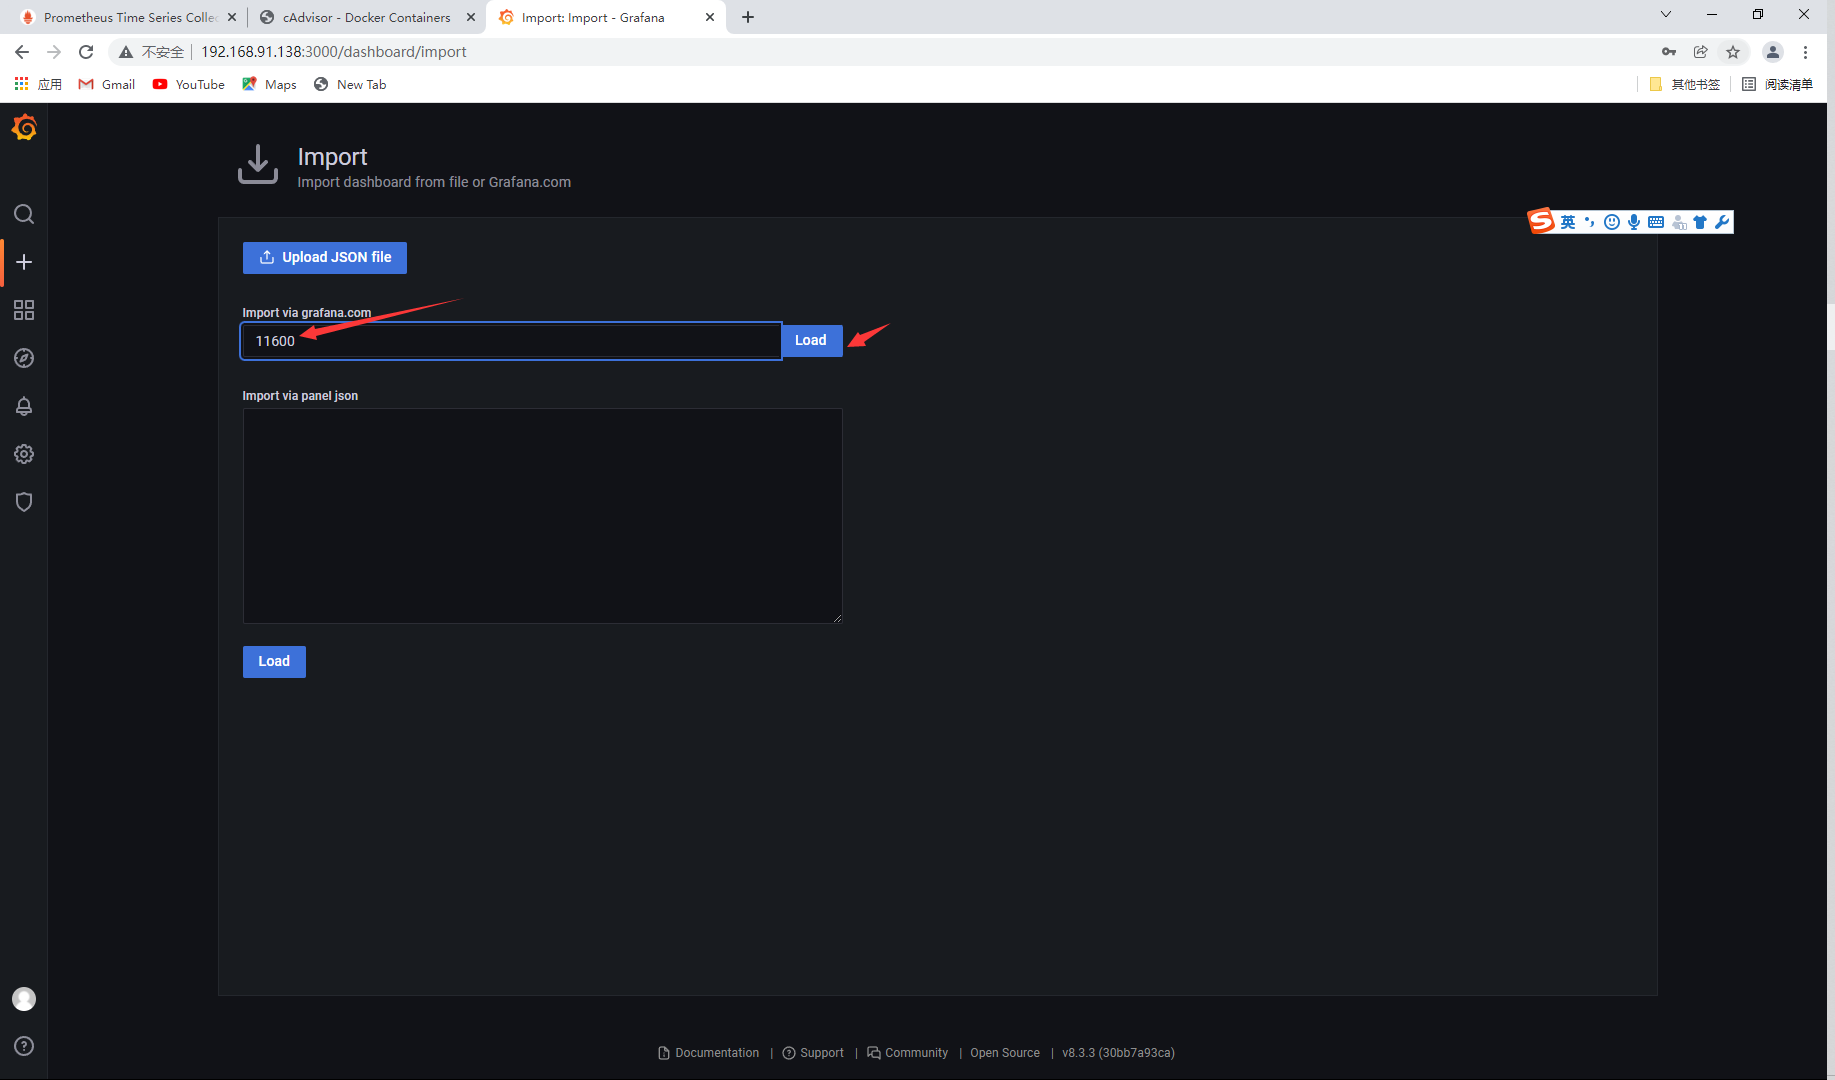
Select data source
4, Node exporter monitoring container
Pull the prom / node exporter image on the node1 host
[root@node1 ~]# docker pull prom/node-exporter

[root@node1 ~]# docker images | grep prom/node-exporter
prom/node-exporter                                   latest    1dbe0e931976   3 weeks ago    20.9MB
Run the node exporter container
[root@node1 ~]# docker run --name node-exporter -d -p 9100:9100 prom/node-exporter
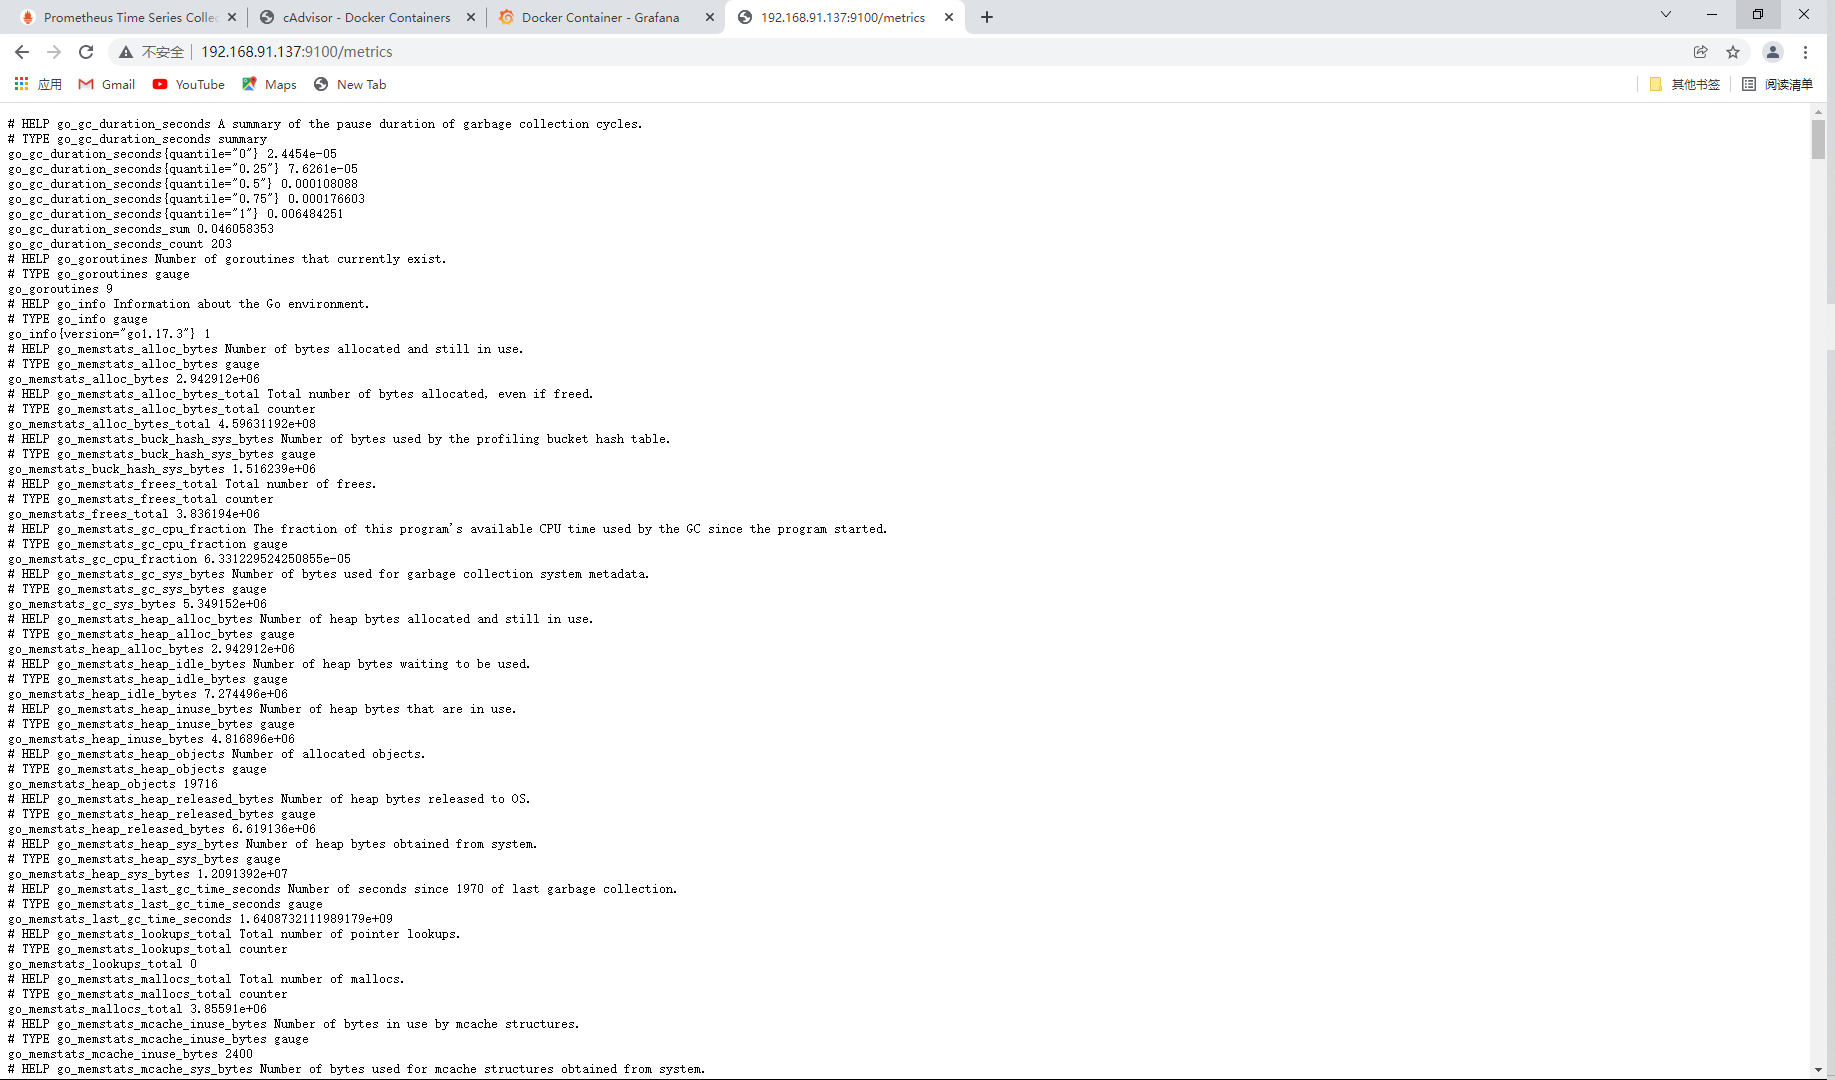
Page access
Next, we need to configure the node exporter information into Prometheus to enable Prometheus to regularly obtain the information collected by the exporter, so we need to modify Prometheus in the master YML configuration file, in the scene_ A new job is added under configs. The configuration is as follows:
[root@master ~]# vim /opt/prometheus.yml
  - job_name: "prometheus"

    # metrics_path defaults to '/metrics'
    # scheme defaults to 'http'.

    static_configs:
      - targets: ["localhost:9090"]

  - job_name: amu_node1		// Add here
    static_configs:
      - targets: ["192.168.91.137:9100"]	// Add access IP

  - job_name: "cadvisor"
    static_configs:
      - targets: ["192.168.91.137:8080"]


// Restart the prometheus container
[root@master ~]# docker restart prometheus
prometheus

// Viewing the prometheus container status
[root@master ~]# docker ps | grep prometheus
d8b1bac0d5ff   prom/prometheus                                     "/bin/prometheus --c..."   30 hours ago     Up 24 minutes   0.0.0.0:9090->9090/tcp, :::9090->9090/tcp   prometheus
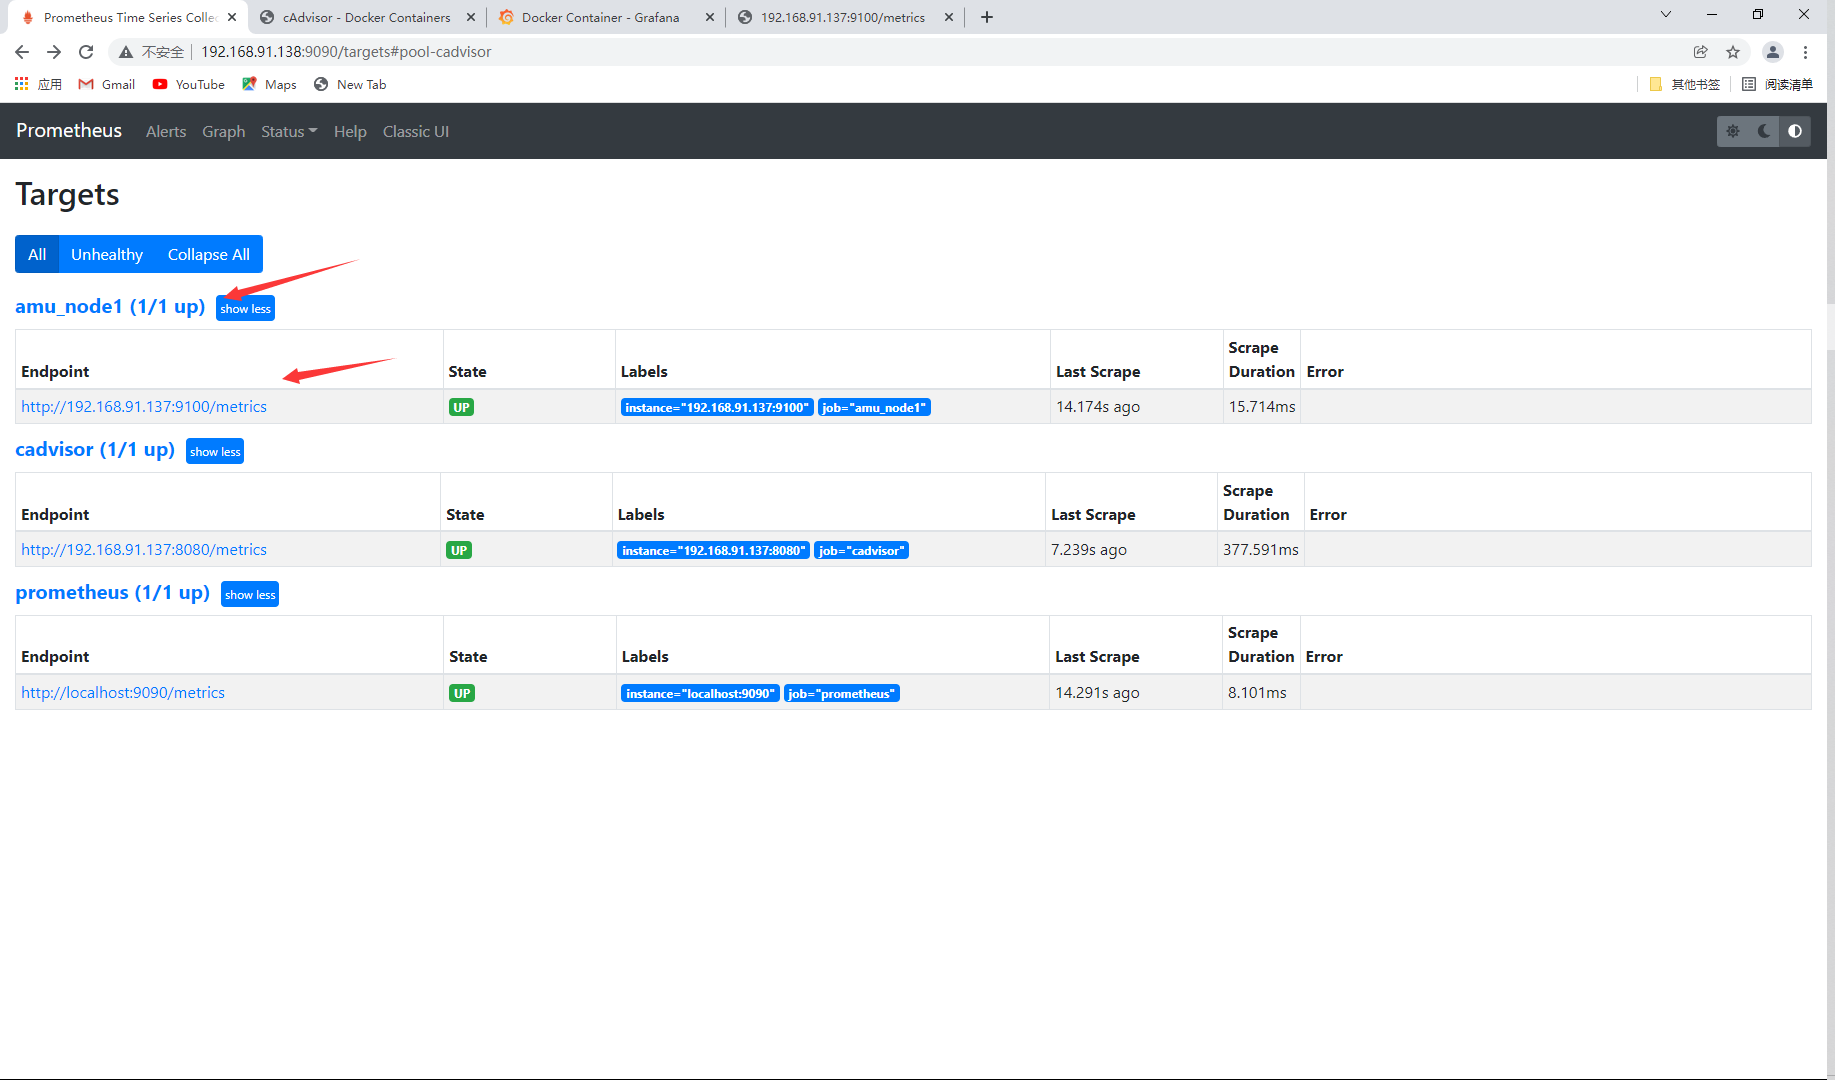
Page access
. View monitoring node status
Deploy AlertManager on node1 host
Pull the official image of prom/alertmanager
[root@node1 ~]# docker pull prom/alertmanager

[root@node1 ~]# docker images | grep alertmanager
prom/alertmanager                                    latest    ba2b418f427c   4 months ago   57.5MB
Run the alertmanager container on the node1 node host and map the ports
// Run container
[root@node1 ~]# docker run --name alertmanager -d -p 9093:9093 prom/alertmanager
5e1e3d285084f64d44284497e2aeca1789d81b2b9b88b4cae8962f3d8266897e

[root@node1 ~]# docker ps | grep alertmanager
5e1e3d285084   prom/alertmanager                                   "/bin/alertmanager -..."   19 seconds ago   Up 17 seconds   0.0.0.0:9093->9093/tcp, :::9093->9093/tcp   alertmanager
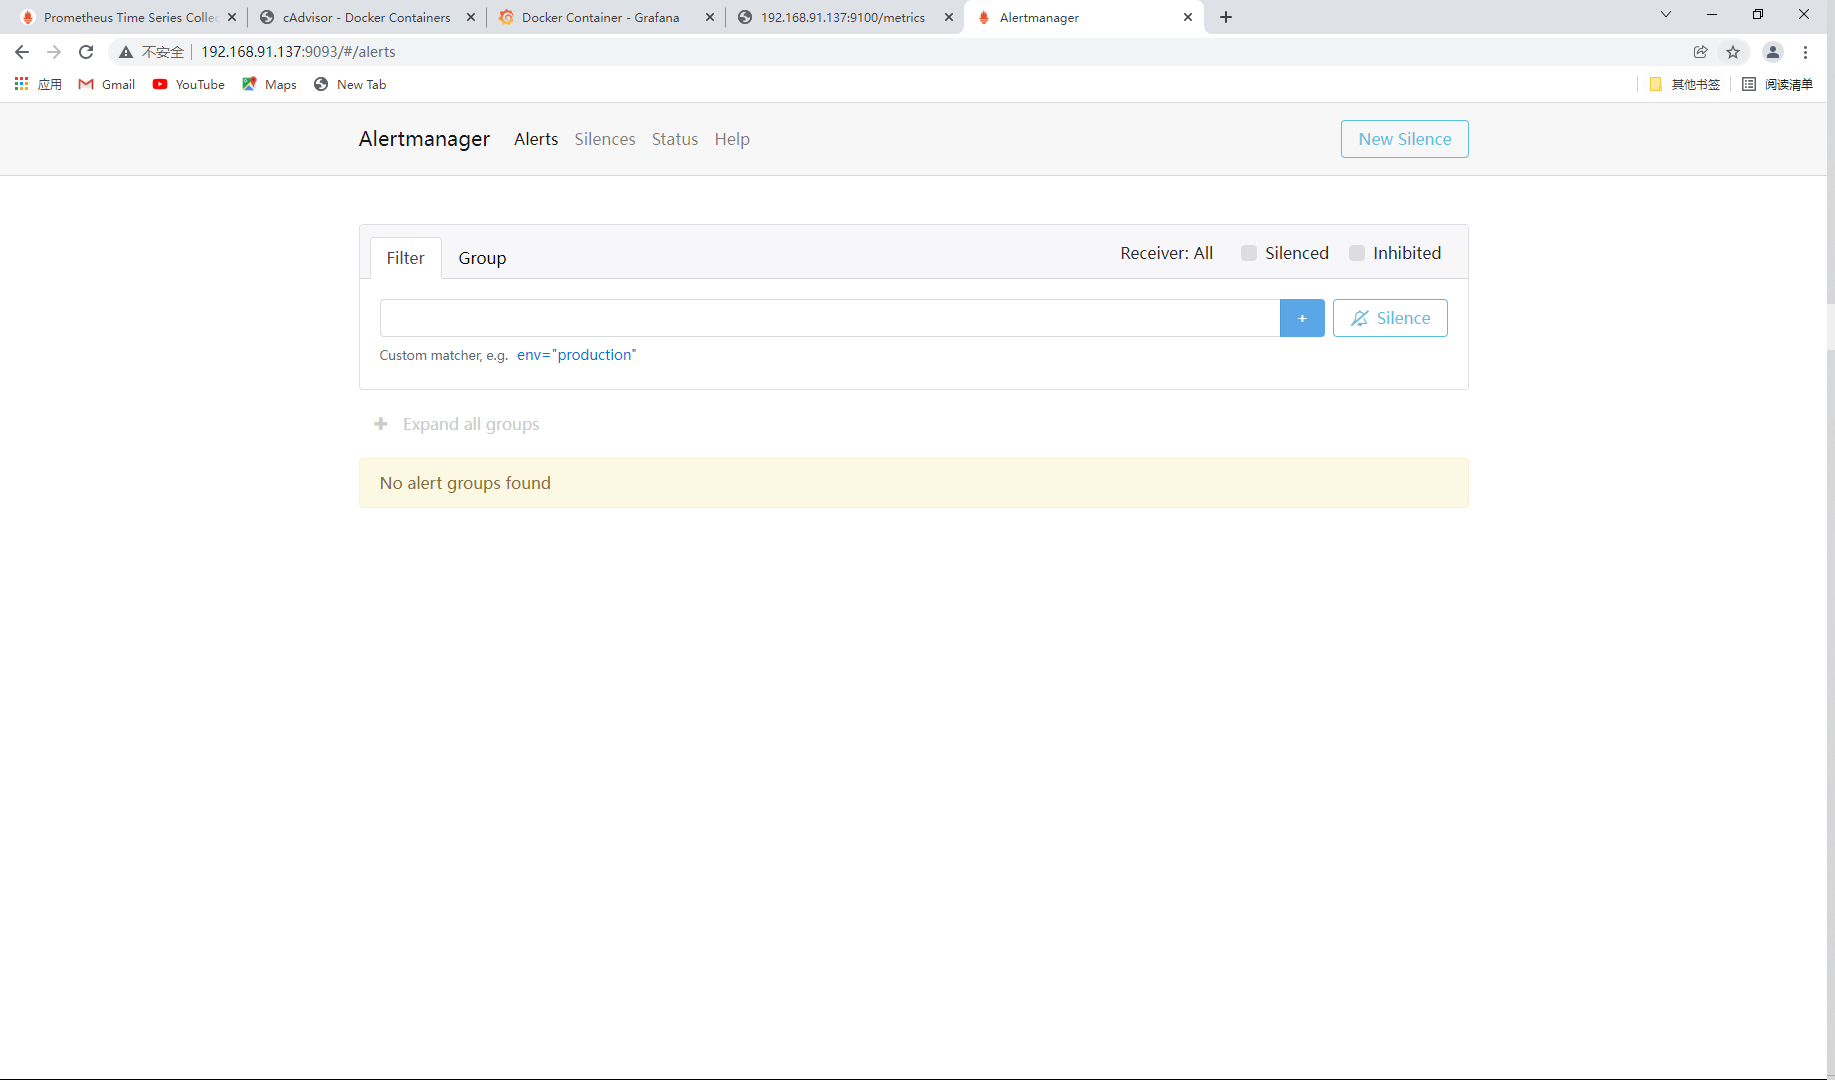
Page access
The default startup port of AlertManager is 9093. After startup, the browser can access http://:9093 to see the UI page provided by default. However, there is no alarm information now, because we have not configured alarm rules to trigger alarms.
5, Alert manager configuring mail alerts
The default configuration file for AlertManager is AlertManager YML, in the container, the path is / etc / AlertManager / AlertManager YML, the default configuration is as follows:
global:
  resolve_timeout: 5m

route:
  group_by: ['alertname']
  group_wait: 10s
  group_interval: 10s
  repeat_interval: 1h
  receiver: 'web.hook'
receivers:
- name: 'web.hook'
  webhook_configs:
  - url: 'http://127.0.0.1:5001/'
inhibit_rules:
  - source_match:
      severity: 'critical'
    target_match:
      severity: 'warning'
    equal: ['alertname', 'dev', 'instance']
Briefly introduce the functions of the main configurations:
- Global: global configuration, including timeout after alarm resolution, SMTP related configuration, API address for notification through various channels, etc.
- route: used to set the alarm distribution policy. It is a tree structure and matches from left to right according to depth priority.
- receivers: configure alarm message receiver information, such as common message notification methods such as email, wechat, slack, webhook, etc.
- inhibit_rules: suppression rule configuration. When there are alerts (sources) matching another group, suppression rules will disable alerts (targets) matching one group.
Then, let's configure Email to notify the alarm information. Here, take Netease mailbox as an example, and the configuration is as follows:
[root@node1 ~]# vi alertmanager.yml
global:
  resolve_timeout: 6m
  smtp_from: 'amuxc159@163.com'
  smtp_smarthost: 'smtp.163.com:465'
  smtp_auth_username: 'amuxc159@163.com'
  smtp_auth_password: 'AMUXINGCHEN'
  smtp_require_tls: false
  smtp_hello: 'qq.com'
route:
  group_by: ['alertname']
  group_wait: 6s
  group_interval: 6s
  repeat_interval: 6m
  receiver: 'email'
receivers:
- name: 'email'
  email_configs:
  - to: '2781551316@qq.com'
    send_resolved: true
inhibit_rules:
  - source_match:
      severity: 'critical'
    target_match:
      severity: 'warning'
    equal: ['alertname', 'dev', 'instance']
- smtp_smarthost: here is the SMTP service address of QQ mailbox, and the official address is SMTP qq. COM port is 465 or 587, and POP3/SMTP service should be set to start.
- smtp_auth_password: here is the authorization code for the third party to log in to the QQ mailbox, not the QQ account login password, otherwise an error will be reported. The acquisition method is set at the QQ mailbox server, and will be prompted when the POP3/SMTP service is enabled.
- smtp_require_tls: whether to use tls. It can be turned on and off according to different environments. If you are prompted with an error, email Loginauth failed: 530 must issue a starttls command first, then it needs to be set to true. To be clear, if you enable tls, you will be prompted with an error starttls failed: x509: certificate signed by unknown authority, which needs to be sent in email_ Configure under config -- secure_ skip_ Verify: true to skip tls verification.
Create the alertmanager container and copy the configuration file to the node1 host
[root@node1 ~]# docker cp alertmanager:/etc/alertmanager/alertmanager.yml /root/alertmanager.yml

[root@node1 ~]# mkdir prometheus
[root@node1 ~]# mv alertmanager.yml prometheus
[root@node1 ~]# cd prometheus
[root@node1 prometheus]# ls
alertmanager.yml
Modify the AlertManager startup command to the local AlertManager Mount the YML file to the specified location in the container.
[root@node1 ~]# docker run -d --name alertmanager -p 9093:9093 -v /root/prometheus/alertmanager.yml:/etc/alertmanager/alertmanager.yml prom/alertmanager
3b32978a4d39bae1a2a946802551b70b8e05b04ae2ed01d5f55795170f980b9a

[root@node1 ~]# docker ps | grep alertmanager
3b32978a4d39   prom/alertmanager                                   "/bin/alertmanager -..."   26 seconds ago   Up 24 seconds   0.0.0.0:9093->9093/tcp, :::9093->9093/tcp   alertmanager
Prometheus configuring AlertManager alarm rules (master side)
Next, we need to configure the AlertManager service address and alarm rules in Prometheus, and create a new alarm rule file node up The rules are as follows:
$ mkdir -p /opt/prometheus/rules && cd /opt/prometheus/rules/
$ vim node-up.rules
groups:
- name: node-up
  rules:
  - alert: node-up
    expr: up{job="node-exporter"} == 0
    for: 15s
    labels:
      severity: 1
      team: node
    annotations:
      summary: "192.168.91.137 Stopped for more than 15 minutes s!"
Note: the purpose of the rules is to monitor whether the node is alive. expr is a PromQL expression to verify whether a specific node job = "node exporter" is alive. for indicates that after the alarm status is Pending, wait 15s to change to the filling status. Once it changes to the filling status, the alarm will be sent to the AlertManager.
Then, modify Prometheus YML configuration file, add rules rule file.
[root@master ~]# vim /opt/prometheus.yml
# my global config
global:
  scrape_interval: 15s # Set the scrape interval to every 15 seconds. Default is every 1 minute.
  evaluation_interval: 15s # Evaluate rules every 15 seconds. The default is every 1 minute.
  # scrape_timeout is set to the global default (10s).

# Alertmanager configuration
alerting:
  alertmanagers:
    - static_configs:
        - targets:
          - 192.168.91.137:9093		// Modify this row

rule_files:							// Add two lines
  - "/usr/local/prometheus/rules/*.rules"
Note: here is rule_files is the path in the container, and the local node up Mount the rules file to the specified path in the container, modify the Prometheus startup command as follows, and restart the service.
[root@master rules]# docker run --name prometheus -d -p 9090:9090 \
> -v /opt/prometheus.yml:/etc/prometheus/prometheus.yml:ro \
> -v /root/prometheus/rules/:/usr/local/prometheus/rules/ \
> prom/prometheus
f776b1859f86f1991c314333a6256c8a8e0da426511285e9b3a41ebe1207b48c

// Service exception failed to start
[root@master rules]# docker ps -a| grep prometheus
f776b1859f86   prom/prometheus                                     "/bin/prometheus --c..."   45 seconds ago   Exited (2) 44 seconds ago                                               prometheus
For detailed deployment of Prometheus containerization, click here: Prometheus container deployment