
I First, learn about ELK+Filebeat
Official website address: https://www.elastic.co/cn/
Elasticsearch is a distributed, RESTful style search and data analysis engine

Logstash is a free and open server-side data processing pipeline

Kibana is a free and open user interface that allows you to visualize Elasticsearch data

Filebeat is a lightweight log collection and processing tool (Agent). Filebeat occupies less resources. It is suitable for collecting logs on each server and transmitting them to Logstash

II Officially enter today's deployment
Because of the prevalence of containerization, we also use docker deployment. However, because we only demonstrate this distributed logging solution, all tools are only deployed on a single machine for the time being. I hope you have a little understanding of the concept of containerization
Because ELK is a distributed governance scheme, we will use the docker service to arrange docker compose
-
Install docker compose
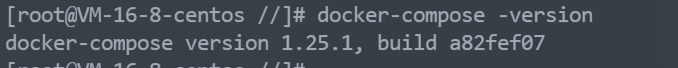
#Download from github (if the download is slow, you can use the following)
sudo curl -L https://github.com/docker/compose/releases/download/1.16.1/docker-compose-`uname -s`-`uname -m` -o /usr/local/bin/docker-compose

#Download from daocloud (we use this download method here)
sudo curl -L https://get.daocloud.io/docker/compose/releases/download/1.25.1/docker-compose-`uname -s`-`uname -m` -o /usr/local/bin/docker-compose

#Add executable permissions after downloading
sudo chmod +x /usr/local/bin/docker-compose

#Check to see if the installation is complete
docker-compose -version
The version number indicates that the download is complete
-
Then we add the files that ELK needs to mount to the host
-
logstash
#Create folder
mkdir /home/docker/elk/logstash
#Enter directory
cd /home/docker/elk/logstash
#Create file
touch logstash.conf
#Edit file
vim logstash.conf
logstash.conf
input {
  beats {
    #logstash: develop the port that accepts logs
    port => 4567
  }
}
filter {
  #Only matched data are send to output.
}
output {
  elasticsearch {
    #Machine address of elasticsearch +
    hosts  => ["http://ElasticSearch machine ip:9200 "] #ElasticSearch host, can be array
    #elasticsearch index
    index  => "logapp-%{+YYYY.MM}"         #The index to write data to.
  }
}
-
kinbana
mkdir /home/docker/elk/kibana
#Enter directory
cd /home/docker/elk/kibana
#Create file
touch kibana.yml
#Edit file
vim kibana.yml
kibana.yml
#
# ** THIS IS AN AUTO-GENERATED FILE **
#

# Default Kibana configuration for docker target
server.name: kibana
server.host: "0"
#elasticsearch machine ip address
elasticsearch.hosts: [ "http://elasticsearch machine ip:9200 "]
monitoring.ui.container.elasticsearch.enabled: true
#Chinese plugin
i18n.locale: "zh-CN"
-
docker-compose
#Enter the docker directory of our host computer
cd //./home/docker/
#Create docker compose} file
touch docker-compose-elk.yml
#Edit file
vim docker-compose-elk.yml
docker-compose-elk.yml
version: '3.7'
services:
  elasticsearch:
    image: elasticsearch:7.9.0
    container_name: elasticsearch
    privileged: true
    user: root
    environment:
      #Set the cluster name to elasticsearch
      - cluster.name=elasticsearch
      #Start in single node mode
      - discovery.type=single-node
      #Sets the amount of memory used by the jvm
      - ES_JAVA_OPTS=-Xms512m -Xmx512m
    volumes:
      - /home/docker/elk/elasticsearch/plugins:/usr/share/elasticsearch/plugins
      - /home/docker/elk/elasticsearch/data:/usr/share/elasticsearch/data
    ports:
      - 9200:9200
      - 9300:9300

  logstash:
    image: logstash:7.9.0
    container_name: logstash
    ports:
       - 4567:4567
       - 5044:5044
       - 5045:5045
    privileged: true
    environment:
      - TZ=Asia/Shanghai
    volumes:
      #Mount the configuration file of logstash
      - /home/docker/elk/logstash/logstash.conf:/usr/share/logstash/pipeline/logstash.conf
    depends_on:
      - elasticsearch
    links:
      #You can use the es domain name to access the elastic search service
      - elasticsearch:es
  kibana:
    image: kibana:7.9.0
    container_name: kibana
    ports:
        - 5601:5601
    privileged: true
    links:
      #You can use the es domain name to access the elastic search service
      - elasticsearch:es
    depends_on:
      - elasticsearch
    environment:
      #Set the address to access elasticsearch
      - elasticsearch.hosts=http://elasticsearch machine ip:9200
    volumes:
      - /home/docker/elk/kibana:/config
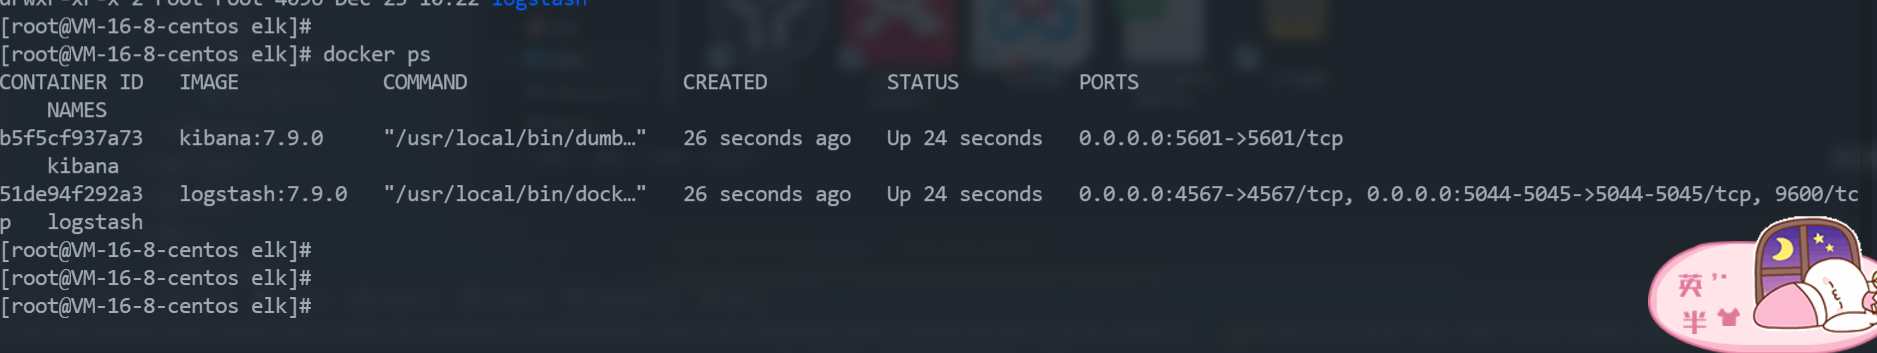
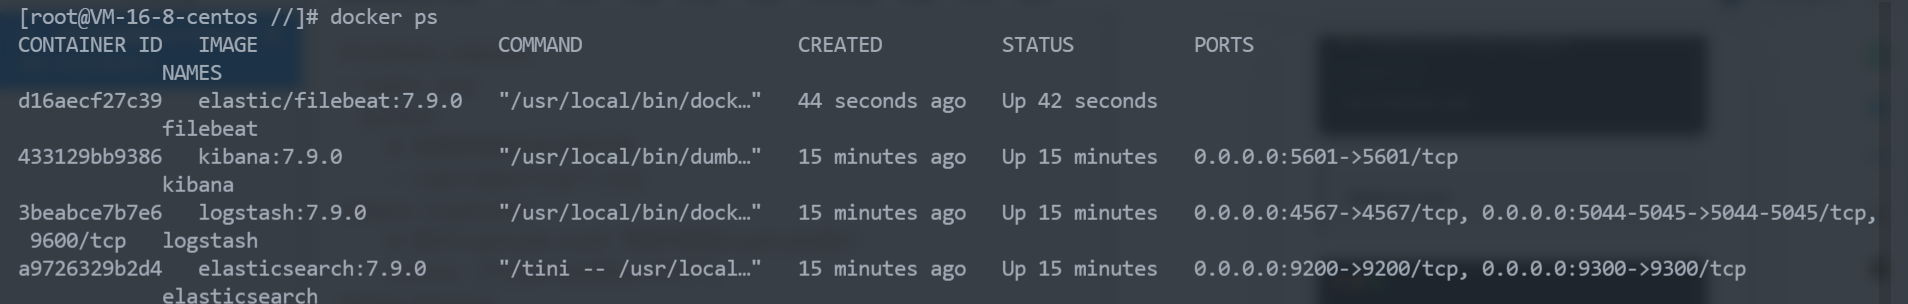
#Start docker
docker-compose -f docker-compose-elk.yml up -d
#View container running status
docker ps
!!! We found that elasticsearch failed to start. OMG haha, don't panic. In fact, the data directory of elasticsearch doesn't have default permissions
#Read and write permissions to the data directory of the host
chmod 777 /home/docker/elk/elasticsearch/data

#Close the docker container
docker-compose -f docker-compose-elk.yml down

#Restart the docker container
docker-compose -f docker-compose-elk.yml up -d
-
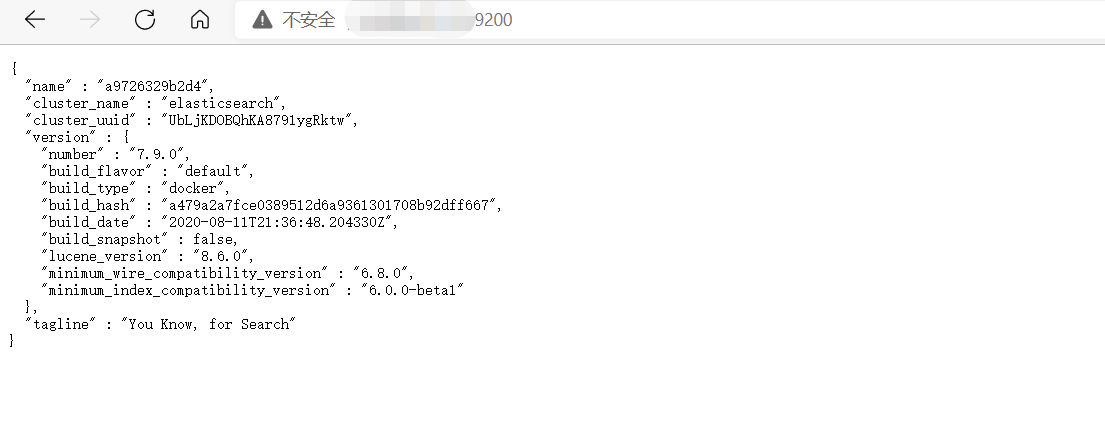
Check whether the container is started successfully
ip:9200 view elasticsearch
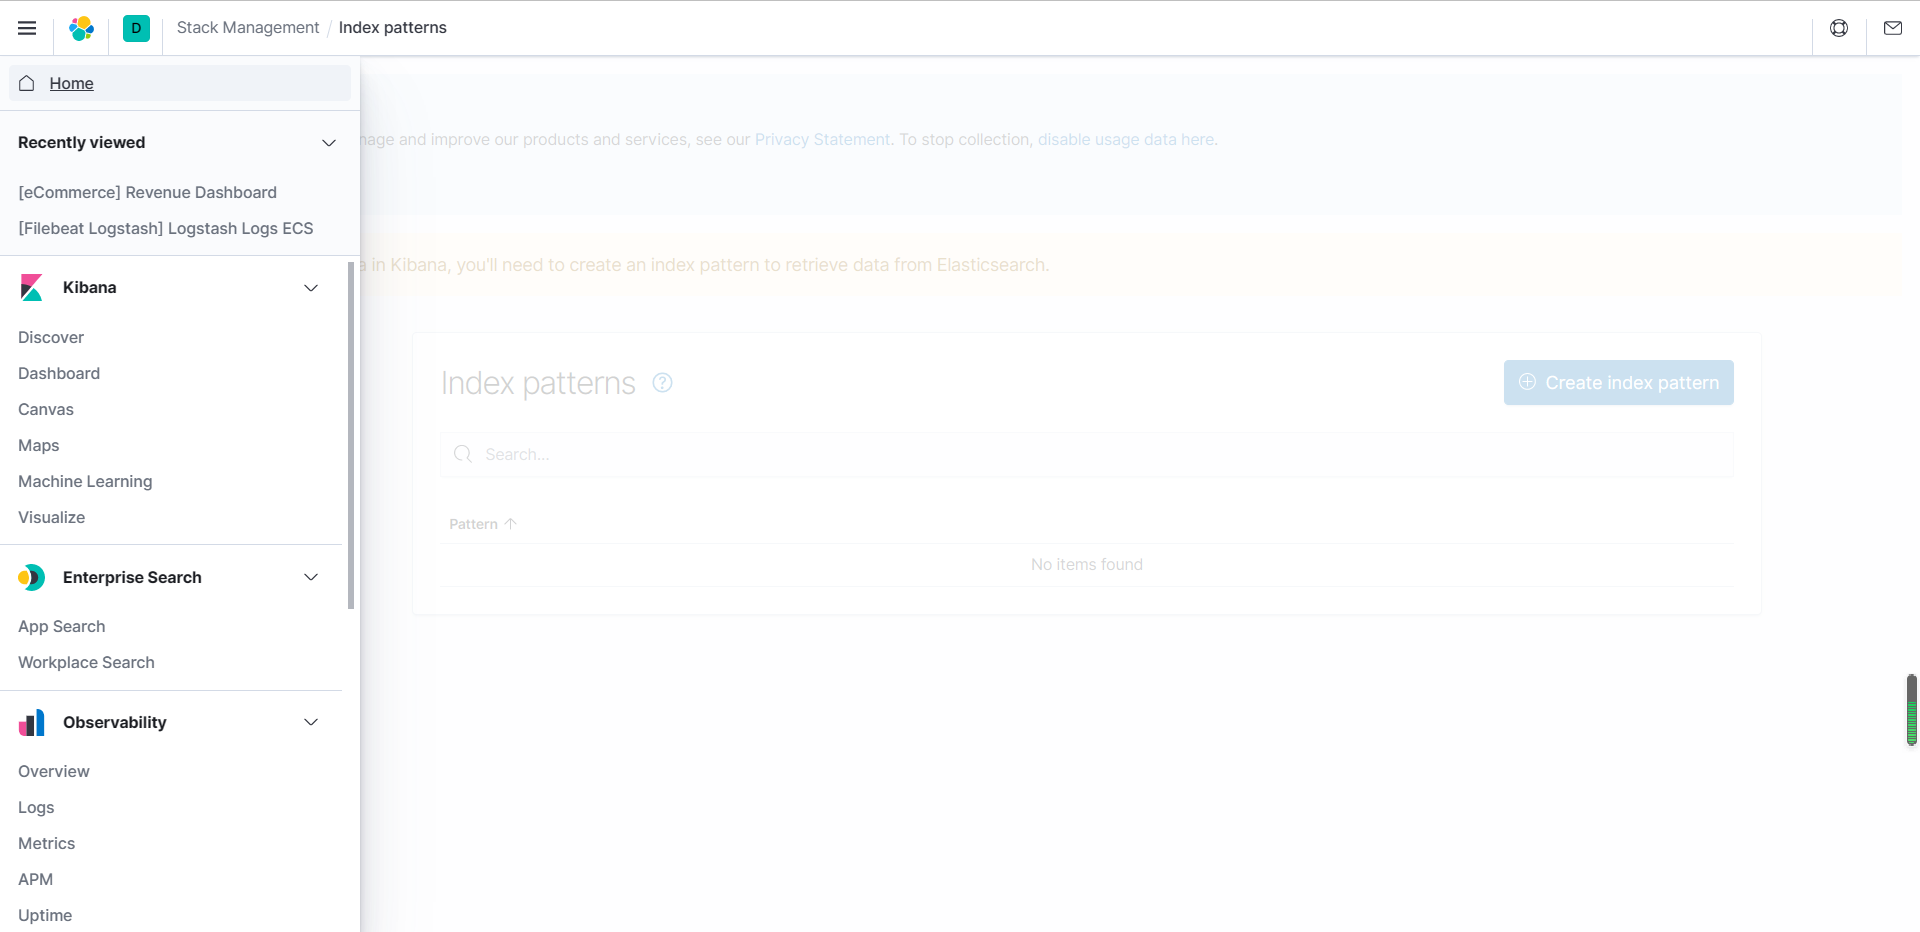
ip:5601 using kibana
Here, our ELK deployment is deployed, but we don't know how to use it. In fact, logstash can be used to collect logs now, but logstash consumes a lot of memory and cpu, so we use a relatively lightweight log collection filebeat
-
Deploy filebeat
The old rule is to go to the server where you want to collect logs. To create a new filebeat, you need to mount the file filebeat to the host computer yml
#Create folder
mkdir /home/docker/elk/filebeat
#Enter directory
cd /home/docker/elk/filebeat
#Edit file
vim filebeat.yml
filebeat.yml
filebeat.inputs:
- type: log
  paths:
    #Directory of collected log files
    - /var/log/logapp/*.log
output.logstash:
    #Note that only IP # no protocol, no HTTP!!!
    hosts: ["logstash of ip:4567"]
setup.kibana:
  #Note that only IP # no protocol, no HTTP!!!
  host: "kibana of ip port"
#Start container
docker run -u root -v /var/log/logapp:/var/log/logapp:rw -v /home/docker/elk/filebeat/filebeat.yml:/usr/share/filebeat/filebeat.yml:ro -d --name filebeat elastic/filebeat:7.9.0
Container started successfully
-
Test elk+filebeat
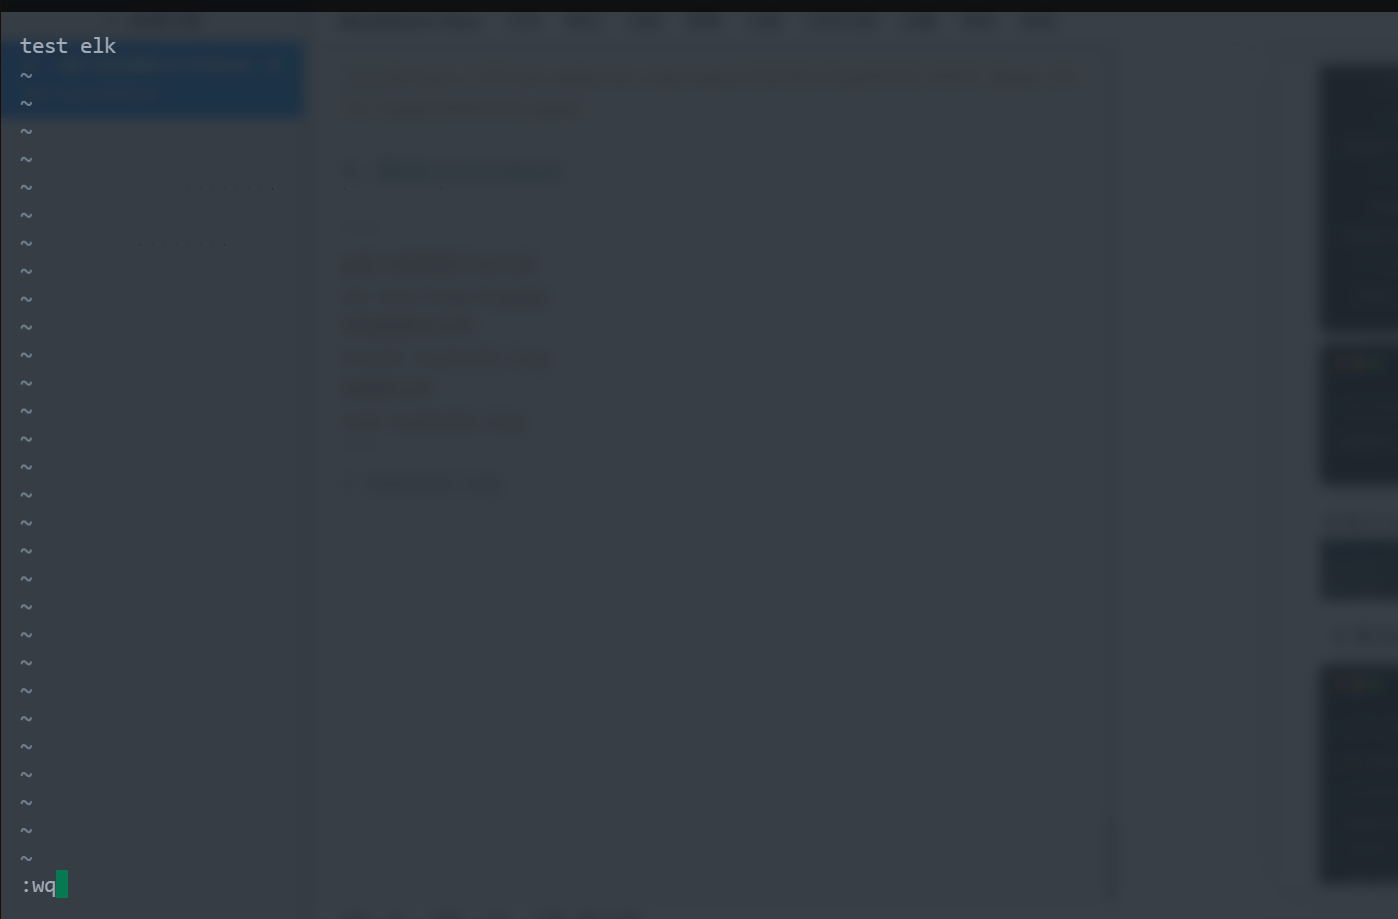
#Enter the collected log directory
cd var/log/logapp
#Create test file
touch testelk.log
#Edit file
vim testelk.log
testelk.log
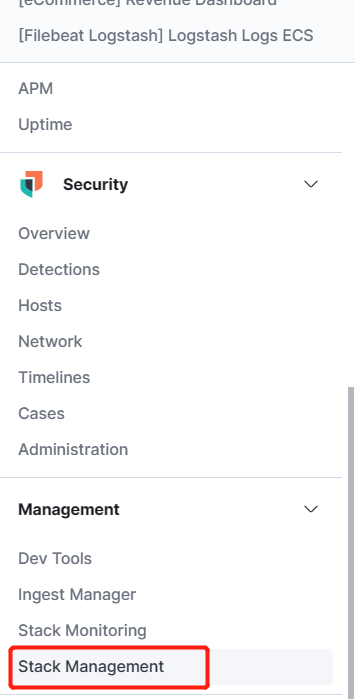
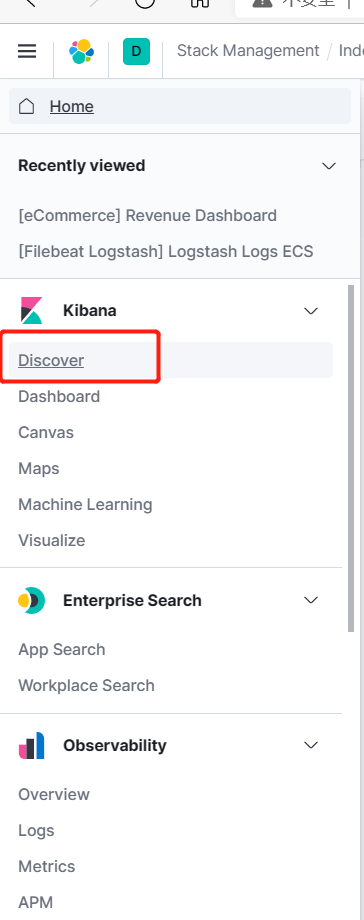
Let's go to kibana and create an index pattern
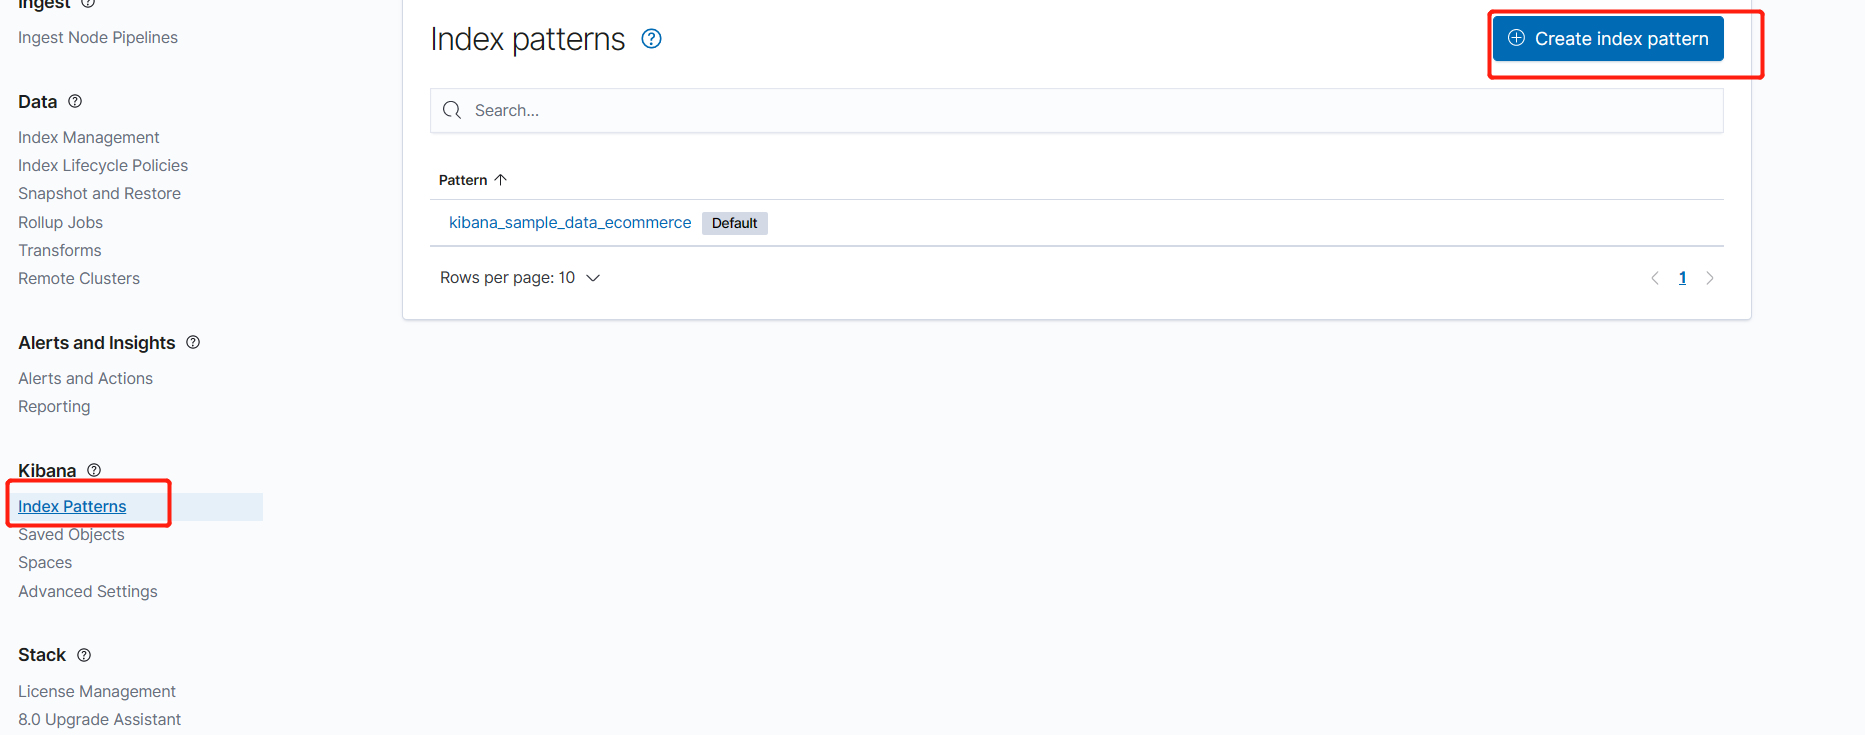
Create logapp-*
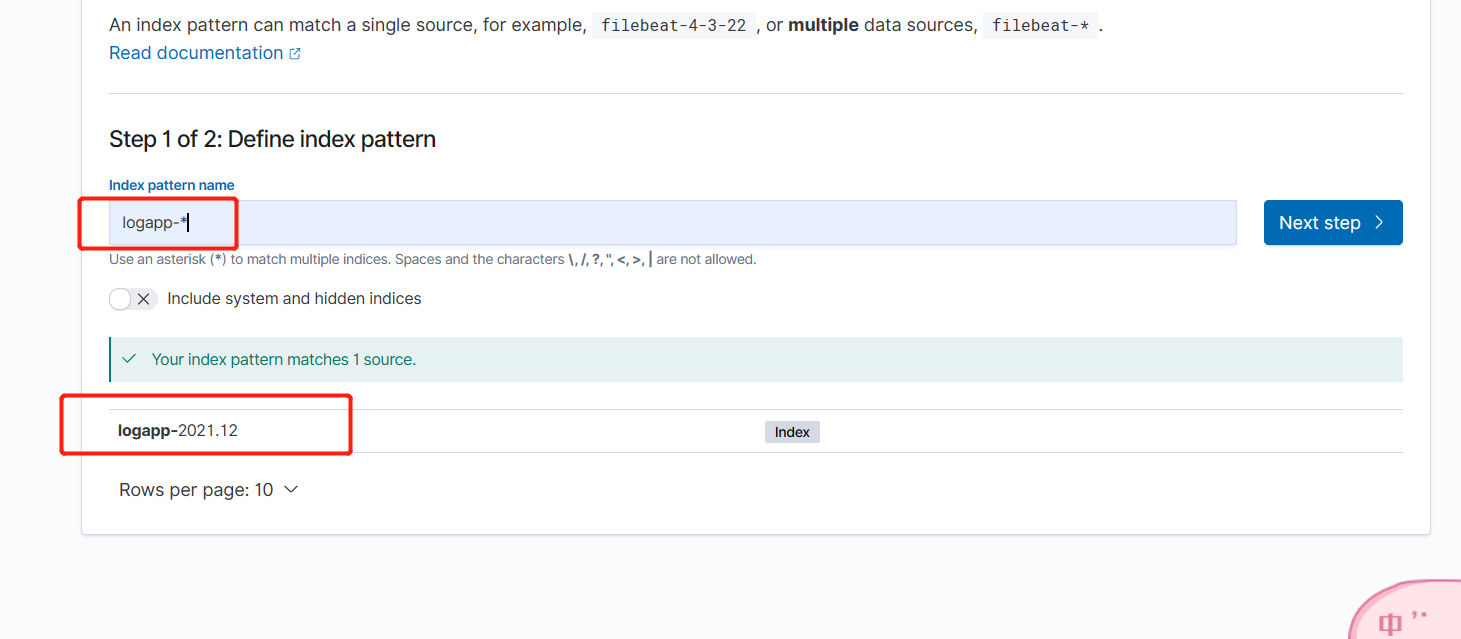
Query according to index mode
I found that the testelk we wrote in before has been collected
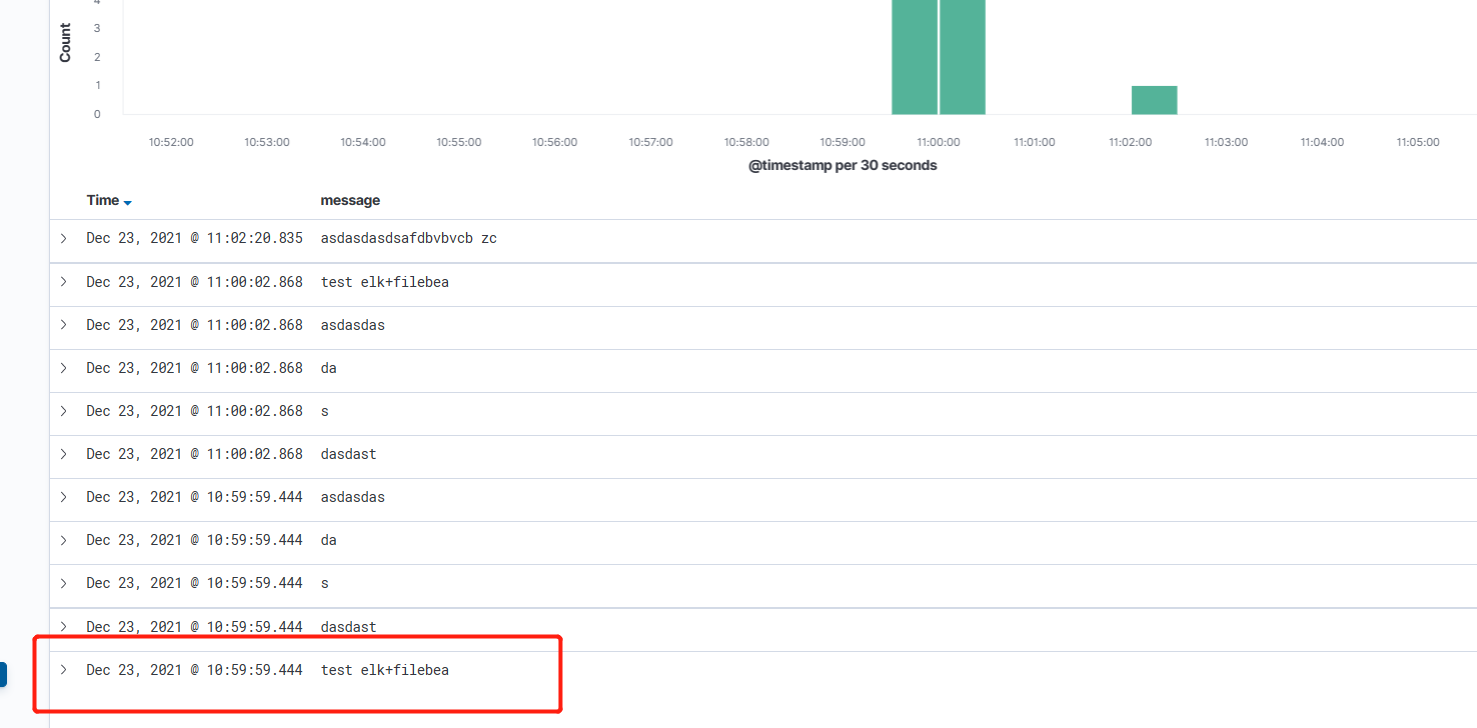
So far, our elk+kibana has been deployed. You can deploy a filebeat on which machine you want to collect the logs of which server, and then point to the ip: port of logstash to complete a set of distributed log collection. If you find problems in the middle and the logs are not collected according to this step, it is a process to solve the service deployment slowly, Solving problems is also one aspect of the programmer level of postgraduate entrance examination. Take your time. I hope this article can be helpful to you