Pneumothorax can be caused by blunt chest injury, damage caused by potential lung disease, or the most terrible cause - it may have no obvious cause at all. In some cases, collapse of the lungs can be life-threatening.
Pneumothorax is usually diagnosed by radiologists through chest X-rays, which is sometimes difficult to confirm. An accurate AI algorithm for detecting pneumothorax will be useful in many clinical scenarios. AI can be used to classify chest radiographs for priority interpretation, or to provide more confident diagnosis for non radiologists.
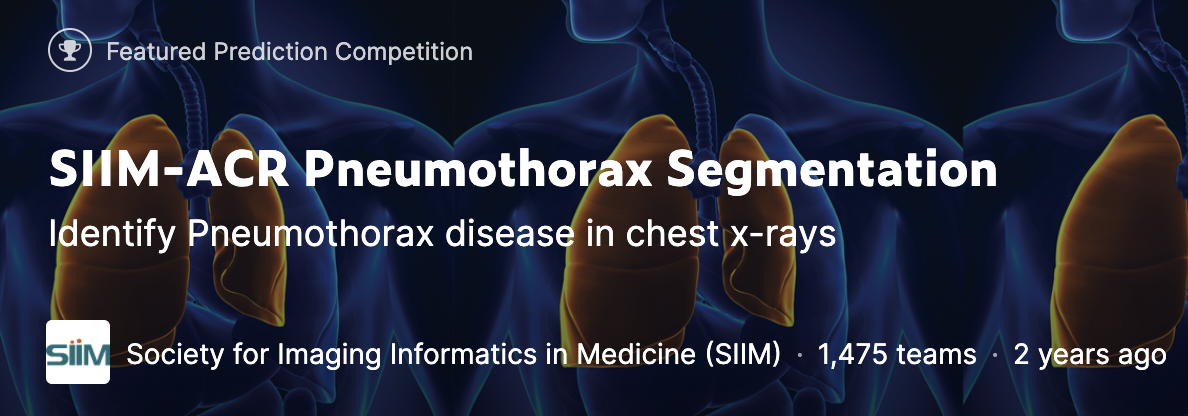
In August 2019, the goal of the pneumothorax segmentation and recognition competition held by society for imaging information in medicine (SIIM) is to detect the presence of pneumothorax on chest X-ray. How to segment the position and shape of the diseased area of pneumothorax patients on the X-ray film of pneumothorax patients.
This paper mainly analyzes and processes the pneumothorax X-ray chest film data disclosed in this competition, which will be carried out from three aspects: Data Acquisition - > Data Visualization - > data dump. Strive to have a more in-depth understanding of the composition and processing methods of this batch of data. Lay a solid foundation for follow-up training, testing and so on.
Finally, I will share the processed data directly for easy download. Download link: Download link after chest X-ray pneumothorax labeling processing . Let's start now!
1, Competition and data introduction
Competition address: https://www.kaggle.com/c/siim-acr-pneumothorax-segmentation
Original data download address: https://www.kaggle.com/c/siim-acr-pneumothorax-segmentation/discussion/108009
The data of image segmentation is divided into two parts (add a json part, and you can skip reading if you don't need it):
- Training pictures, JPEG format
- The part of a picture that needs to be divided is called a mask
- Attach commonly used json files for detection
This time, the image data to be processed is stored in DCM file. What is DICOM?
DCM is a kind of digital imaging, which is widely used in the field of medicine, but it is not limited to medicine. DCM itself is a special image file, which can be used to store all kinds of image information.
DCM file is a file that follows DICOM standard. Most medical images are stored in this data format.
The data of our mask is stored in a csv file, which is familiar to everyone. We won't introduce it here. Later, we analyze the csv and get the pneumothorax injection part of the mask standard.
2, Data processing
2.1 importing mask data
First, let's look at the mask annotation data in the csv file where the mask data is stored. Read using pandas_ csv interface reads train RLE csv file, which reads the entire csv content into memory at one time. The code is as follows:
# Get annotation information
rles_df = pd.read_csv(r'Z:\SIIM-ACR-Pneumothorax-Segmentation/train-rle.csv')
rles_df.columns = ['ImageId', 'EncodedPixels']
print(rles_df.head())
Print and view the first 5 pieces of data, and the results are as follows:
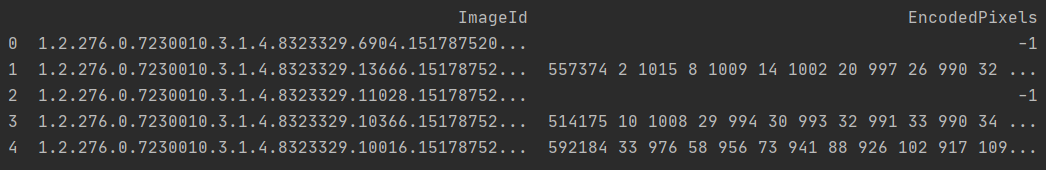
You can see that there are two columns in the csv file, one is ImageId and the other is encoded pixels.
- Train RLE contains 12955 dicom documents (standing chest film), with pneumothorax: without pneumothorax = 3577:9378
- The ImageId column is easy to understand. It is the id of the training data, which corresponds to the file name of the DCM file and the SOPInstanceUID in the DCM file. This contact clue is very important.
- Encoded pixels actually store the pixel data of the mask. These pixel data are stored in run length encoded (RLE) encoding.
Next, we need to define a function to restore RLE encoded data to mask image data. This part of the official has provided a function for us to use directly, as follows:
def rle2mask(rle, width, height):
    """
    take RLE Restore encoded data to mask Picture data
    """
    mask = np.zeros(width * height)
    array = np.asarray([int(x) for x in rle.split()])
    starts = array[0::2]
    lengths = array[1::2]

    current_position = 0
    for index, start in enumerate(starts):
        current_position += start
        mask[current_position:current_position+lengths[index]] = 255
        current_position += lengths[index]

    return mask.reshape(width, height)
2.2 importing DCM files
Next, we will read DCM into and store it in the dictionary for easy viewing and use in the future. We also incorporate the previously read mask data into the corresponding ImageId dictionary.
In the training data, if the chest film is not mask ed, it means that he does not have pneumothorax. Record whether the patient is pneumothorax in has through the data in encoded pixels_ In the pneumothorax field- 1 means no pneumothorax and no marking information.
During subsequent operations on annotation information, remember to skip the pair of data marked as - 1, otherwise an error will be reported.
def dicom_to_dict(dicom_data, file_path, rles_df, encoded_pixels=True):
    """
    obtain dicom Relevant information recorded, and encoded_pixels
    """
    data = {}

    # Parse fields with meaningful information
    data['patient_name'] = dicom_data.PatientName
    data['patient_id'] = dicom_data.PatientID
    data['patient_age'] = int(dicom_data.PatientAge)
    data['patient_sex'] = dicom_data.PatientSex
    data['Rows'] = dicom_data.Rows
    data['Columns'] = dicom_data.Columns
    data['pixel_spacing'] = dicom_data.PixelSpacing
    data['file_path'] = file_path
    data['id'] = dicom_data.SOPInstanceUID

    # look for annotation if enabled (train set)
    if encoded_pixels:
        encoded_pixels_list = rles_df[rles_df['ImageId']==dicom_data.SOPInstanceUID]['EncodedPixels'].values

        pneumothorax = False
        for encoded_pixels in encoded_pixels_list:
            if encoded_pixels != ' -1':
                pneumothorax = True

        data['encoded_pixels_list'] = encoded_pixels_list
        data['has_pneumothorax'] = pneumothorax
        data['encoded_pixels_count'] = len(encoded_pixels_list)

    return data
Check whether the code of dcm is read and printed normally. The code is as follows:
# Get dcm data information
train_fns = sorted(glob.glob(r'Z:\mult_DR\kagglePublic_data\SIIM-ACR-Pneumothorax-Segmentation\tmp_train/*/*/*.dcm'))
train_metadata_df = pd.DataFrame()
train_metadata_list = []
for file_path in tqdm(train_fns):
dicom_data = pydicom.dcmread(file_path)
train_metadata = dicom_to_dict(dicom_data, file_path, rles_df)
train_metadata_list.append(train_metadata)
train_metadata_df = pd.DataFrame(train_metadata_list)
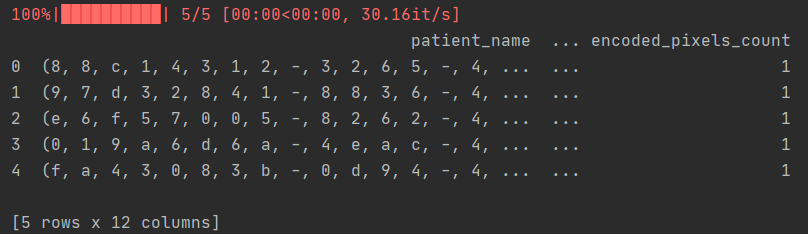
print(train_metadata_df.head())
Print header 5 lines as follows:
3, Data visualization
After reading the data, we will view the data next. While printing and viewing, it is also convenient for us to dump and save the visualized content.
3.1 visualization of case samples
We randomly selected four cases. We typed age, sex and whether it was pneumothorax in each case. The visualization code is as follows:
num_img = 4
subplot_count = 0
fig, ax = plt.subplots(nrows=1, ncols=num_img, sharey=True, figsize=(num_img * 10, 10))
for index, row in train_metadata_df.sample(n=num_img).iterrows():
    dataset = pydicom.dcmread(row['file_path'])
    ax[subplot_count].imshow(dataset.pixel_array, cmap=plt.cm.gray)
    # label the x-ray with information about the patient
    ax[subplot_count].text(0, 0, 'Age:{}, Sex: {}, Pneumothorax: {}'.format(row['patient_age'], row['patient_sex'],
                                                                            row['has_pneumothorax']),
                           size=26, color='white', backgroundcolor='black')
    subplot_count += 1

plt.show()
fig.savefig('data.png')
plt.pause(15)  # Display seconds
plt.close()
The images displayed are as follows:
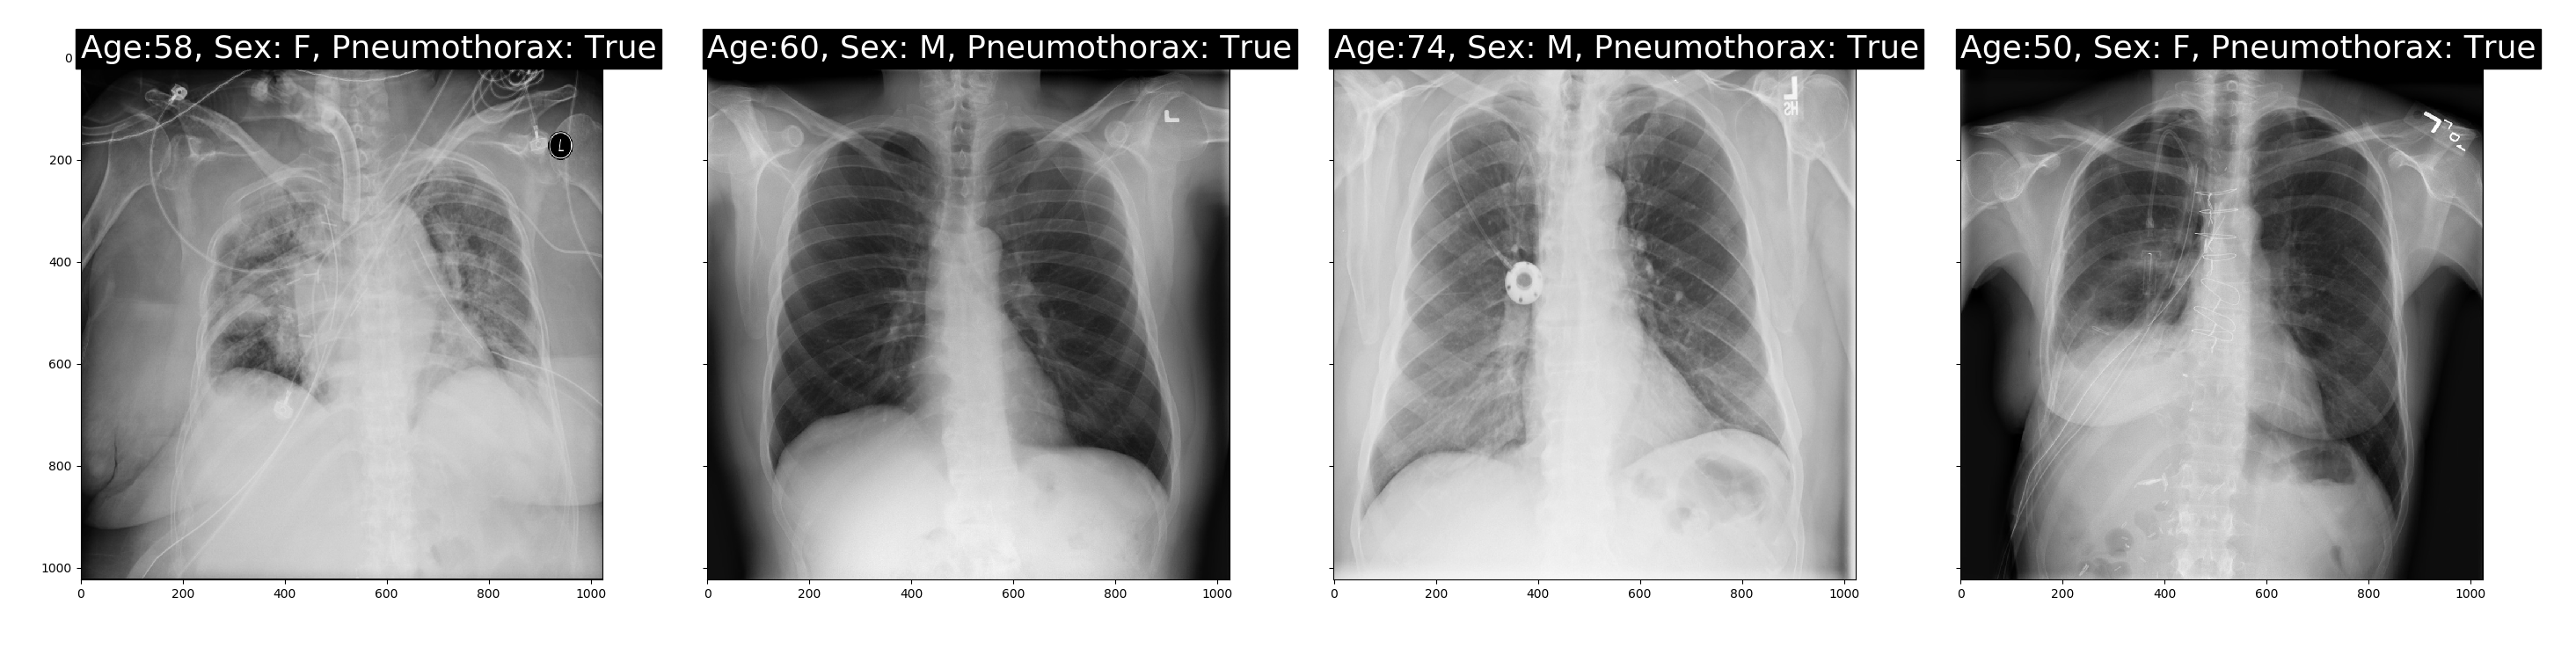 It can be seen that the image files obtained by dcm can be directly displayed, and the relevant information of the patient and whether it is pneumothorax can also be obtained. Later, we will start to further process and display the annotation information.
3.2 mask visualization
Let's look at the position of the mask image in the corresponding case:
We show it in two groups:
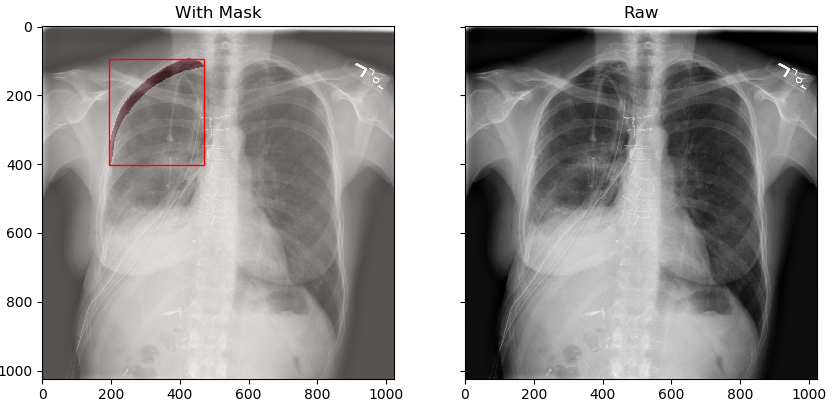
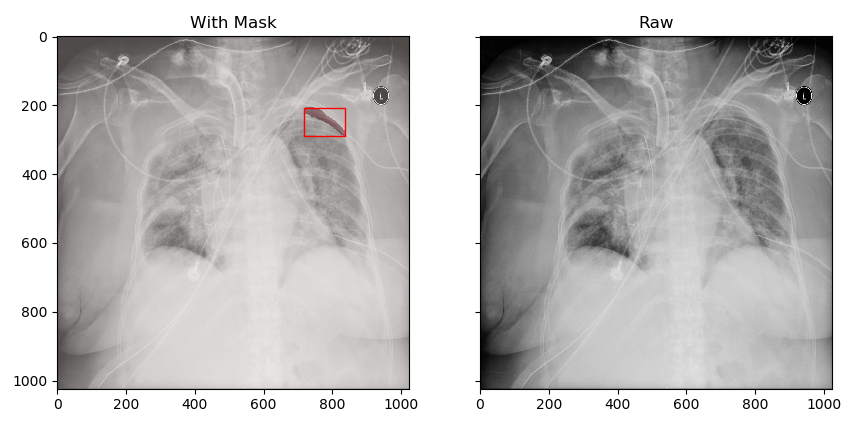
- In the first group, we frame the smallest bounding box of the mask with a red frame in the original chest film image Then, the data part of the mask is distinguished by different colors
- In the second group, we directly display the original image
The two are in contrast to see where we marked the pneumothorax position. (the watching part contains the contents of 3.1)
def bounding_box(img):
    # return max and min of a mask to draw bounding box
    rows = np.any(img, axis=1)
    cols = np.any(img, axis=0)
    rmin, rmax = np.where(rows)[0][[0, -1]]
    cmin, cmax = np.where(cols)[0][[0, -1]]

    return rmin, rmax, cmin, cmax

def plot_with_mask_and_bbox(file_path, mask_encoded_list,  rows, columns, figsize=(20,10)):
    pixel_array = pydicom.dcmread(file_path).pixel_array

    # use the masking function to decode RLE
    mask_decoded_list = [rle2mask(mask_encoded, rows, columns).T for mask_encoded in mask_encoded_list]
    print('mask_decoded:', mask_decoded_list)
    fig, ax = plt.subplots(nrows=1, ncols=2, sharey=True, figsize=(10,8))

    # print out the xray
    ax[0].imshow(pixel_array, cmap=plt.cm.gray)
    # print the bounding box
    for mask_decoded in mask_decoded_list:
        # print out the annotated area
        ax[0].imshow(mask_decoded, alpha=0.3, cmap="Reds")
        rmin, rmax, cmin, cmax = bounding_box(mask_decoded)
        # Draw some special shapes and paths, such as rectangles
        bbox = patches.Rectangle((cmin, rmin), cmax-cmin, rmax-rmin, linewidth=1, edgecolor='r', facecolor='none')
        ax[0].add_patch(bbox)   # Add drawing to diagram
    ax[0].set_title('With Mask')
    ax[1].imshow(pixel_array, cmap=plt.cm.gray)
    ax[1].set_title('Raw')

    plt.show()
    fig.savefig('./data/mask_raw.png')
    # plt.pause(15)  # Display seconds
    # plt.close()

def main_visual():
    # Get annotation information
    rles_df = pd.read_csv(r'Z:\mult_DR\kagglePublic_data\SIIM-ACR-Pneumothorax-Segmentation/train-rle.csv')
    rles_df.columns = ['ImageId', 'EncodedPixels']
    print(rles_df.head())

    # Get dcm data information
    train_fns = sorted(glob.glob(r'Z:\mult_DR\kagglePublic_data\SIIM-ACR-Pneumothorax-Segmentation\tmp_train/*/*/*.dcm'))
    train_metadata_df = pd.DataFrame()
    train_metadata_list = []
    for file_path in tqdm(train_fns):
        dicom_data = pydicom.dcmread(file_path)
        train_metadata = dicom_to_dict(dicom_data, file_path, rles_df)
        train_metadata_list.append(train_metadata)
    train_metadata_df = pd.DataFrame(train_metadata_list)
    print(train_metadata_df.head())

    # num_img = 4
    # subplot_count = 0
    # fig, ax = plt.subplots(nrows=1, ncols=num_img, sharey=True, figsize=(num_img * 10, 10))
    # for index, row in train_metadata_df.sample(n=num_img).iterrows():
    #     dataset = pydicom.dcmread(row['file_path'])
    #     ax[subplot_count].imshow(dataset.pixel_array, cmap=plt.cm.gray)
    #     # label the x-ray with information about the patient
    #     ax[subplot_count].text(0, 0, 'Age:{}, Sex: {}, Pneumothorax: {}'.format(row['patient_age'], row['patient_sex'],
    #                                                                             row['has_pneumothorax']),
    #                            size=26, color='white', backgroundcolor='black')
    #     subplot_count += 1
    #
    # plt.show()
    # fig.savefig('data.png')
    # plt.pause(15)  # Display seconds
    # plt.close()


    for index, row in train_metadata_df.sample(n=4).iterrows():
        file_path = row['file_path']
        print(file_path)
        rows = row['Rows']
        columns = row['Columns']
        mask_encoded_list = row['encoded_pixels_list']

        if len(mask_encoded_list) > 0:
            if mask_encoded_list[0] != '-1':
                plot_with_mask_and_bbox(file_path, mask_encoded_list, rows, columns)
The results are shown as follows:
 Here, the data related to pneumothorax are basically displayed. Later, we will start to save the annotation results and images for later operation.
4, Data dump
The annotation information is stored in CSV file to facilitate data transmission, but it is not easy to view and understand. Therefore, parsing the CSV file and dumping it into data that is easy for us to observe is what we need to do next.
The contents of the dump include two parts:
- Converting dcm to jepg image
- rle marks the mask information, which is transferred to the mask diagram and json mark file storage
Next, we will introduce them one by one.
4.1 DCM dump JPEG image
There are many ways to convert dcm files to png files, including image dump using currently available software, such as microdicom. You can also use pydicom in python to turn the graph. The main idea is to convert a wider range of dcm data to 0-255 that can be png or JPEG.
import os
import cv2
import pydicom
import numpy as np
import skimage.transform as transform

def dcm2jpeg(file, dst_path):
    print('FIle:', file)
    ds = pydicom.dcmread(file, force=True)
    # ds.file_meta.TransferSyntaxUID =
    # ds.file_meta.TransferSyntaxUID = pydicom.uid.ImplicitVRLittleEndian
    ori_img = np.array(ds.pixel_array)

    sharp = ori_img.shape
    _h = sharp[0]
    _w = sharp[1]
    if len(sharp) == 3:
        ori_img = ori_img[:, :, 0]
    img = transform.resize(ori_img, (_h, _w))

    start = img.min()
    end = img.max()

    img[img < start] = start
    img[img > end] = end
    img = np.array((img - start) * 255.0 / (end - start))
    if hasattr(ds, 'PhotometricInterpretation'):
        if ds.PhotometricInterpretation == 'MONOCHROME1':
            img = 255 - img
    jpeg_name = os.path.basename(file).replace('.dcm', '.jpeg')
    save_path = os.path.join(dst_path, jpeg_name)
    print(save_path)

    img = img.astype(np.uint8)
    cv2.imwrite(save_path, img, [int(cv2.IMWRITE_JPEG_QUALITY), 90])
    print('save ok')
    return jpeg_name

def do_convert(file_path, png_folder):
    try:
         jpeg_path = dcm2jpeg(file_path, png_folder)

    except Exception as e:
        print('main process has error:%s' % e)

def main():
    ini_folder = r'E:\temp\dcm'
    jpeg_folder = r'E:\temp\jpeg'
    for root, dirs, files in os.walk(ini_folder):
        for file in files:
            print(file)
            file_path = os.path.join(root, file)

            print('_pro' in file)
            if '_pro' in file:
                continue
            if file.lower().endswith('dcm') or file.lower().endswith('dicom'):
                do_convert(file_path, jpeg_folder)
                print('ok')

if __name__ == '__main__':
    main()
Take a comparison before and after turning the chart to make a display, as follows:
4.2 dump mask
4.2. 1. Pre save mask
In fact, we have extracted and displayed the pneumothorax mask information marked in CSV. The following work also intersects the above visualization parts, and the newly added part is the part stored as mask image. The complete code for saving the mask into a picture is as follows:
save_mask = r'Z:\SIIM-ACR-Pneumothorax-Segmentation\mask'
def save_maskImage(file_path, mask_encoded_list, rows, columns):
    # use the masking function to decode RLE
    mask_decoded_list = [rle2mask(mask_encoded, rows, columns).T for mask_encoded in mask_encoded_list]

    print('mask_decoded_list:', mask_decoded_list)

	# Judge whether there are multiple mask information, simply store it directly, and then add processing for mask merging (it is recommended to modify and merge by yourself if capable)
    if len(mask_decoded_list)>1:
        n=1
        for mask_decoded in mask_decoded_list:
            cv2.imwrite(save_mask + '/' + os.path.basename(file_path).split('.dcm')[0]+'_'+str(n)+'.png', mask_decoded)
            n+=1
    else:
        for mask_decoded in mask_decoded_list:
            cv2.imwrite(save_mask + '/'+os.path.basename(file_path).replace('.dcm', '.png'), mask_decoded)
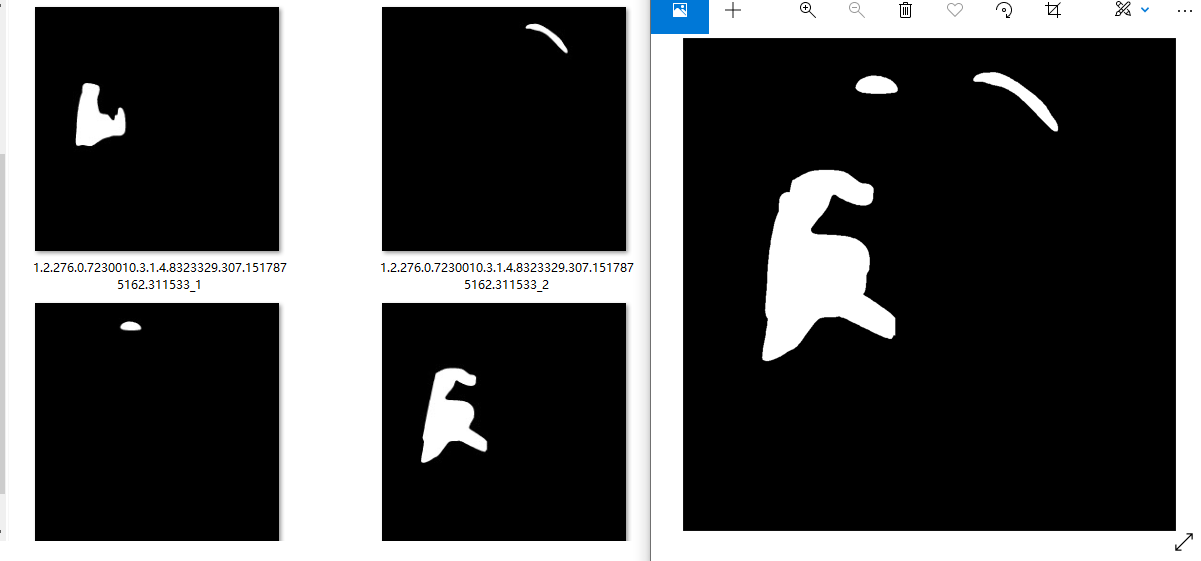
Here, we are lazy and save effort. Each mask is directly stored. If the number of masks is more than 1, it is saved in the form of sequence number suffix. The saving results are shown in the left figure. Next, we are combining the separate masks. The synthesis result is shown in the right figure. As follows:
4.2. 2. Mask merge
The reason here is 4.2 It is clearly introduced in 1. It is suggested that small partners can make modifications on this basis to avoid troublesome data operation.
I have this process and code, so I operate it directly, which is faster. The image merged into the mask folder, that is, the image of pneumothorax mark.
Remember to put multiple mask diagrams originally belonging to a mask into a folder, and then traverse all folders in turn. The merging idea is to merge multiple masks, so that they can be drawn together. Finally, we also map one image to one mask graph.
import os
import numpy as np
import cv2

def cv_imread(file_path):
    cv_img = cv2.imdecode(np.fromfile(file_path, dtype=np.uint8), 1)
    return cv_img

raw_dir = r'Z:\seg_mask\mask_all'

patient_list = os.listdir(raw_dir)
postProcessed_list = []
for patient in patient_list:
    mask_path = os.path.join(raw_dir, patient)
    mask_list = os.listdir(mask_path)

    for i, name_m in enumerate(mask_list):
        # print(name_m)
        Instance_num = name_m.replace('.png', '').split("_")[1]

        mask = cv_imread(mask_path + "/" + name_m)
        mask = cv2.cvtColor(mask, cv2.COLOR_BGR2GRAY)
        w, h = mask.shape

        if patient not in postProcessed_list:
            print('newLoad')
            mask_temp = np.zeros((h, w))
            postProcessed_list.append(patient)
        else:
            print('reLoad')
            mask_temp = cv_imread(r"Z\kagglePublic_data\SIIM-ACR-Pneumothorax-Segmentation/seg_mask/mask/"+name_m.split("_")[0]+".png")

        try:
            _, contours, _ = cv2.findContours(mask, cv2.RETR_TREE, cv2.CHAIN_APPROX_SIMPLE)
        except:
            contours, _ = cv2.findContours(mask, cv2.RETR_TREE, cv2.CHAIN_APPROX_SIMPLE)
        flag = False
        for contour in contours:
            x, y, w, h = cv2.boundingRect(contour)
            area = cv2.contourArea(contour)
            if area > 1:     # Remove nodules < 3mm (one coordinate point)
                flag = True
                cv2.drawContours(mask_temp, [contour], 0, (255, 255, 255), cv2.FILLED)  # Continuous drawing, similar to union set

        if flag:
            cv2.imwrite(r"Z:\kagglePublic_data\SIIM-ACR-Pneumothorax-Segmentation\seg_mask/mask/"+name_m.split("_")[0]+".png", mask_temp)


    print(patient, len(postProcessed_list))
Here, in fact, several key data we mentioned at the beginning have been obtained. include:
- dcm to JPEG
- Tag information mask
PS: I'm already working and may not be able to reply to your questions in time. The processed pneumothorax label and image data download link are attached below. I hope you will give me a reward~~
Download address: Download data after pneumothorax X-ray processing
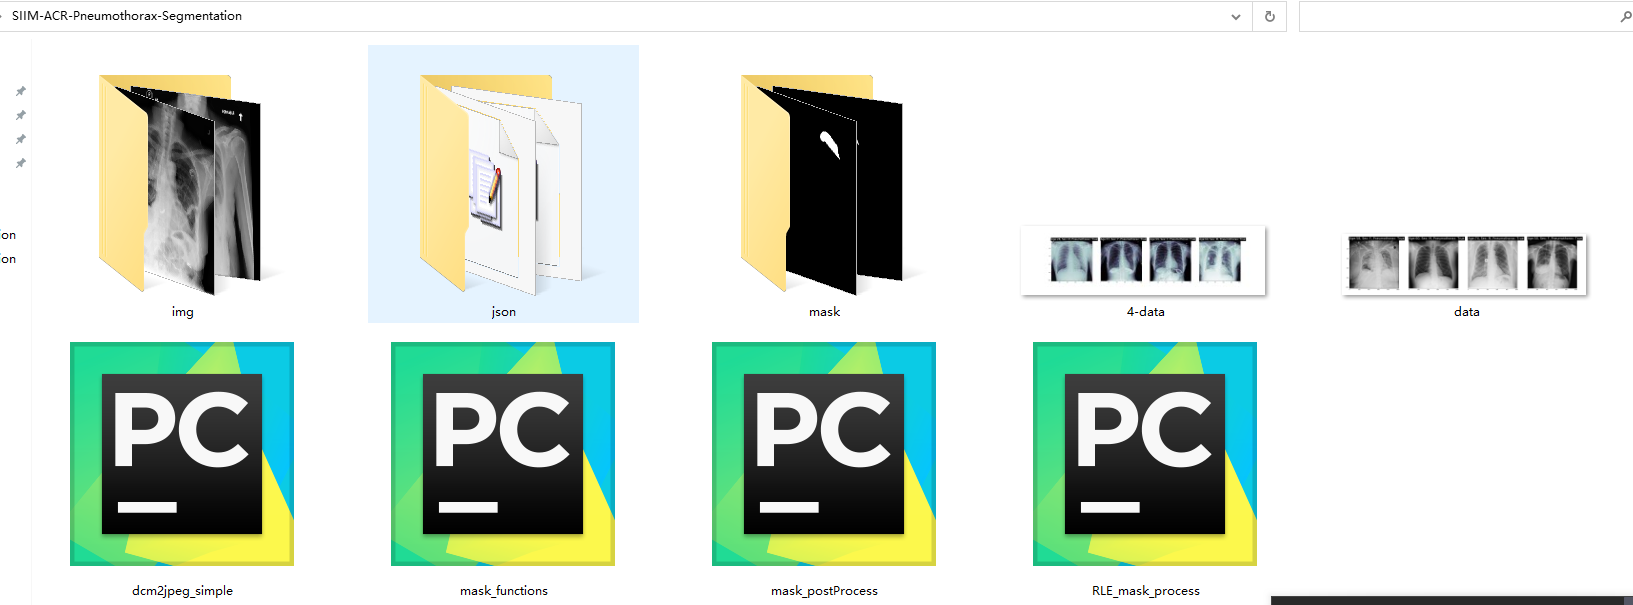
The above resources include four parts:
- img: chest film JPEG image of pneumothorax
- mask: 2669 marked pneumothorax images
- json: the pneumothorax labeling mask is saved to the json tag, which can be opened by the labelme labeling software for review
- Code part: including all the codes in front of this article, pneumothorax label processing and chart turning codes
If you have any questions, please leave a message at the bottom of this blog or send a private letter directly. I will reply as soon as I see it. Thank you.
4.3 mask2json
The front is almost finished. Make some additions later. After saving the mask, generate the json file we need for the mask diagram for later annotation audit (if you don't have the second audit step, you don't need to generate json below). The code is as follows:
################
# Sometimes it is impossible to directly obtain the labeled json file, only the black-and-white mask image
# Here, you need to convert the mask into a json file marked by labelme
##################

import os
import cv2
import json
import base64
from PIL import Image
import io

def base64encode_img(image_path):
    src_image = Image.open(image_path)
    output_buffer = io.BytesIO()
    src_image.save(output_buffer, format='JPEG')
    byte_data = output_buffer.getvalue()
    base64_str = base64.b64encode(byte_data).decode('utf-8')
    return base64_str

def mask2json():
    mask_path = r"Z:\mult_DR\kagglePublic_data\SIIM-ACR-Pneumothorax-Segmentation\seg_mask\mask"
    img_path = r"Z:\mult_DR\kagglePublic_data\SIIM-ACR-Pneumothorax-Segmentation\jpegs_train"
    save_json_path = r"Z:\mult_DR\kagglePublic_data\SIIM-ACR-Pneumothorax-Segmentation\Pneumothorax_json/"
    label = "pneumothorax"

    for (path, dirs, files) in os.walk(mask_path):
        for filename in files:
            A = dict()
            listbigoption=[]

            prefile_path = os.path.join(path, filename)

            pred_seged = cv2.imread(prefile_path, 0)
            raw_h, raw_w = pred_seged.shape
            _, pred_seged = cv2.threshold(pred_seged, 127, 255, cv2.THRESH_BINARY)

            try:
                _, contours, _ = cv2.findContours(pred_seged, cv2.RETR_EXTERNAL, cv2.CHAIN_APPROX_NONE)
            except:
                contours, _ = cv2.findContours(pred_seged, cv2.RETR_EXTERNAL, cv2.CHAIN_APPROX_NONE)

            if len(contours) != 0:
                for contour in contours:
                    # print(len(contours), len(contour))
                    if len(contour) >= 3:
                        listobject = dict()
                        listxy = []

                        if len(contour) > 300:
                            merge = 20
                        elif len(contour) > 200:
                            merge = 15
                        elif len(contour) > 100:
                            merge = 10
                        elif len(contour) > 50:
                            merge = 6
                        elif len(contour) > 20:
                            merge = 3
                        else:
                            merge = 1

                        for i in range(0, len(contour), merge):
                            e=contour[i]
                            listxy.append(e[0].tolist())

                        if len(listxy) <=3:
                            print(prefile_path)
                            print('len(listxy):', len(listxy), listxy)
                            continue
                        listobject['points'] = listxy
                        listobject['line_color'] = 'null'
                        listobject['label'] = label
                        listobject['shape_type'] = 'polygon'
                        listobject['fill_color'] = 'null'
                        listbigoption.append(listobject)

            A['lineColor'] = [0, 255, 0, 128]
            raw_file = filename.replace('.png', '.jpeg')
            A['imageData'] = base64encode_img(os.path.join(img_path, raw_file))
            A['fillColor'] = [255, 0, 0, 128]
            A['imagePath'] = raw_file
            A['shapes'] = listbigoption
            A['imageHeight'] = raw_h
            A['imageWidth'] = raw_w
            A['flags'] = {}
            with open(save_json_path + filename.replace(".png", ".json"), 'w', encoding='utf-8') as f:
                json.dump(A, f, indent=2, ensure_ascii=False)
if __name__=="__main__":
    mask2json()
The saved json data is also saved in the above public download materials. Click the link to download it by yourself. If it's useful to you, pay more attention to it (find a coffee bookstore on Saturday, finish it and publish it manually)

Reference link:
Reference link 1: https://www.cnblogs.com/matpool/p/12357392.html
Refer to link 2: https://blog.csdn.net/iizhuzhu/article/details/104012715