k8s container resource limit
Memory limit example
If the container exceeds its memory limit, it is terminated. If it is restartable, kubelet will restart it like all other types of runtime failures.
If a container exceeds its memory request, its Pod may be evicted when the node is out of memory.
vim memory.yaml
apiVersion: v1
kind: Pod
metadata:
  name: memory-demo
spec:
  containers:
  - name: memory-demo
    image: stress
    args:
    - --vm
    - "1"
    - --vm-bytes
    - 200M
    resources:
      requests:
        memory: 50Mi
      limits:
        memory: 100Mi
Run this yaml
[root@server2 limit]# kubectl apply -f memory.yaml
pod/memory-demo created
It can be found that the maximum memory limit is 100M, then 200M memory is required, and the state is OOMKilled

apiVersion: v1
kind: Pod
metadata:
  name: cpu-demo
spec:
  containers:
  - name: cpu-demo
    image: stress
    resources:
      limits:
        cpu: "10"
      requests:
        cpu: "5"
    args:
    - -c
    - "2"
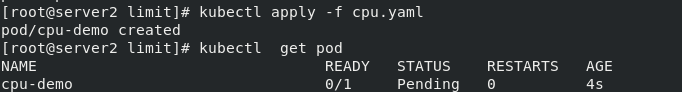
Application yaml
kubectl apply -f cpu.yaml
You can see that the CPU demo is always in Pending state
kubernetes resource monitoring
Metrics server deployment
Metrics server is the aggregator of cluster core monitoring data, which is used to replace the previous heapster.
Container related Metrics mainly come from the built-in C advisor service of kubelet. With Metrics server, users can access these monitoring data through the standard Kubernetes API.
The Metrics API can only query the current measurement data and does not save historical data.
The Metrics API URI is / APIs / metrics k8s. IO /, at k8s IO / metrics maintenance.
Metrics server must be deployed to use this API. Metrics server obtains data by calling Kubelet Summary API.
Metrics Server is not a part of Kube apiserver, but provides unified external services with Kube apiserver under independent deployment through the plug-in mechanism of Aggregator.
Kube aggregator is actually a proxy server that selects a specific API backend according to the URL.
Metrics server belongs to core metrics and provides API metrics k8s. IO, which only provides the CPU and memory usage of Node and Pod
First, download the resource list of metrics server
wget https://github.com/kubernetes-sigs/metrics-server/releases/latest/download/components.yaml
Edit the downloaded yaml file
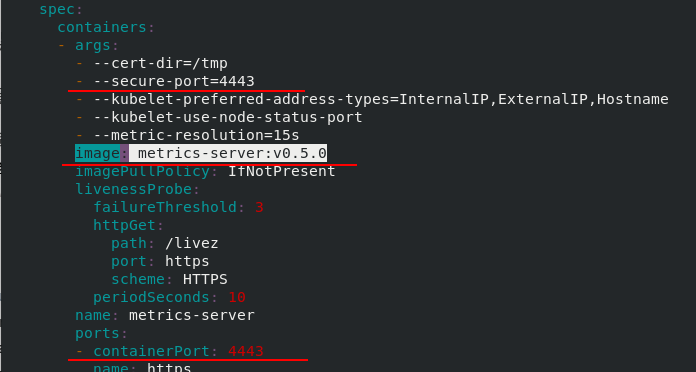
Metrics server deployment
[root@server2 metrics]# kubectl apply -f components.yaml
serviceaccount/metrics-server created
clusterrole.rbac.authorization.k8s.io/system:aggregated-metrics-reader created
clusterrole.rbac.authorization.k8s.io/system:metrics-server created
rolebinding.rbac.authorization.k8s.io/metrics-server-auth-reader created
clusterrolebinding.rbac.authorization.k8s.io/metrics-server:system:auth-delegator created
clusterrolebinding.rbac.authorization.k8s.io/system:metrics-server created
service/metrics-server created
deployment.apps/metrics-server created
apiservice.apiregistration.k8s.io/v1beta1.metrics.k8s.io created
[root@server2 metrics]# kubectl get pod -n kube-system  | grep metrics
metrics-server-86d6b8bbcc-lrdfh           0/1     Running   0          79s
As can be seen from the above, although metrics-server-86d6b8bbcc-lrdfh is running, it is not ready
We can view the Pod log of metrics server after deployment
kubectl -n kube-system logs metrics-server-86d6b8bbcc-lrdfh
Cause: an x509 error occurred

Metric Server supports a parameter -- kubelet secure TLS, which can be skipped. However, the official also made it clear that this method is not recommended for production.
We solve this problem by enabling TLS Bootstrap certificate issuance
In k8s all cluster hosts:
In k8s all cluster hosts:
In k8s all cluster hosts:
vim /var/lib/kubelet/config.yaml
	serverTLSBootstrap: true  #Add on the last line
systemctl  restart kubelet
kubectl get csr #View Certificate signing requests
See that the status of all csr is pending
[root@server2 metrics]# kubectl get csr
NAME        AGE   SIGNERNAME                      REQUESTOR             CONDITION
csr-59zz9   3s    kubernetes.io/kubelet-serving   system:node:server3   Pending
csr-8d2rt   3s    kubernetes.io/kubelet-serving   system:node:server4   Pending
csr-chz2d   7s    kubernetes.io/kubelet-serving   system:node:server2   Pending
kubectl certificate approve #Certificate approval
[root@server2 metrics]# kubectl certificate approve csr-59zz9 csr-8d2rt  csr-chz2d
certificatesigningrequest.certificates.k8s.io/csr-59zz9 approved
certificatesigningrequest.certificates.k8s.io/csr-8d2rt approved
certificatesigningrequest.certificates.k8s.io/csr-chz2d approved
[root@server2 metrics]# kubectl get csr
NAME        AGE    SIGNERNAME                      REQUESTOR             CONDITION
csr-59zz9   118s   kubernetes.io/kubelet-serving   system:node:server3   Approved,Issued
csr-8d2rt   118s   kubernetes.io/kubelet-serving   system:node:server4   Approved,Issued
csr-chz2d   2m2s   kubernetes.io/kubelet-serving   system:node:server2   Approved,Issued
Check metrics' pod again
kubectl get pod -n kube-system
You can see that it is ready
[root@server2 metrics]# kubectl get pod -n kube-system  | grep metrics
metrics-server-86d6b8bbcc-lrdfh           1/1     Running   0          35m
After successful deployment, you can see
kubectl get --raw "/apis/metrics.k8s.io/v1beta1/nodes/server2"
kubectl top node
[root@server2 metrics]# kubectl get --raw "/apis/metrics.k8s.io/v1beta1/nodes/server2"
{"kind":"NodeMetrics","apiVersion":"metrics.k8s.io/v1beta1","metadata":{"name":"server2","creationTimestamp":"2021-08-03T16:42:07Z","labels":{"beta.kubernetes.io/arch":"amd64","beta.kubernetes.io/os":"linux","kubernetes.io/arch":"amd64","kubernetes.io/hostname":"server2","kubernetes.io/os":"linux","node-role.kubernetes.io/control-plane":"","node-role.kubernetes.io/master":"","node.kubernetes.io/exclude-from-external-load-balancers":""}},"timestamp":"2021-08-03T16:41:48Z","window":"10s","usage":{"cpu":"167373877n","memory":"1410456Ki"}}
[root@server2 metrics]# kubectl top node
W0804 00:42:13.983722   24949 top_node.go:119] Using json format to get metrics. Next release will switch to protocol-buffers, switch early by passing --use-protocol-buffers flag
NAME      CPU(cores)   CPU%   MEMORY(bytes)   MEMORY%
server2   172m         8%     1378Mi          72%
server3   66m          6%     570Mi           64%
server4   79m          7%     599Mi           67%
Supplement:
Error 1: Dial TCP: lookup server2 on 10.96 0.10:53: no such host
This is because there is no intranet DNS server, so metrics server cannot resolve the node name. You can directly modify the configmap of coredns and add the host name of each node to the hosts, so that all pods can resolve the name of each node from coredns.
kubectl edit configmap coredns -n kube-system
apiVersion: v1
data:
  Corefile: |
    ...
        ready
        hosts {
           ip nodename
           ip nodename
           ip nodename
           fallthrough
        }
        kubernetes cluster.local in-addr.arpa ip6.arpa {
Error 2: error from server (serviceunavailable): the server is currently unavailable to handle the request (get nodes. Metrics. K8s. IO)
If the metrics server starts normally and there are no errors, it should be a network problem. Modify the Pod network mode of metrics server:
hostNetwork: true
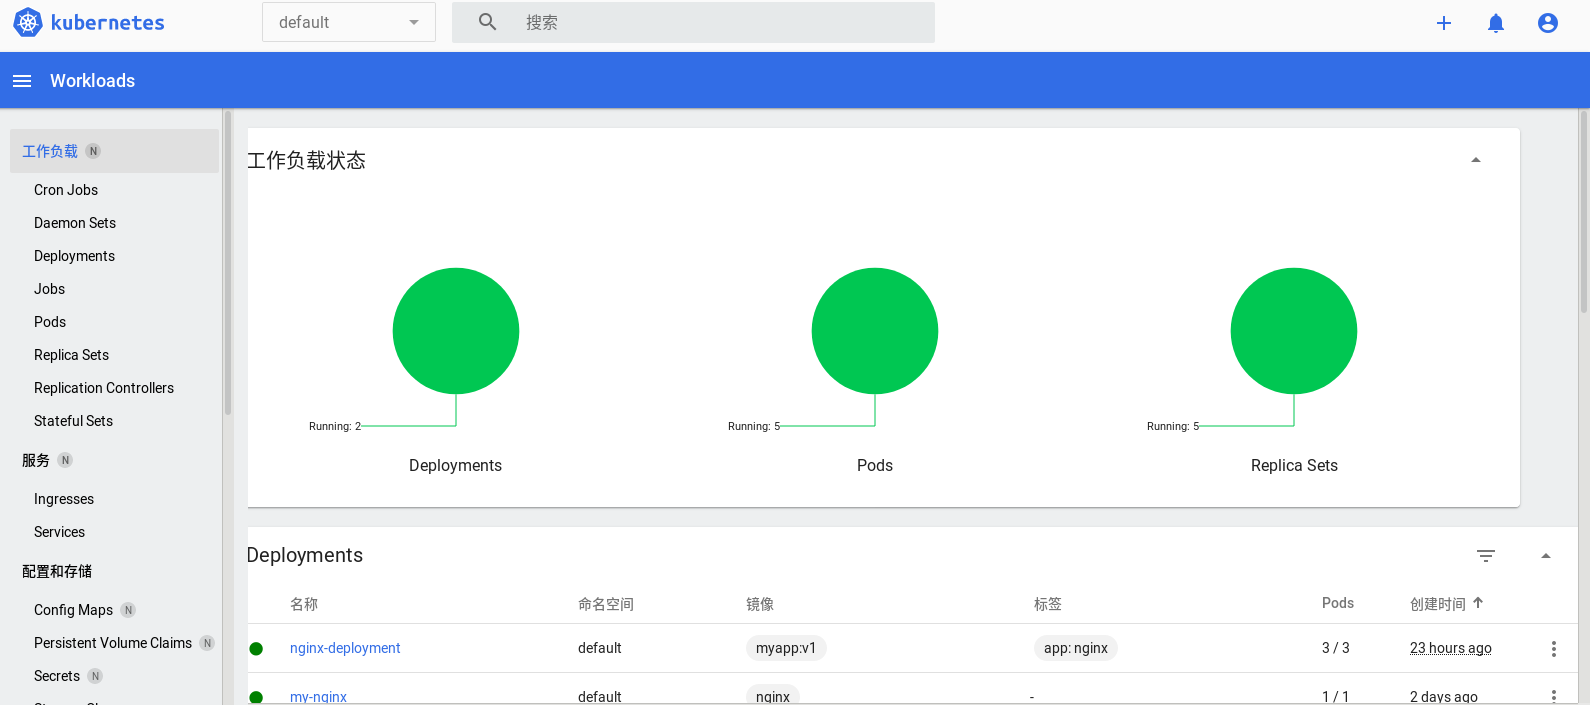
Dashboard deployment
Dashboard can provide users with a visual Web interface to view various information of the current cluster. Users can use Kubernetes Dashboard to deploy containerized applications, monitor the status of applications, perform troubleshooting tasks, and manage various Kubernetes resources.
website: https://github.com/kubernetes/dashboard
Download deployment file: https://raw.githubusercontent.com/kubernetes/dashboard/v2.3.1/aio/deploy/recommended.yaml
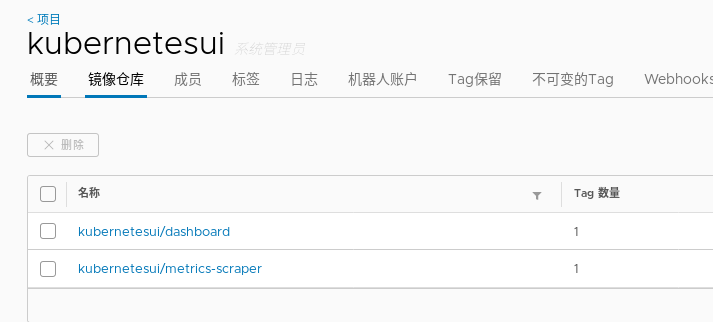
Upload image in harbor warehouse in advance
 Directly use the downloaded deployment file to deploy the Dashboard
[root@server2 dashboard]# kubectl apply -f recommended.yaml
namespace/kubernetes-dashboard created
serviceaccount/kubernetes-dashboard created
service/kubernetes-dashboard created
secret/kubernetes-dashboard-certs created
secret/kubernetes-dashboard-csrf created
secret/kubernetes-dashboard-key-holder created
configmap/kubernetes-dashboard-settings created
role.rbac.authorization.k8s.io/kubernetes-dashboard created
clusterrole.rbac.authorization.k8s.io/kubernetes-dashboard created
rolebinding.rbac.authorization.k8s.io/kubernetes-dashboard created
clusterrolebinding.rbac.authorization.k8s.io/kubernetes-dashboard created
deployment.apps/kubernetes-dashboard created
service/dashboard-metrics-scraper created
deployment.apps/dashboard-metrics-scraper created
[root@server2 dashboard]# kubectl  -n kubernetes-dashboard get svc
NAME                        TYPE        CLUSTER-IP       EXTERNAL-IP   PORT(S)    AGE
dashboard-metrics-scraper   ClusterIP   10.105.154.129   <none>        8000/TCP   6s
kubernetes-dashboard        ClusterIP   10.102.109.205   <none>        443/TCP    7s
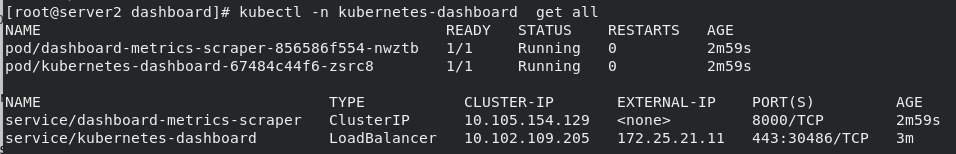
It is found that the type of the created svc is clusterIP, which is modified to LoadBalancer mode for external access
[root@server2 dashboard]# kubectl -n kubernetes-dashboard  edit svc kubernetes-dashboard
service/kubernetes-dashboard edited
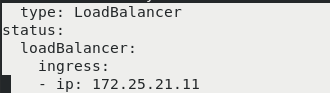
You can see that an external IP 172.25 has been assigned twenty-one point one one
If the status is pending, you can view it https://blog.csdn.net/Puuwuuchao/article/details/119172011#t5 The LoadBalancer section of this article
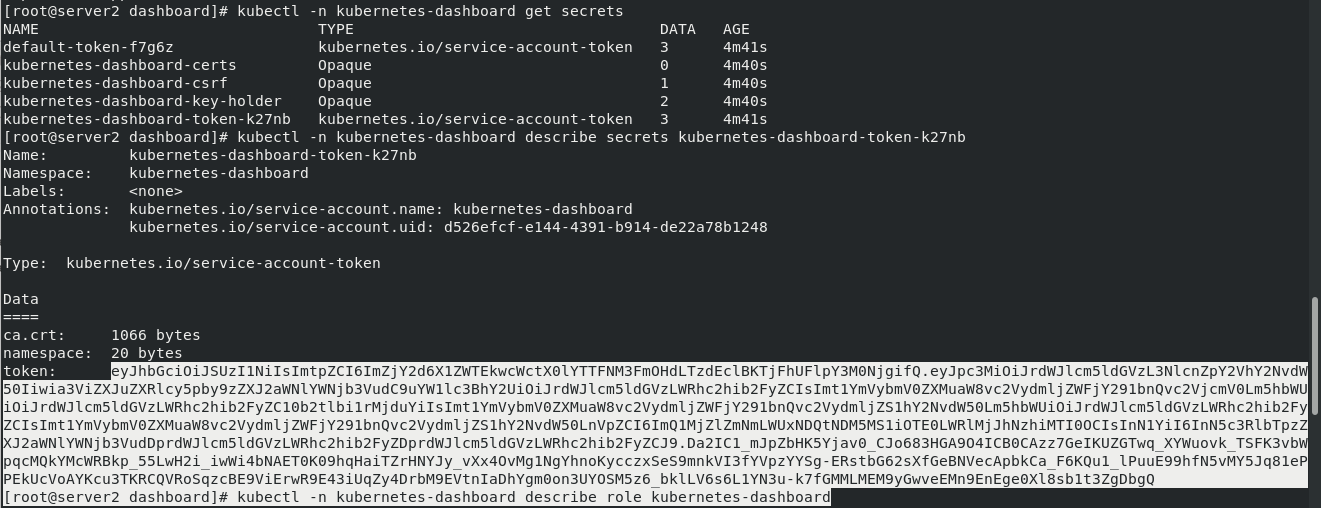
Authentication is required to log in to the dashboard. You need to obtain the token of the dashboard pod:
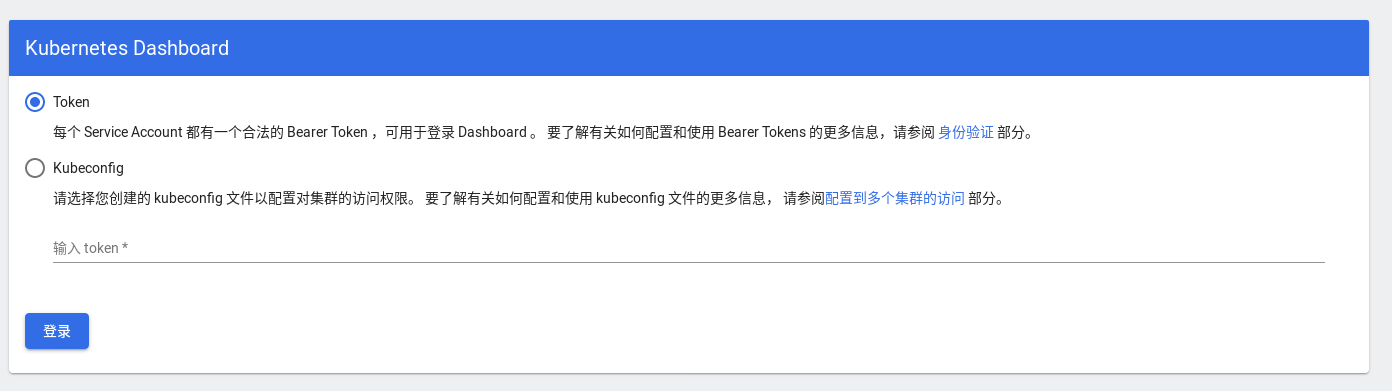
kubectl -n kubernetes-dashboard get secrets
kubectl -n kubernetes-dashboard describe secrets kubernetes-dashboard-token-k27nb
RBAC problems will occur after using token to enter
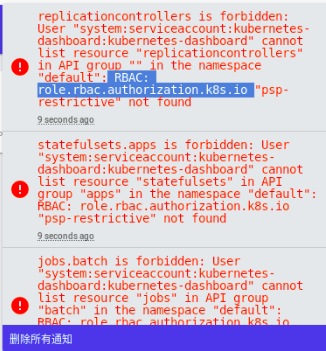
The default dashboard does not have permission to operate on the cluster and requires authorization
vim rbac.yaml
apiVersion: rbac.authorization.k8s.io/v1
kind: ClusterRoleBinding
metadata:
  name: kubernetes-dashboard-admin
roleRef:
  apiGroup: rbac.authorization.k8s.io
  kind: ClusterRole
  name: cluster-admin
subjects:
- kind: ServiceAccount
  name: kubernetes-dashboard
  namespace: kubernetes-dashboard
[root@server2 dashboard]# kubectl apply -f rbac.yaml
clusterrolebinding.rbac.authorization.k8s.io/kubernetes-dashboard-admin created
You can see that the deployment is complete