This article shares how to use python to build the monitoring system panel of server application. The main process is as follows:
1. Create data table in database
2. Establish database connection
Insert real-time data into the data table, query and update panel data in real time, and prepare
3. Production of large screen in monitoring center
Specific steps:
1. Create monitoring indicator data table fields
Here, in order to facilitate the CPU information, memory information and disk information monitored by the system information in one table.
In fact, the CPU and disk information monitoring indicators can be set by table. They have different requirements for time granularity and reduce unnecessary resource consumption. Later, I will write an article to talk about how to build a data index system.
import pymysql
db = pymysql.connect(user="root", passwd="root", db="mydb", host="127.0.0.1")
cur = db.cursor()

# from sqlalchemy import create_engine
# engine = create_engine(
#     "mysql+pymysql://root:root@127.0.0.1:3306/mydb?charset=utf8")
# print(engine)


# Create data table - system information monitoring
sql="""CREATE TABLE IF NOT EXISTS system_info(
     ID int(8) not null auto_increment COMMENT 'Serial number',
     TIME datetime not null COMMENT 'Record time',
     mem_free VARCHAR (100) NOT NULL COMMENT 'Available memory',
     mem_total VARCHAR (100) NOT NULL COMMENT 'Total memory',
     mem_percent VARCHAR (100) NOT NULL COMMENT 'Memory percentage',
     mem_used VARCHAR (100) NOT NULL COMMENT 'Occupied memory',
     cpu VARCHAR (100)  COMMENT 'CPU Proportion',
     disk1 VARCHAR (100)  COMMENT 'C Disk usage ratio',
     disk2 VARCHAR (100)  COMMENT 'D Disk usage ratio',
     disk3 VARCHAR (100)  COMMENT 'E Disk usage ratio',
     disk4 VARCHAR (100)  COMMENT 'F Disk usage ratio',
     disk5 VARCHAR (100)  COMMENT 'G Disk usage ratio',
     primary key(ID)
) ENGINE = INNODB DEFAULT CHARSET = utf8 COMMENT = 'System information monitoring';
"""
cur.execute(sql)
cur.close()
picture
2. Establish database connection
Regularly obtain some memory, CPU and disk information of the host, and store the obtained information in the database; The lightweight timing module schedule is used here.
import psutil
import time
import pymysql
from datetime import datetime
import schedule

db = pymysql.connect(user="root", passwd="root", db="mydb", host="127.0.0.1")
db.autocommit(True)
cur = db.cursor()
def Get_sys_info():
    # cpu Information
    cpu = str(psutil.cpu_percent(interval=1)) + '%'
    # cpu = psutil.cpu_percent(interval=1, percpu=True)

    # Memory information
    mem = psutil.virtual_memory()
    mem_total = round(mem.total / 1024 / 1024 / 1024, 0)
    mem_free = round(mem.free / 1024 / 1024 / 1024)
    mem_percent = str(mem.percent) + '%'
    mem_used = round(mem.used / 1024 / 1024 / 1024)

    # Disk information (percentage of disk space used)
    disk1 = str(psutil.disk_usage('C:/').percent) + '%'
    disk2 = str(psutil.disk_usage('D:/').percent) + '%'
    disk3 = str(psutil.disk_usage('E:/').percent) + '%'
    disk4 = str(psutil.disk_usage('F:/').percent) + '%'
    disk5 = str(psutil.disk_usage('G:/').percent) + '%'

    return mem_free,mem_total,mem_percent,mem_used,cpu,disk1,disk2,disk3,disk4,disk5

if __name__ == "__main__":

    def job():
        mem_free, mem_total, mem_percent, mem_used, cpu, disk1, disk2, disk3, disk4, disk5 = Get_sys_info()
        now_time = datetime.now()
        list1 = [now_time, mem_free, mem_total, mem_percent, mem_used, cpu, disk1, disk2, disk3, disk4, disk5]
        tuple_list = tuple([str(i) for i in list1])
        print(tuple_list)

        sql = """insert into system_info(TIME,mem_free,mem_total,mem_percent,mem_used,cpu,disk1,disk2,disk3,disk4,disk5) value (%s,%s,%s,%s,%s,%s,%s,%s,%s,%s,%s)"""

        cur.execute(sql, tuple_list)

    try:
        schedule.every().minute.at(":00").do(job)

    except Exception as e:
        print('error: %s'% e)

    while True:
        schedule.run_pending()
        time.sleep(1)
After the service starts, insert data records into the database every minute. There is a small problem here. The insertion time point does not start from the setting of: 00. This detail will be optimized later.
picture
3. Large screen of monitoring center
Obtain data from the database, such as server memory and CPU information, visually make charts and layout Kanban through pyechards. A rough large screen layout is generated through the following process, which is composed of 7 parts in order.
import pymysql
from pyecharts.charts import Line
from pyecharts import options as opts
from pyecharts.charts import Bar, Pie, Page
from pyecharts.globals import ThemeType

db = pymysql.connect(user="root", passwd="root", db="mydb", host="127.0.0.1")
cur1 = db.cursor()
cur2 = db.cursor()
cur3 = db.cursor()

SQL1="""SELECT TIME,cpu,mem_percent FROM system_info WHERE TIME > DATE_SUB(NOW(), INTERVAL 60 MINUTE)"""  #Query the data display in the last 1h

SQL2 = 'select disk1,disk2,disk3,disk4,disk5 from system_info order by TIME desc limit 1'

SQL3 = 'select mem_free,mem_total,mem_percent,mem_used from system_info order by TIME desc limit 1'

cur1.execute(SQL1)
cur2.execute(SQL2)
cur3.execute(SQL3)
cpu_data = cur1.fetchall()
disk_data = cur2.fetchall()
mem_data = cur3.fetchall()

all_time = []
all_cpu = []
all_mem_percent = []
for time_cpu in cpu_data:
    TIME=time_cpu[0]
    cpu0=time_cpu[1].split('%')
    cpu_num = eval(cpu0[0])

    mem0=time_cpu[2].split('%')
    mem_percent = eval(mem0[0])

    all_cpu.append(cpu_num)
    all_time.append(TIME)
    all_mem_percent.append(mem_percent)

disk_list = list(disk_data[0])
disk_percent=[eval(x.split("%")[0]) for x in disk_list]

def tab0(name, color):  # title
    c = (Pie().
        set_global_opts(
        title_opts=opts.TitleOpts(title=name, pos_left='center', pos_top='center',
                                  title_textstyle_opts=opts.TextStyleOpts(color=color, font_size=20))))
    return c

def tab1(name, color):  # title
    c = (Pie().
        set_global_opts(
        title_opts=opts.TitleOpts(title=name, pos_left='center', pos_top='center',
                                  title_textstyle_opts=opts.TextStyleOpts(color=color, font_size=30))))
    return c

def tab2(name, color):
    c = (Pie().
        set_global_opts(
        title_opts=opts.TitleOpts(title=name, pos_left='center', pos_top='center',
                                  title_textstyle_opts=opts.TextStyleOpts(color=color, font_size=25))))
    return c

def line(all_time, all_cpu):
    line = (
        Line()
        .add_xaxis(all_time)
        .add_yaxis("CPU_info: %", all_cpu)
        .set_global_opts(title_opts=opts.TitleOpts(title="CPU_info"))
    )
    line.render()

    return line

def line1(all_time, all_mem_percent):
    line = (
        Line()
        .add_xaxis(all_time)
        .add_yaxis("Mem_percent: %",all_mem_percent)
        .set_global_opts(title_opts=opts.TitleOpts(title="Memory usage ratio"))
    )
    line.render()

    return line

def bar(disk_percent):

    bar =(Bar(init_opts=opts.InitOpts(theme=ThemeType.CHALK))  #Enter ah here and set the drawing theme to chat
        .add_xaxis(["C disc","D disc","E disc","F disc","G disc"])
        .add_yaxis("Disk usage ratio:%",disk_percent))
    bar.render()
    return bar


def pie_base():
    c = (
        Pie()
        .add("", [list(z) for z in zip(['mem_free', 'mem_used'],
                                       [mem_data[0][0],mem_data[0][3]])])
        .set_global_opts(title_opts=opts.TitleOpts(title="Memory usage ratio"))
        .set_series_opts(label_opts=opts.LabelOpts(formatter="{b}: {c}"))
    )
    return c
#Splice the above figure onto the web page
page = Page()
page.add(
    tab0("Python Data analysis example", "#2CB34A"),
    line(all_time,all_cpu),
    tab1("System information monitoring data visualization screen", "#2CB34A"),
    tab2("Available memory:{mem_free}\n\n Total memory:{mem_total}\n\n Memory ratio:{mem_percent}\n\n Occupied memory:{mem_used}".format(mem_free=mem_data[0][0],mem_total=mem_data[0][1],mem_percent=mem_data[0][2],mem_used=mem_data[0][3]), "#000000"),
    bar(disk_percent),
    pie_base(),
    line1(all_time,all_mem_percent)
)
page.render("data_center.html")
db.close()
Color code - view RGB color query cross reference table | RGB color | three primary color color table (sojson.com)
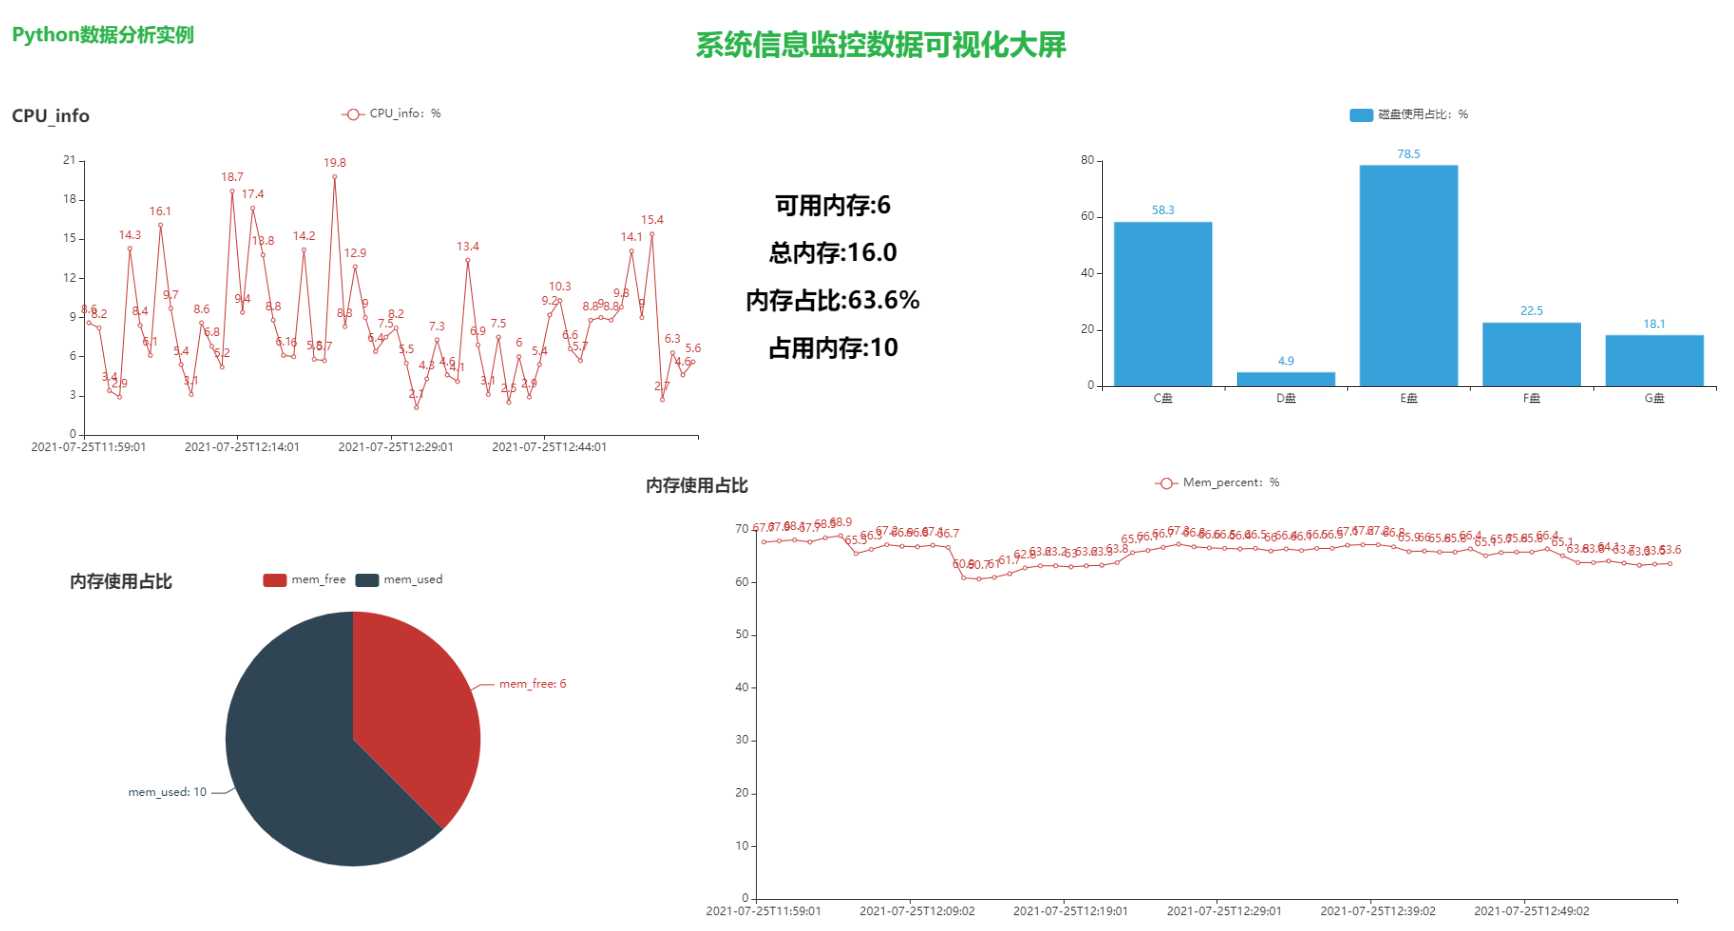
Data visualization panel Preview
Finally, further the layout of the large screen and set a good-looking base map.
Among them, lxml is a parsing library of python, which supports the parsing of HTML and XML.
from bs4 import BeautifulSoup
with open("data_center.html", "r+", encoding='utf-8') as html:
    html_1 = BeautifulSoup(html, 'lxml')
    divs = html_1.select('.chart-container')
    divs[0]["style"] = "width:10%;height:10%;position:absolute;top:0;left:2%;"
    divs[1]["style"] = "width:40%;height:40%;position:absolute;top:12%;left:2%;"
    divs[2]["style"] = "width:35%;height:10%;position:absolute;top:1%;left:30%;"
    divs[3]["style"] = "width:40%;height:40%;position:absolute;top:10%;left:25%;"
    divs[4]["style"] = "width:40%;height:35%;position:absolute;top:12%;left:55%;"
    divs[5]["style"] = "width:30%;height:35%;position:absolute;top:60%;left:5%;"
    divs[6]["style"] = "width:60%;height:50%;position:absolute;top:50%;left:35%;"

    body = html_1.find("body")
    body["style"] = """background-image:url("./img/test.jpg")"""  # Background picture

    html_new = str(html_1)
    html.seek(0, 0)
    html.truncate()
    html.write(html_new)
    html.close()
#Remarks: divs[0] ["style"] = "width:10%;height:10%;position:absolute;top:0;left:2%;" That is, our definition of width, height, position, top margin and left margin. Here we use percentage to achieve the effect of screen adaptation.
The renderings are as follows:
[the external chain picture transfer fails. The source station may have an anti-theft chain mechanism. It is recommended to save the picture and upload it directly (img-ho33febk-1627781016126)( https://i.loli.net/2021/07/31/6mkJGwYqQ3EpDZK.jpg )]
So far, a real-time system information monitoring panel has been developed. Other functions can be expanded by themselves. This paper only demonstrates the specific process of creation, and other details can be further optimized, such as monitoring and control specific to a single application.
The article contains all the code. Let's try it.