I wrote an article about how to use markLine as the base map in the diagram, and it can move with the movement of the diagram
Previous link
Recently, new requirements have come, as follows
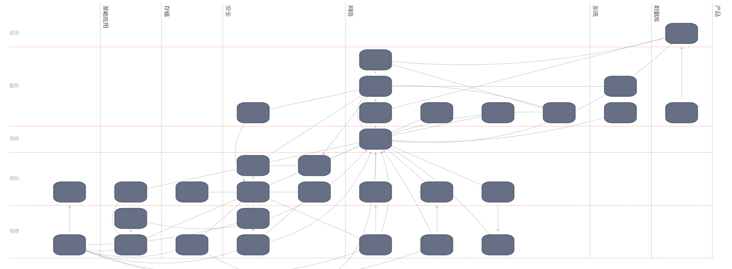
1. Click a node to leave only the related nodes. Click again to restore the original
2. Move the mouse to highlight the relevant line on the node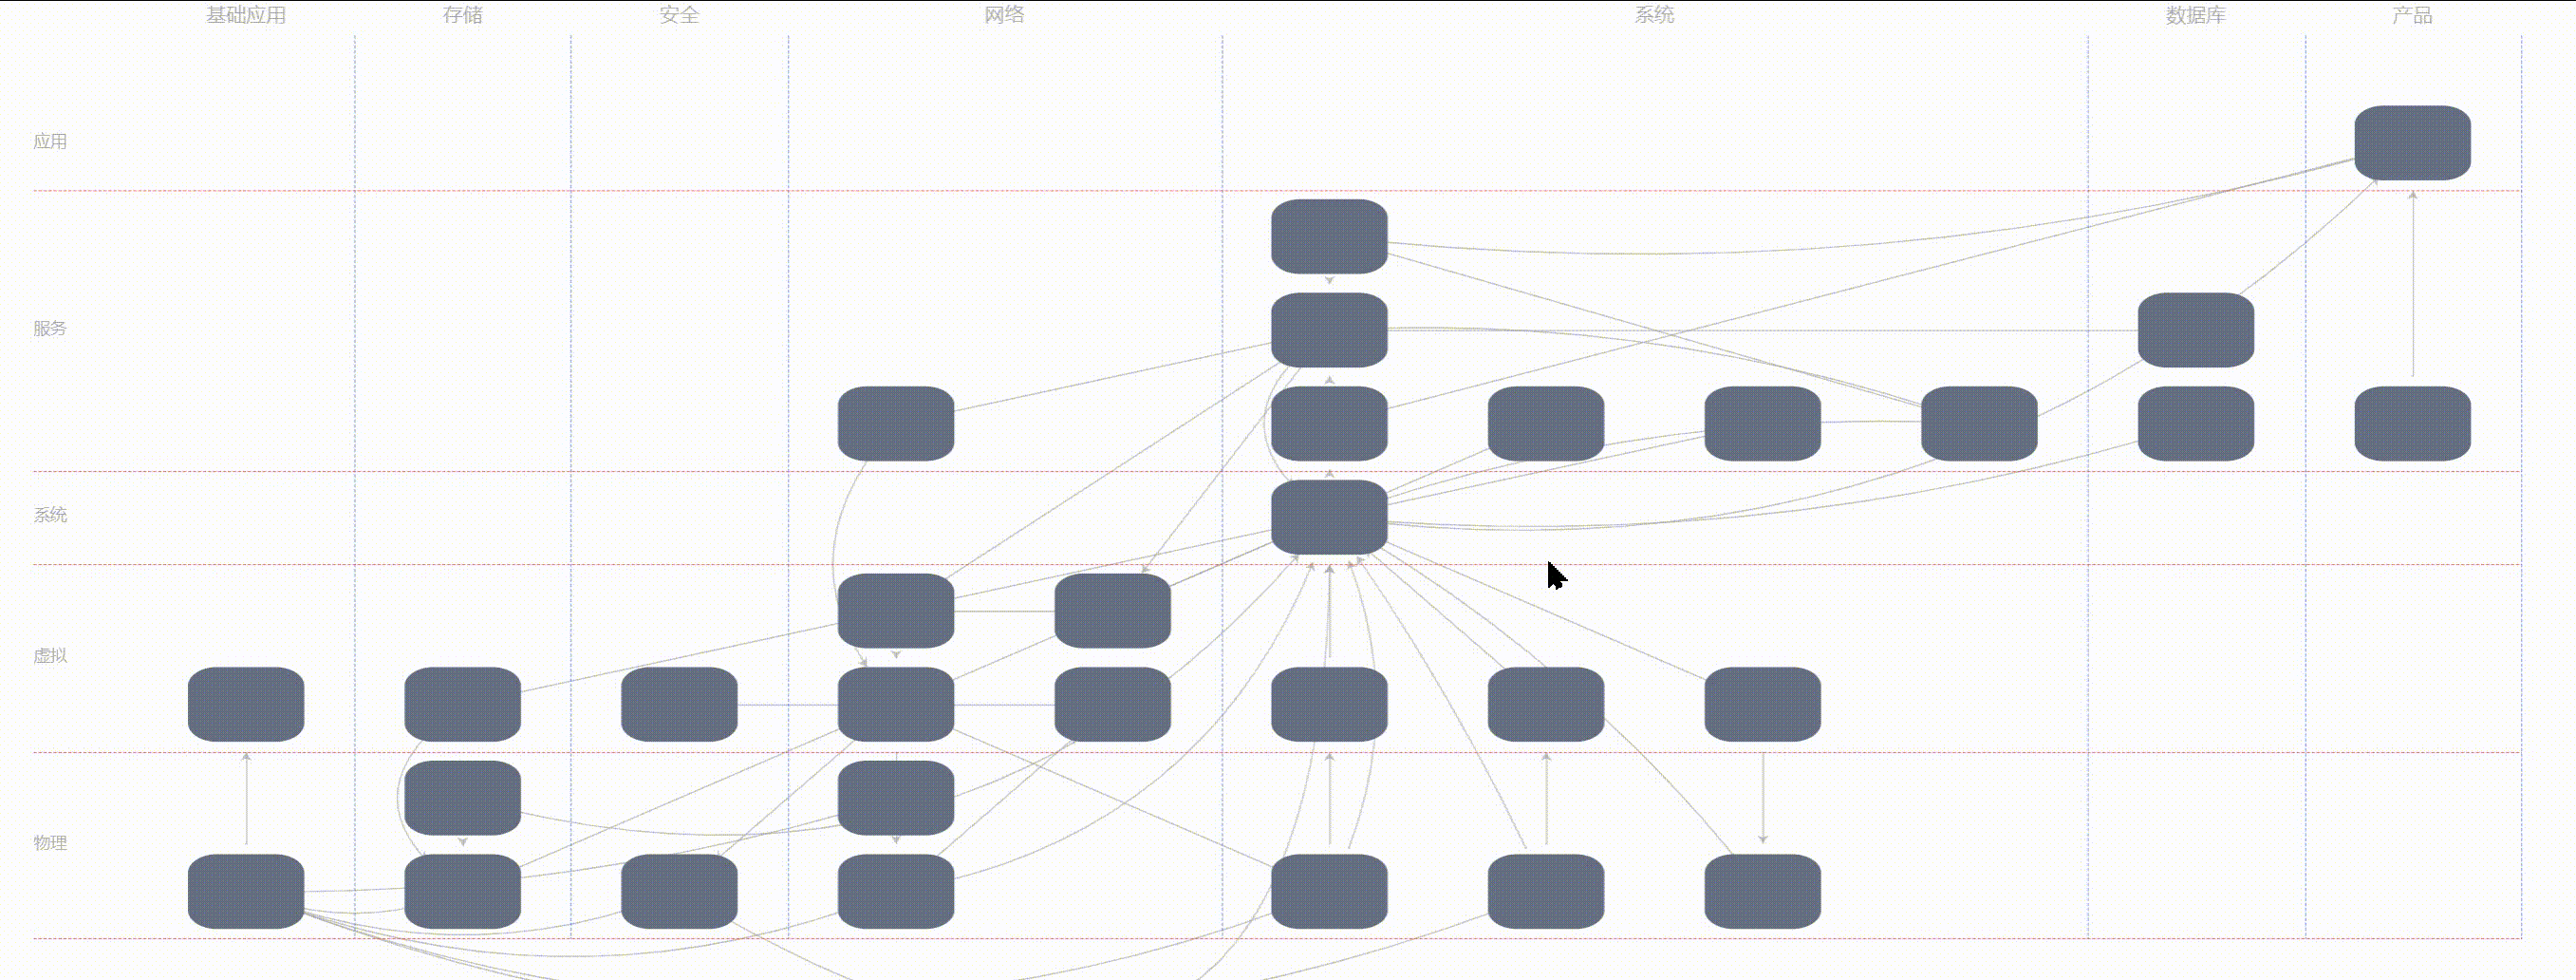
3. Center the logo text of the base map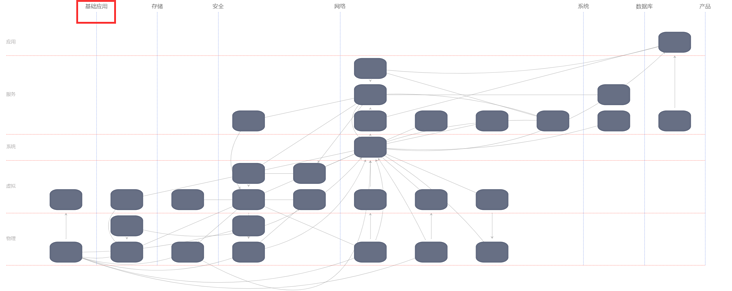
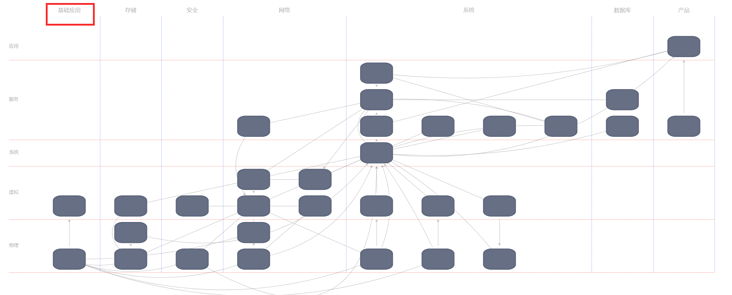
4. Add a drop-down box to filter the nodes to be displayed.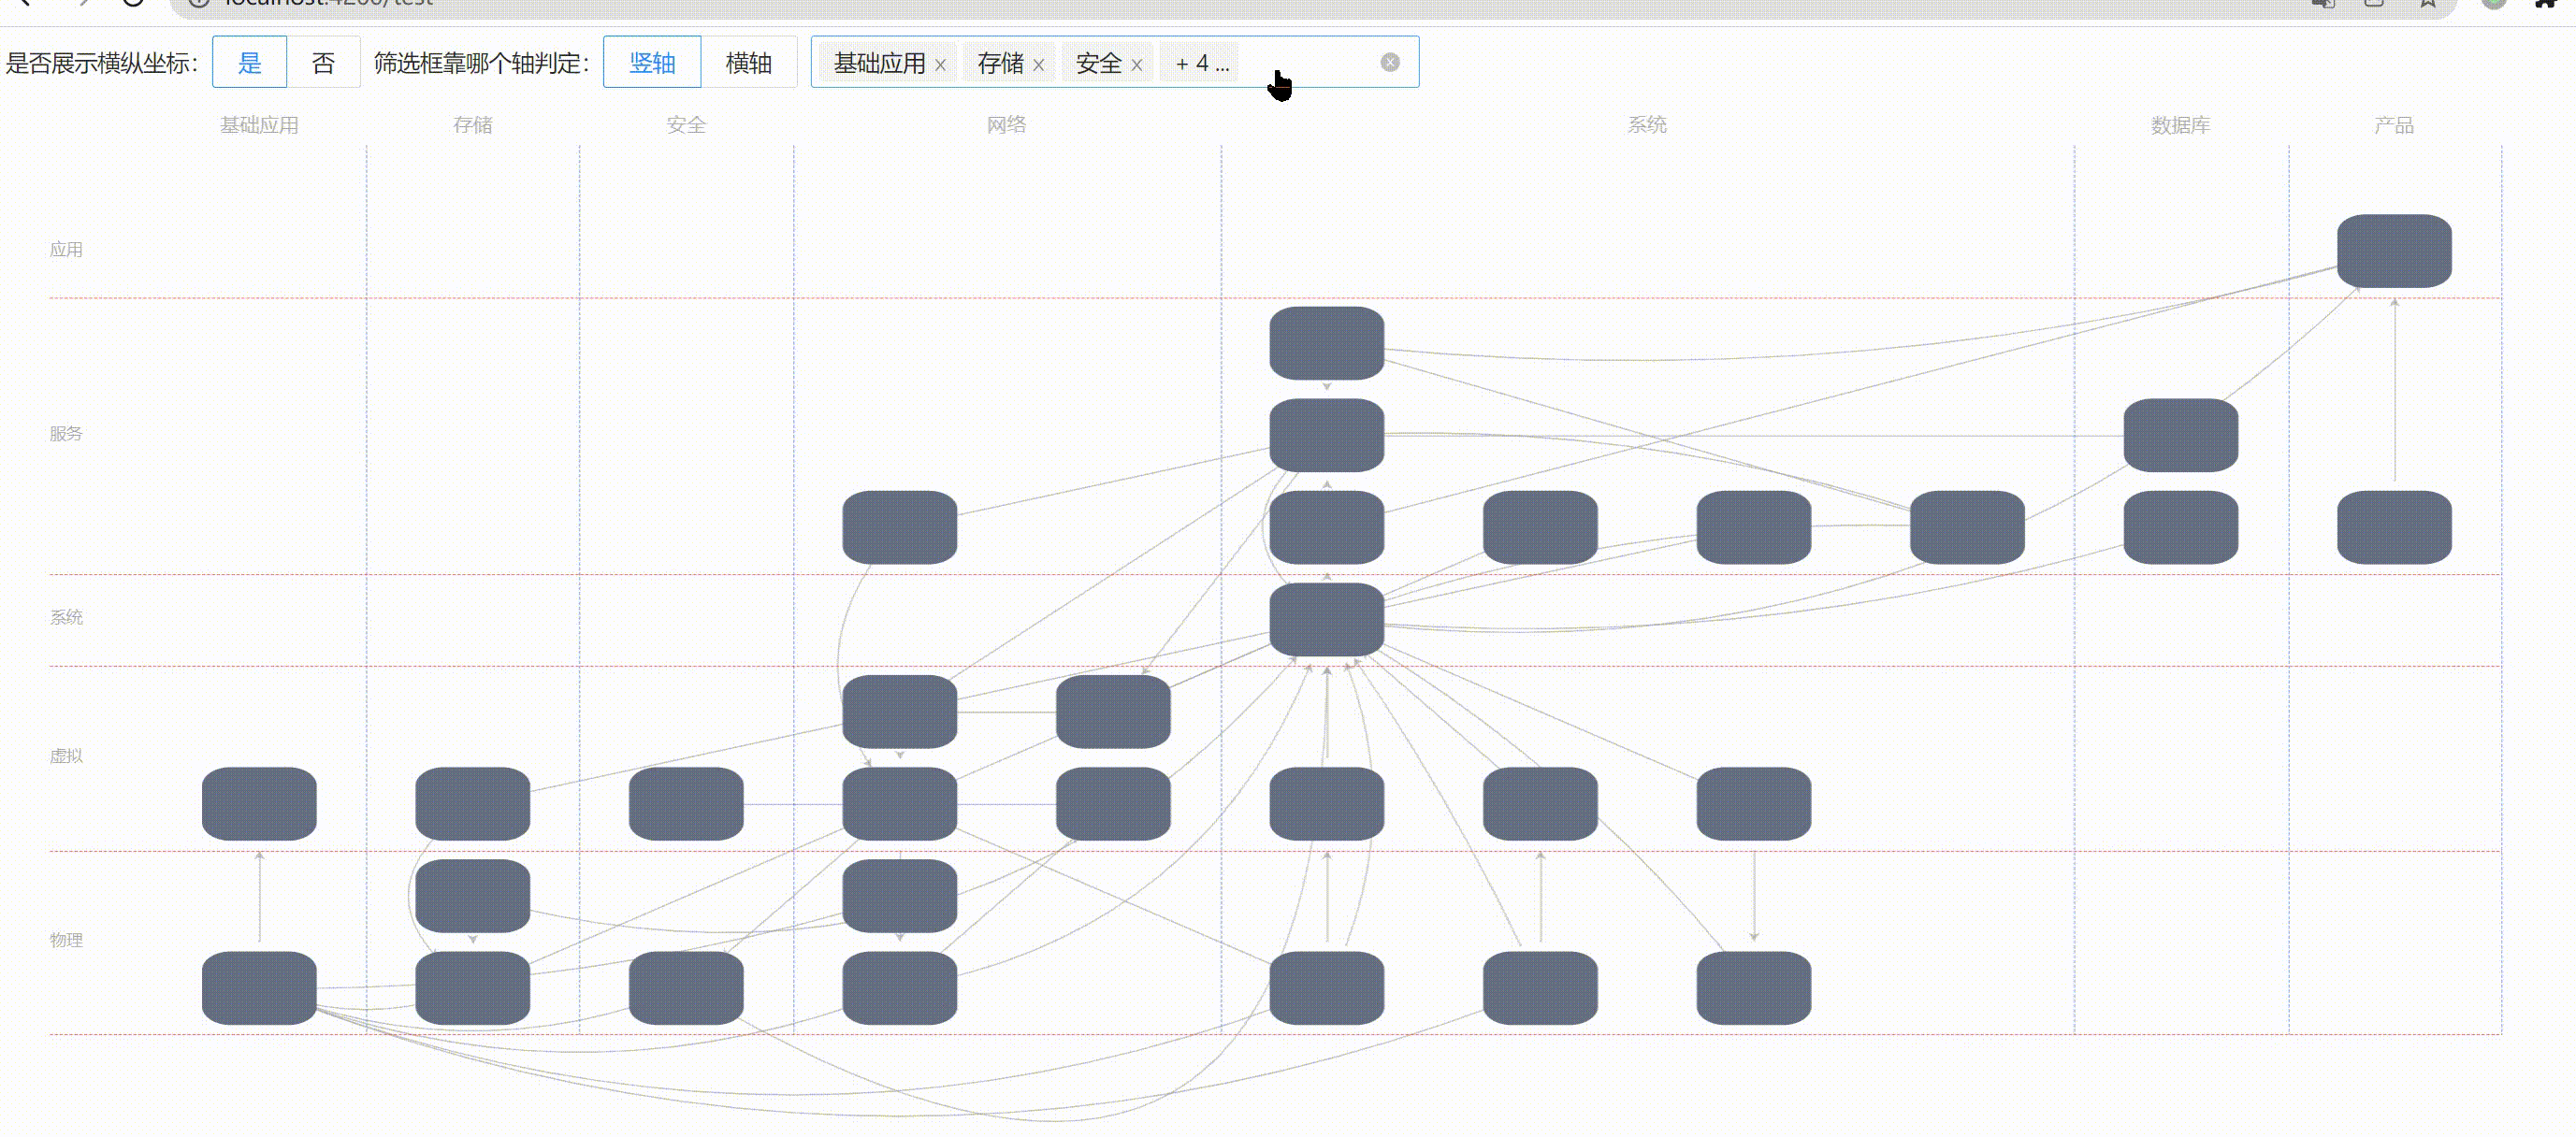
In fact, to sum up, the first requirement, the second requirement and the last requirement are common, that is, they are all operations on the data displayed by ehcarts. The difference is that the first and second requirements only need to consider the data, The last requirement needs to consider the movement of the basemap, that is, the movement of the markLine and the overall movement of the node data in an area. That is, every time you click the tree drop-down box, you have to recalculate the position of each node and the markLine basemap.
This article does not teach you how to make the effect in the picture, but only explains the problems encountered in this project and specific solutions.
First, solve the first requirement, that is, click a node to display only the data related to this node
Solution: first of all, you must get the click event, and then when you click the node, you get the data related to the node, filter the relevant data according to a related filter condition, assign a value to echarts, and the data will be displayed.
The second point is to restore the data before clicking when clicking again.
Solution: data isolation, save a copy of the display data locally, and then copy the local copy data using lodash's cloneDeep method when clicking. When clicking, count the clicked items + 1, and count the corresponding items in the copy of local data + 1. When the count of a node is 2, all counts are cleared.
That is, when clicking, count the clicked nodes + 1, and filter out relevant other nodes according to a certain condition of this node.
When clicking again, if the count of any node is 2, the local unfiltered data will be assigned back, and all counts will be cleared.
Code explanation on
//html code
<div id="room-bar-chart" echarts [options]="echartOptions"
        (chartMouseOver)="mouseOver($event,'over')" (chartMouseOut)="mouseOver($event,'out')"
        (chartInit)="InitChart($event)" (chartClick)="chartClick($event)"
        (chartContextMenu)="chartDbClick($event,menu)" style="height: 650px;"></div>
//What you want to see is actually the chartlick event

//ts
chartClick($event: any){
        if($event.dataType==="edge") return //Do not operate when the point reaches the line

        let series = _.cloneDeep(this.echartOptions.series[0]);//Back up the series of the current ecarts graph
        let name = $event.name//Get the name of the click node

        let relative: any[] = []//Save and filter out the data related to the clicked item, whether source or target
        edgeList.forEach((item,index,array)=>{//edgeList is the data of node relationship
            if(item.source===name||item.target===name){//If the target node or the starting node is the name of the clicked node
                relative.push(item)//Add it to the relational array and save it
            }
        })

        let seriesData:Array<any> = series.data//Get the data of the existing ecarts diagram
        let dataArray = []//Save the data related to relative in the displayed data
        for (let w = 0; w < seriesData.length; w++) {//Data of loop Ontology
            let item = seriesData[w];
            let index = w;
            if (item.name == name) {//Find the data clicked on the ontology
                item.count++
                this.echartOptions.series[0].data[index].count++//Data change to original data

            } else {//If not, clear the count of other nodes on the ontology to 0
                this.echartOptions.series[0].data[index].count = 0//Data change to original data
            }

            if (this.echartOptions.series[0].data[index].count >= 2) {//If the same data is clicked twice
                this.echartOptions.series[0].data.forEach((element: { count: number; }) => {//Clear the count of all data
                    element.count = 0
                });
                this.setEchartsOption({ series: series })//Redraw all data. The redraw method is described in the previous article.
                return
            }
            for (let x = 0; x < relative.length; x++) {
                let data = relative[x];
                if (item.name == data.source || item.name == data.target) {
                    dataArray.push(item)
                }
            }
        }
        series.data = _.uniq(dataArray)//duplicate removal
        this.setEchartsOption({series:series})
    }
In this way, when a node is clicked, the first click can retain the relevant node, and the second click can restore the original.
The second requirement is to highlight the related lines when the mouse moves up
Solution: roughly the same as the first requirement, capture the event when the mouse moves over a node, filter out the data of the line related to the node, and then change the color of the line. When the mouse moves out, change the color back to the original appearance.
Code explanation on
//html code
<div id="room-bar-chart" echarts [options]="echartOptions"
        (chartMouseOver)="mouseOver($event,'over')" (chartMouseOut)="mouseOver($event,'out')"
        (chartInit)="InitChart($event)" (chartClick)="chartClick($event)"
        (chartContextMenu)="chartDbClick($event,menu)" style="height: 650px;"></div>
//Follow mouseOver events

//ts
  /** Move the mouse over the node to highlight the line associated with it */
    mouseOver($event: any, type: string) {
        if ($event.dataType === "node") {//Node represents a node. If it is a line, it will not be operated
            //Whether data changes need to be synchronized to the original data needs to be considered. Here, a deep copy is used to copy a copy, which has the same effect as using the original data directly.
            let series = this.echartsInstance.getOption().series[0]
            let name = $event.name
            if (type === "over") {//Since I use the same method to move in and out, I need to use parameters to judge whether to move in or out
                // console.log("series",series)
                series.links.forEach((item: { source: any; target: any; lineStyle: { curveness: any; color?: string; width?: number; opacity?: number; }; }) => {
                    if (item.source === name || item.target === name) {//If relevant
                        item.lineStyle = {
                            color: "#39adfa",
                            width: 1.5,
                            opacity: 1,
                            curveness: item.lineStyle ? item.lineStyle.curveness : 0
                        }
                    }
                })
                // console.log('mouse in series'
            } else {
                //If you simply assign data, for example, do not use the following series Links loop. The outer linkStyle style cannot be applied
                //Links to the inner layer Linestyle, so you need to link the inner layer Just add the styles on linesyle
                // series = this.echartsInstance.getOption().series[0]
                series.links.forEach((item: { source: any; target: any; lineStyle: { curveness: any; color?: string; opacity?: number; width?: number; }; }) => {
                    if (item.source === name || item.target === name) {
                        item.lineStyle = {
                            color: "#aaa",
                            curveness: item.lineStyle ? item.lineStyle.curveness : 0,
                            opacity: 0.7,
                            width: 0.8,
                        }
                    }
                })
            }
            this.setEchartsOption({ series: series })
        } else if ($event.dataType === "edge") {

        }
    }
The third requirement is to center the text of markLine
Solution: at the beginning, I tried my best to move the label of markLine in the official document. As a result, the label attribute of markLine in the official document is very troublesome. When position is start or end, the x-axis direction cannot be moved. For line attributes such as insideStartTop, the font will rotate 90 °, and the rotate attribute is not supported to change the font rotation angle, Very headache, as shown below