

Recently, our project was upgraded to spring boot 2.4 6 + Spring Cloud 2020.0. x. As can be seen from my other series: Spring Cloud upgrade path . However, after the upgrade, we found that the YoungGC increased significantly and the rate of allocating objects increased significantly, but the promoted objects did not increase. It was proved that they were newly created objects and could be recycled soon. Let's look at the monitoring of one process. At this time, the http request rate is about 100:
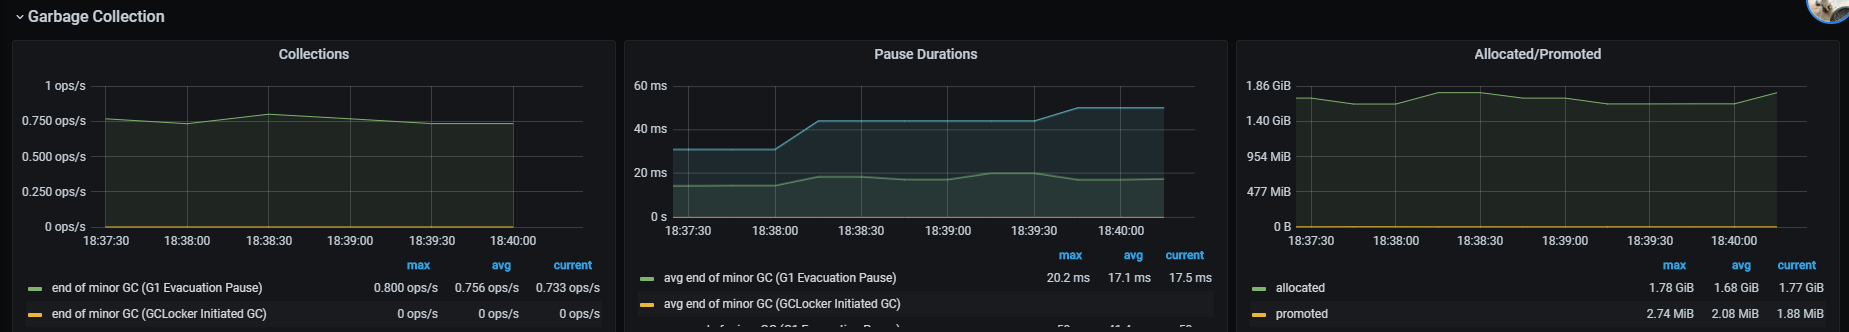
This is very strange. The request rate is not so large, but through monitoring, it can be seen that nearly two gigabytes of memory are allocated per second. Before upgrading, the allocation rate is about 100-200 MB, at the same request rate. So where is the extra memory consumed?

We need to look at the statistics of various objects in memory, that is, using the jmap command. At the same time, you can't just view the statistics of surviving objects, because it can be seen from the monitoring that there are not too many objects in the old age, because the number of promoted objects has not increased. On the contrary, it would be better if we could exclude the surviving objects. At the same time, because GC is quite frequent, there will be one in about 1s. So we can't expect to catch the jmap we want at one time. At the same time, jmap will cause all threads to enter safepoint and STW, which has a certain impact on the line, so jmap cannot be too frequent. Therefore, we adopt the following strategies:
- Expand an instance, and then cut the flow of an instance by half through the registry and current limiter;
- For this instance, jmap -histo (counting all objects) and jmap -histo:live (counting only living objects) are executed continuously;
- Repeat the second step for 5 times, with an interval of 100ms, 300ms, 500ms and 700ms;
- Remove the current limit of the current limiting instance and close the newly expanded instance.
Through these jmap comparisons, we find that the top object types in jmap statistics have a spring framework:
 num     #instances         #bytes  class name (module)
-------------------------------------------------------
   1:       7993252      601860528  [B (java.base@11.0.8)
   2:        360025      296261160  [C (java.base@11.0.8)
   3:      10338806      246557984  [Ljava.lang.Object; (java.base@11.0.8)
   4:       6314471      151547304  java.lang.String (java.base@11.0.8)
   5:         48170      135607088  [J (java.base@11.0.8)
   6:        314420      126487344  [I (java.base@11.0.8)
   7:       4591109      110100264  [Ljava.lang.Class; (java.base@11.0.8)
   8:        245542       55001408  org.springframework.core.ResolvableType
   9:        205234       29042280  [Ljava.util.HashMap$Node; (java.base@11.0.8)
  10:        386252       24720128  [org.springframework.core.ResolvableType;
  11:        699929       22397728  java.sql.Timestamp (java.sql@11.0.8)
  12:         89150       21281256  [Ljava.beans.PropertyDescriptor; (java.desktop@11.0.8)
  13:        519029       16608928  java.util.HashMap$Node (java.base@11.0.8)
  14:        598728       14369472  java.util.ArrayList (java.base@11.0.8)
How is this object created? How to locate a frequently created object that no longer exists, and the object type is internal to the framework?
First of all, MAT (Eclipse Memory Analyzer) + jmap dump is not suitable for the whole heap analysis because:
- Objects no longer exist. MAT is more suitable for the analysis of memory leakage. Here, we create many unexpected objects, which occupy a lot of memory. These objects will no longer exist soon.
- MAT cannot accurately analyze the creator of objects that no longer exist, mainly because it is uncertain whether we can catch the information we want during dump, or there is a lot of information noise.
Although this problem cannot be located in this way, I still put the jmap dump results I collected here and show you the results of MAT analysis:
So how to analyze it next? This uses our old friend, JFR + JMC. Regular readers know that I often use JFR to locate online problems. How can I use it here? There is no direct JFR event statistics on which objects are often created, but there are indirect events that can indirectly reflect who created so many objects. I usually position it this way:
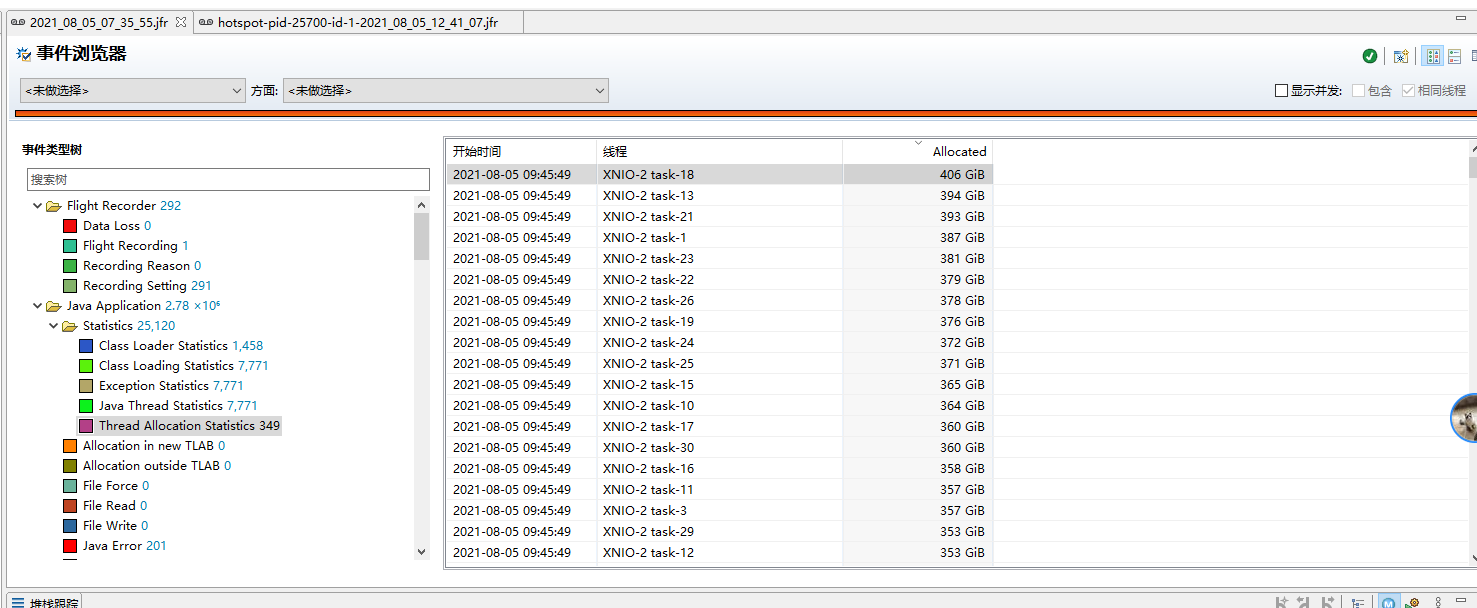
- Check which thread has too many allocation objects (Thread Allocation Statistics) through thread allocation object statistics events.
- Analyze which hotspot codes may generate these objects (method profiling samples) through hotspot codes. For such a large number of created objects, capturing Runnable codes is very likely to be captured and accounts for a high proportion in events.
First, check the Thread Allocation Statistics event. It is found that basically all servlet threads (that is, the threads processing Http requests, which we use Undertow, so the thread name starts with XNIO) have a lot of allocated objects, which can not locate the problem:
Then let's look at the hot code statistics. Click the Method Profiling Sample event to view the stack tracking statistics to see which accounts for a high proportion.
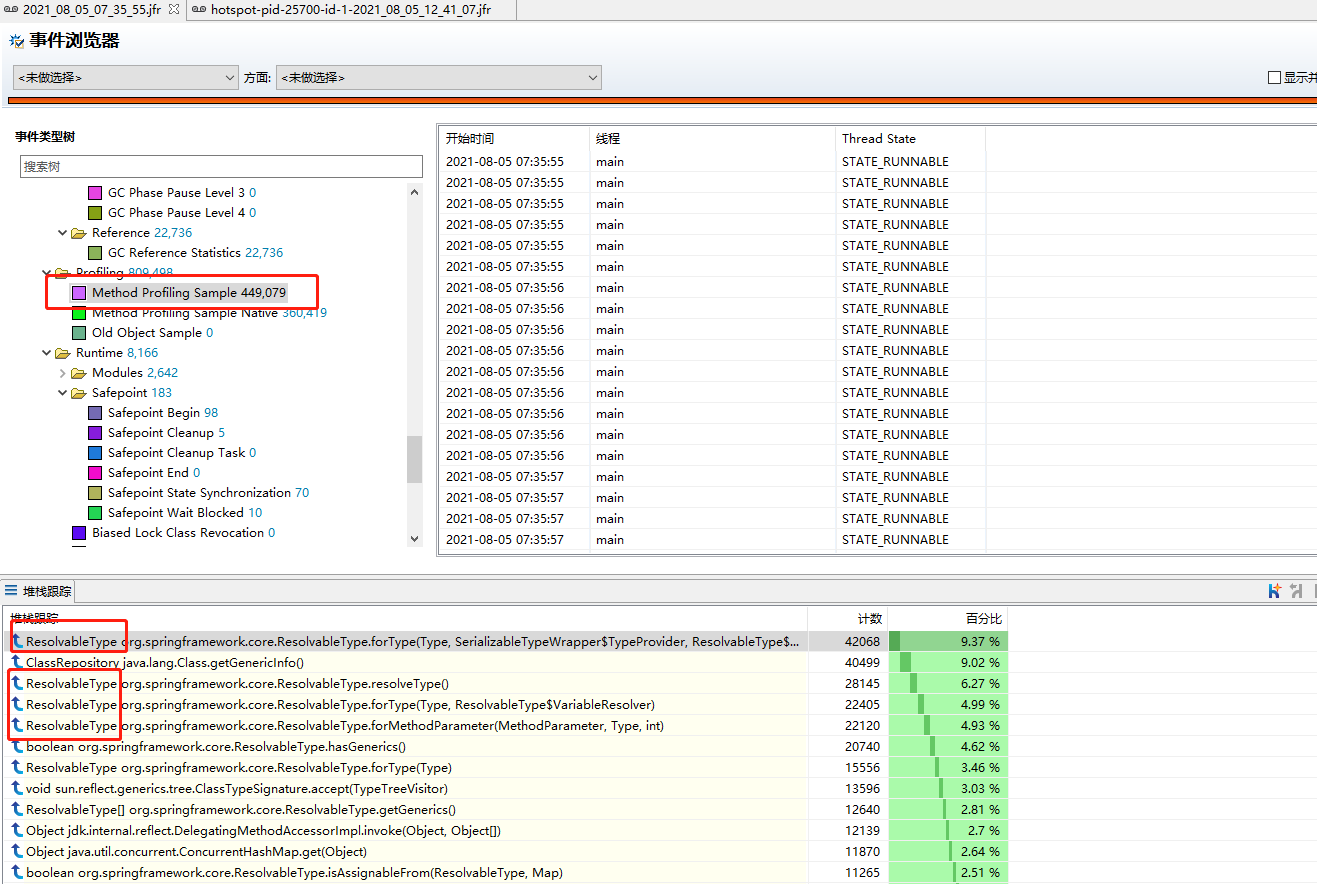
It is found that the highest proportion seems to be related to this resolvable type. Further locate it and double-click the first method to view the call stack statistics:
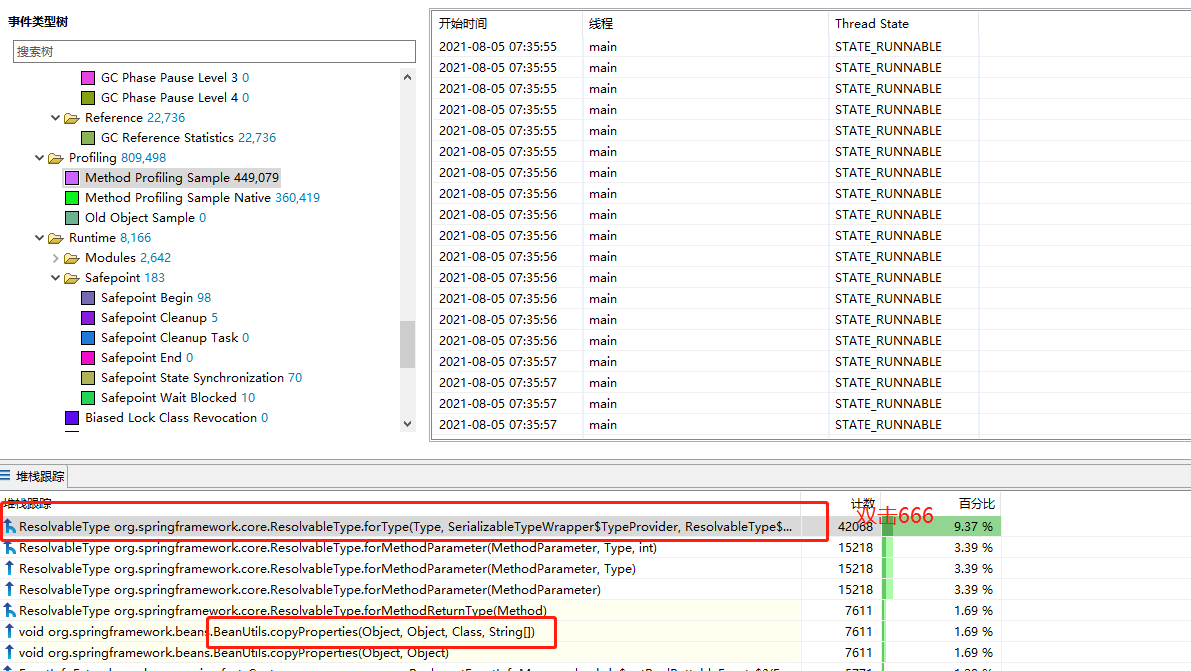
We found that it was called by BeanUtils copyProperties. Check other resolvable type related calls, which are related to BeanUtils About copyproperties. This method is often used in our project to copy attributes of the same type or between different types. Why does this method create so many resolvable types?

By looking at the source code, we found that from spring 5.3 Starting with X, BeanUtils starts to copy properties by creating a unified class information encapsulation of resolvable type:
/**
 *
 * <p>As of Spring Framework 5.3, this method honors generic type information
 */
private static void copyProperties(Object source, Object target, @Nullable Class<?> editable,
		@Nullable String... ignoreProperties) throws BeansException {
}
The source code inside creates a new resolvable type for each attribute method of the type of the source object and the target object every time, and there is no cache. This leads to a replication, which will create a large number of resolvable types Let's do an experiment:
public class Test {
    public static void main(String[] args)  {
        TestBean testBean1 = new TestBean("1", "2", "3", "4", "5", "6", "7", "8", "1", "2", "3", "4", "5", "6", "7", "8");
        TestBean testBean2 = new TestBean();
        for (int i = 0; i > -1; i++) {
            BeanUtils.copyProperties(testBean1, testBean2);
            System.out.println(i);
        }
    }
}
Spring beans 5.2.2 are used respectively 16. Release and spring beans 5.3 9 these two dependencies execute this code. The JVM parameter uses - XX:+UnlockExperimentalVMOptions -XX:+UseEpsilonGC -Xmx512m These parameters mean that epsilon GC is used, that is, when the heap memory is full, GC is not executed, and the OutofMemory exception is thrown directly and the program ends. The maximum heap memory is 512m. In this way, the program actually looks at different versions of BeanUtils before memory runs out How many times can copyproperties be executed.
The test results are: Spring beans 5.2 16. Release is 444489 times, spring beans 5.3 9 is 27456 times. This is a considerable gap.
So, to solve this problem, I asked the spring framework GitHub a question Issue.
Then, for projects that often use BeanUtils Replace the copyproperties with BeanCopier and encapsulate a simple class:
public class BeanUtils {
    private static final Cache<String, BeanCopier> CACHE = Caffeine.newBuilder().build();

    public static void copyProperties(Object source, Object target) {
        Class<?> sourceClass = source.getClass();
        Class<?> targetClass = target.getClass();
        BeanCopier beanCopier = CACHE.get(sourceClass.getName() + " to " + targetClass.getName(), k -> {
            return BeanCopier.create(sourceClass, targetClass, false);
        });
        beanCopier.copy(source, target, null);
    }
}
However, it should be noted that BeanCopier replaces BeanUtils The most direct problem with copyproperties is that those with different properties but different names cannot be copied. For example, one is int and the other is Integer. At the same time, there are some differences between deep copy and unit testing.
After modification, the problem is solved.