author
Huang Lei, a senior engineer of Tencent cloud, was responsible for building a new generation of multi-dimensional business monitoring system for Tencent cloud monitoring. He is good at large-scale distributed monitoring system design and has a deep understanding of the architecture design of golang background project. Later, he joined the TKE team to study Kubernetes related operation and maintenance technologies. He has many years of experience in federal operation and maintenance management of Kubernetes clusters, At present, the team is mainly responsible for improving the observability of large-scale cluster Federation, and has led the research and development of Tencent cloud 10000 Kubernetes cluster monitoring and alarm system, intelligent patrol inspection and risk detection system.
abstract
If you ask me what open source components will be used when managing Kubernetes clusters, I think Prometheus will be one of them. Prometheus has strong performance, active ecology, convenient deployment mode and flexible PromQL. It is especially suitable for monitoring data collection and aggregation at all levels of master, node and application in Kubernetes scenario. Combined with the dazzling Grafana panel (as shown in the figure below), Prometheus is the best solution for cloud native monitoring.


Although Prometheus and grafana are very powerful, they still have a certain learning cost and are not easy to use when they first contact, which I feel particularly. I remember that a few years ago, when I was not responsible for the improvement of the cloud's native visibility, I often heard a brother who was just touching Prometheus make complaints about it all day long. "Hey, how is the grammar of Prometheus so complex?" "this is disgusting, how to write it?" I laughed at him at that time, but when I started learning Prometheus, I started to make complaints about the Grafana panel.
 max(label_replace(
 label_replace(
 label_replace(
 kube_deployment_status_replicas_unavailable,
 "workload_kind","Deployment","","")
 ,"workload_name","$1","deployment","(.*)"),
 "__name__", "k8s_workload_abnormal", "__name__","(.*)")
 )
 by (namespace, workload_name, workload_kind,__name__)
 or on (namespace,workload_name,workload_kind, __name__) max(label_replace(
 label_replace(
 label_replace(
 kube_daemonset_status_number_unavailable,
 "workload_kind","DaemonSet","","")
 ,"workload_name","$1","daemonset","(.*)"),
 "__name__", "k8s_workload_abnormal", "__name__","(.*)") ) by (namespace, workload_name, workload_kind,__name__)
 or on (namespace,workload_name,workload_kind, __name__)
 max(label_replace(
 label_replace(
 label_replace(
 (kube_statefulset_replicas - kube_statefulset_status_replicas_ready),
 "workload_kind","StatefulSet","","")
 ,"workload_name","$1","statefulset","(.*)"),
 "__name__", "k8s_workload_abnormal", "__name__","(.*)") ) by (namespace, workload_name, workload_kind,__name__)
 or on (namespace,workload_name,workload_kind, __name__)
 max(label_replace(
 label_replace(
 label_replace(
 (kube_job_status_failed),
 "workload_kind","Job","","")
 ,"workload_name","$1","job_name","(.*)"),
 "__name__", "k8s_workload_abnormal", "__name__","(.*)") ) by (namespace, workload_name, workload_kind,__name__)
 or on (namespace,workload_name,workload_kind, __name__)
 max(label_replace(
 label_replace(
 label_replace(
 (kube_cronjob_info * 0),
 "workload_kind","CronJob","","")
 ,"workload_name","","cronjob","(.*)"),
 "__name__", "k8s_workload_abnormal", "__name__","(.*)") ) by (namespace, workload_name, workload_kind,__name__)
The author has accumulated some practical experience and stepped on many pits in the process of using Prometheus in recent years.
In order to enable readers who want to learn Prometheus to get started more quickly, avoid detours and improve business monitoring skills in the cloud native era.
The author sorted out and summarized a version of the tutorial, including some of the most basic and core concepts, skills and best practices to share with you, so that you can master 80% of the most commonly used parts in 20% of the time.
Learn how to give your own business exposure monitoring indicators from scratch, how to correctly configure service discovery, and how to configure a practical Grafana panel to lead readers to get started with Prometheus+Grafana at the speed of light and master the correct posture of cloud native monitoring. picture
The official account of Tencent cloud primary reply to Prometheus or speed of light can get tutorial. Let's learn together!
Tips: at present, the textbook has Website Version (which needs to be opened in the browser) and PDF version. Children's shoes can view it according to their own needs. The website version of the textbook will be continuously updated and you can pay attention to it~
At the same time, you are welcome to issue the tutorial. This tutorial will be updated, expanded and revised from time to time according to your feedback!

(mention the GitHub address of the issue)
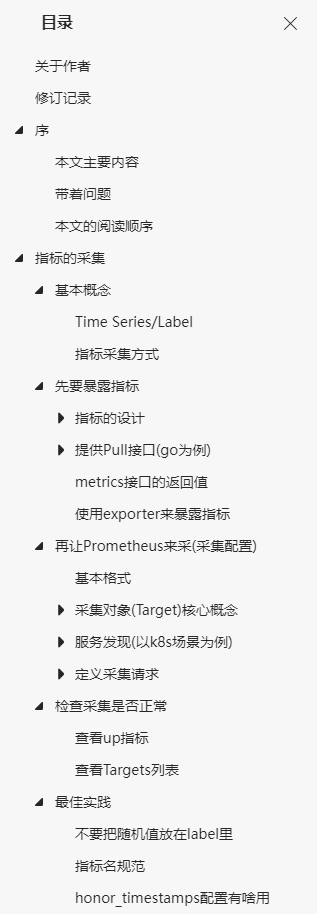
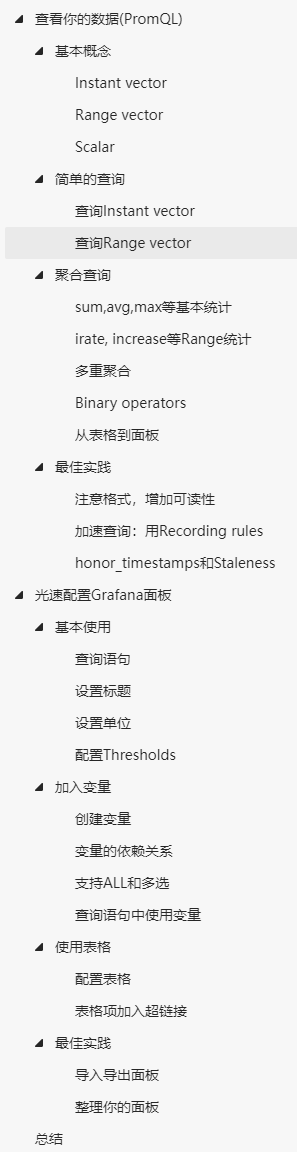
The catalogue of teaching materials is as follows
[Tencent cloud native] cloud says new products, Yunyan new technology, cloud tours, new cloud and cloud reward information, scanning code concern about the same official account number, and get more dry cargo in time!!
