Test requirements:
1. From the files in the "experimental images" directory, select 2 as the experimental data.
For each selected image, each clustering algorithm (maximum and minimum distance method, C-means method) and each given image are used
a. clustering algorithm is used to cluster the (R, G, B) color vectors of all pixels into class K;
b. simplify the color vector of each pixel class to obtain a color vector to which it belongs;
c. measure the error (distortion) between the simplified image and the original image;
d. write the simplified image to the JPEG file (use the same IMWRITE_JPEG_QUALITY parameter value).
2. For each combination (selected image, clustering algorithm), different K values correspond to different coding rate and distortion, and the rate distortion curve is drawn. In this way, a total of 4 rate distortion curves are drawn.
3. For the maximum and minimum distance clustering method, the average distortion of two simplified images under each K value is calculated, and a K value average distortion curve is drawn; For C-means clustering, the corresponding K-value average distortion curve is also drawn. The two curves are drawn in a common coordinate system.
4. For 3 And 4 The curve in is analyzed.
Experimental analysis:
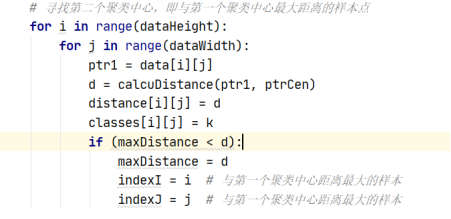
For the maximum and minimum distance method, a center point is randomly selected at the beginning, and then classified. Calculate the distance between each point and the center point, and select the point with the largest distance as the next center point. Because of some doubts about the code design, we will look for the second point and put forward the out of loop calculation separately. The distance stored in distance is the distance from each point to the center point. classes stores the subscript of the nearest center point corresponding to each point.
Corresponding code:

In the loop, first k=k+1, K represents the subscript of the current center point. minDistance represents the minimum distance from each point to all center points. Each cycle calculates the distance minDistance closest to the center point of all pixels. After calculation, find the subscript of the largest value in minDistance as the new center point. In this cycle, until the distance from the center point reaches K, the Theta value of 0.03 does not affect the results of different K values.
Corresponding code:

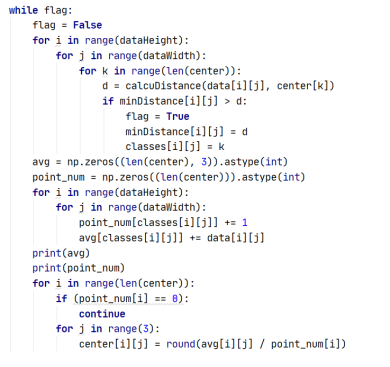
For the C-means method, K points are randomly selected as the center point. Like the maximum and minimum distance method, the minimum distance from each pixel to the center point is calculated, and then the corresponding index in the classes is updated. flag whether the distance from the pixel point to the center point has changed in this cycle. If so, it indicates that the clustering has not been completed until the minDistance does not change and exits the cycle.
For the rgb operation of updating the center point, add the RBG value of the point corresponding to each center point, and then divide it by the number of its corresponding pixel points.
Corresponding code:

Finally, the color vector of each original pixel is replaced by the centroid color vector of its cluster.
Through the corresponding relationship of classes, the corresponding pixel rgb is changed to the rgb of its cluster center
Corresponding code:

C-mean method code:
# -*-coding: utf-8 -*-
"""
    @Project: IntelligentManufacture
    @File   : c-clarify.py
    @Author : lishu
    @E-mail : 1659563963@qq.com
    @Date   : 2021-11-19
"""
import math
import numpy as np
import cv2


def calcuDistance(data1, data2):
    distance = 0
    for i in range(len(data1)):
        distance += pow((int(data1[i]) - int(data2[i])), 2)
    return math.sqrt(distance)


def maxmin_distance_cluster(data, Theta, K = 10000):

    maxDistance = 0
    startI = 0  # Initially select a center point
    startJ = 0  # Initially select a center point
    indexI = startI  # Equivalent to the pointer indicating the position of the new center point
    indexJ = startJ  # Equivalent to the pointer indicating the position of the new center point
    k = 0  # Center point count, i.e. category
    dataHeight = len(data)
    dataWidth = len(data[0])
    distance = np.zeros((dataHeight,dataWidth))
    minDistance = np.zeros((dataHeight,dataWidth))
    classes = np.zeros((dataHeight,dataWidth))
    centerIndex = [[indexI,indexJ]]

    # Initially select the first cluster center point
    ptrCen = data[0][0]
    # Find the second cluster center, that is, the sample point with the maximum distance from the first cluster center
    for i in range(dataHeight):
        for j in range(dataWidth):
            ptr1 = data[i][j]
            d = calcuDistance(ptr1, ptrCen)
            distance[i][j] = d
            classes[i][j] = k + 1
            if (maxDistance < d):
                maxDistance = d
                indexI = i  # The sample with the largest distance from the first cluster center
                indexJ = j  # The sample with the largest distance from the first cluster center

    minDistance = distance.copy()
    maxVal = maxDistance

def c_clarify(data, center):
    dataHeight = len(data)
    dataWidth = len(data[0])
    classes = np.zeros((dataHeight, dataWidth)).astype(int)
    minDistance = np.full((dataHeight,dataWidth),999999)
    np.zeros((dataHeight, dataWidth))
    flag = True

    while flag:
        flag = False
        for i in range(dataHeight):
            for j in range(dataWidth):
                for k in range(len(center)):
                    d = calcuDistance(data[i][j], center[k])
                    if minDistance[i][j] > d:
                        flag = True
                        minDistance[i][j] = d
                        classes[i][j] = k
        avg = np.zeros((len(center), 3)).astype(int)
        point_num = np.zeros((len(center))).astype(int)
        for i in range(dataHeight):
            for j in range(dataWidth):
                point_num[classes[i][j]] += 1
                avg[classes[i][j]] += data[i][j]
        print(avg)
        print(point_num)
        for i in range(len(center)):
            if (point_num[i] == 0):
                continue
            for j in range(3):
                center[i][j] = round(avg[i][j] / point_num[i])


    return classes, center


if __name__ == '__main__':
    PATH = 'C:/Users/lishu/Desktop/code/PatternRecognition/experience2/img/'
    cv2.namedWindow('image', cv2.WINDOW_NORMAL)
    for k in range(4):
        img = cv2.imread(PATH + 'scenery-2.jpg')
        data = np.asarray(img)
        center = []
        for i in range(40+k*20):
            center.append(img[0][i])
        center = np.asarray(center)
        classes, center = c_clarify(data, center)
        print(classes)
        print(center)

        for i in range(len(data)):
            for j in range(len(data[0])):
                img[i][j] = center[int(classes[i][j])]
        cv2.imwrite(PATH + 'C-scenery-2-' + str(40 + 20*k)+ '.jpeg', img)

    cv2.imshow('image', img)
    cv2.waitKey(0)
    cv2.destroyAllWindows()
Maximum and minimum distance method:
import math
import numpy as np
import cv2


def calcuDistance(data1, data2):
    distance = 0
    for i in range(len(data1)):
        distance += pow((int(data1[i]) - int(data2[i])), 2)
    return math.sqrt(distance)


def maxmin_distance_cluster(data, Theta, K = 10000):

    maxDistance = 0
    indexI = 0  # Equivalent to the pointer indicating the position of the new center point
    indexJ = 0  # Equivalent to the pointer indicating the position of the new center point
    k = 0  # Center point count, i.e. category
    dataHeight = len(data)
    dataWidth = len(data[0])
    distance = np.zeros((dataHeight,dataWidth))
    minDistance = np.zeros((dataHeight,dataWidth))
    classes = np.zeros((dataHeight,dataWidth))
    centerIndex = [[indexI,indexJ]]

    # Initially select the first cluster center point
    ptrCen = data[0][0]
    # Find the second cluster center, that is, the sample point with the maximum distance from the first cluster center
    for i in range(dataHeight):
        for j in range(dataWidth):
            ptr1 = data[i][j]
            d = calcuDistance(ptr1, ptrCen)
            distance[i][j] = d
            classes[i][j] = k
            if (maxDistance < d):
                maxDistance = d
                indexI = i  # The sample with the largest distance from the first cluster center
                indexJ = j  # The sample with the largest distance from the first cluster center

    minDistance = distance.copy()
    maxVal = maxDistance
    while maxVal > (maxDistance * Theta) and len(centerIndex) < K:
        k = k + 1
        centerIndex += [[indexI,indexJ]]  # New cluster center
        for i in range(dataHeight):
            for j in range(dataWidth):
                ptr1 = data[i][j]
                ptrCen = data[centerIndex[k][0],centerIndex[k][1]]
                d = calcuDistance(ptr1, ptrCen)
                distance[i][j] = d
                # According to the classification of the current nearest approach, the nearest approach is divided into which category
                if minDistance[i][j] > distance[i][j]:
                    minDistance[i][j] = distance[i][j]
                    classes[i][j] = k
            # Find the maximum distance in minDistance. If maxval > (maxdistance * theta), it indicates that there is a next cluster center
        # index = np.argmax(minDistance)
        index = np.unravel_index(minDistance.argmax(), minDistance.shape)
        indexI = index[0]
        indexJ = index[1]

        maxVal = minDistance[indexI][indexJ]
    return classes, centerIndex


if __name__ == '__main__':
    PATH = 'C:/Users/lishu/Desktop/code/PatternRecognition/experience2/img/'
    cv2.namedWindow('image', cv2.WINDOW_NORMAL)
    # for k in range(4):
    #     img = cv2.imread(PATH + 'scenery-2.jpg')
    #     data = np.asarray(img)
    #     Theta = 0.03
    #
    #     classes, centerIndex = maxmin_distance_cluster(data, Theta, 40 + k * 20)
    #
    #     for i in range(len(data)):
    #         for j in range(len(data[0])):
    #             index = int(classes[i][j]) - 1
    #             x = centerIndex[index][0]
    #             y = centerIndex[index][1]
    #             img[i][j] = img[x][y]
    #     cv2.imwrite(PATH+'MM-scenery-2-'+str(40 + k * 20) + '.jpeg', img)

    img = cv2.imread(PATH + 'scenery-1.jpg')
    data = np.asarray(img)
    Theta = 0.03

    classes, centerIndex = maxmin_distance_cluster(data, Theta, 100)

    for i in range(len(data)):
        for j in range(len(data[0])):
            index = int(classes[i][j])
            x = centerIndex[index][0]
            y = centerIndex[index][1]
            img[i][j] = img[x][y]
    cv2.imwrite(PATH+'MM-scenery-1-'+str(100) + '.jpeg', img)
    cv2.imshow('image', img)
    cv2.waitKey(0)
    cv2.destroyAllWindows()
Analysis diagram code obtained by each method:
import cv2
import os
import matplotlib.pyplot as plt
import numpy as np
DPATH = 'C:/Users/lishu/Desktop/code/PatternRecognition/experience2/img/'

if __name__ == '__main__':
    path = DPATH+'scenery-2.jpg'

    pathList = []

    for i in range(4):
        pathList.append(DPATH + 'C-'+'scenery-2-'+ str(i*20+40) +'.jpeg')
    length = len(pathList)
    img = cv2.imread(path)  #Read image


    # imgList = [img100, img80,img60, img30, img1]
    imgList = []
    for i in range(length):
        imgList.append(cv2.imread(pathList[i]))
    print(pathList)

    print(imgList)
    rateList = []
    for i in range(length):
        rateList.append(os.path.getsize(pathList[i]) * 8 / (imgList[i].size / 3))

    distortionList = []

    a = img.astype(np.float32)
    for k in range(length):
        b = imgList[k].astype(np.float32)
        c = np.maximum(a - b, b - a)
        total = np.sum(c)
        distortionList.append(total / img.size)
    print(rateList)
    print(distortionList)
    K = [40, 60, 80, 100]
    plt.plot(K, distortionList)
    plt.xlabel('K')  # Abscissa title
    plt.ylabel('distortion')  # Title of ordinate axis
    plt.show()
    print(total / img.size)
Get the average analysis diagram Code:
import cv2
import os
import matplotlib.pyplot as plt
import numpy as np
DPATH = 'C:/Users/lishu/Desktop/code/PatternRecognition/experience2/img/'

def getLine(alg):
    path1 = DPATH + 'scenery-1.jpg'
    path2 = DPATH + 'scenery-2.jpg'

    pathList1 = []
    pathList2 = []

    for i in range(4):
        pathList1.append(DPATH + alg +'-' + 'scenery-1-' + str(i * 20 + 40) + '.jpeg')
        pathList2.append(DPATH + alg +'-' + 'scenery-2-' + str(i * 20 + 40) + '.jpeg')

    length = len(pathList1)
    img1 = cv2.imread(path1)  # Read image
    img2 = cv2.imread(path2)  # Read image

    # imgList = [img100, img80,img60, img30, img1]
    imgList1 = []
    imgList2 = []
    for i in range(length):
        imgList1.append(cv2.imread(pathList1[i]))
        imgList2.append(cv2.imread(pathList2[i]))
    print(pathList1)

    print(imgList1)
    print(imgList2)

    distortionList = []

    a1 = img1.astype(np.float32)
    a2 = img2.astype(np.float32)

    for k in range(length):
        b = imgList1[k].astype(np.float32)
        c = np.maximum(a1 - b, b - a1)
        total = np.sum(c)
        distortionList.append(total / img1.size)
        print(distortionList[k])
        b = imgList2[k].astype(np.float32)
        c = np.maximum(a2 - b, b - a2)
        total = np.sum(c)
        distortionList[k] = ((total / img2.size) + distortionList[k]) / 2
    return distortionList

if __name__ == '__main__':
    # path1 = DPATH+'scenery-1.jpg'
    # path2 = DPATH+'scenery-2.jpg'
    #
    # pathList1 = []
    # pathList2 = []
    #
    # for i in range(4):
    #     pathList1.append(DPATH + 'MM-'+'scenery-1-'+ str(i*20+40) +'.jpeg')
    #     pathList2.append(DPATH + 'MM-'+'scenery-2-'+ str(i*20+40) +'.jpeg')
    #
    #
    # length = len(pathList1)
    # img1 = cv2.imread(path1)  #Read image
    # img2 = cv2.imread(path2)  #Read image
    #
    #
    # # imgList = [img100, img80,img60, img30, img1]
    # imgList1 = []
    # imgList2 = []
    # for i in range(length):
    #     imgList1.append(cv2.imread(pathList1[i]))
    #     imgList2.append(cv2.imread(pathList2[i]))
    # print(pathList1)
    #
    # print(imgList1)
    # print(imgList2)
    # rateList = []
    #
    # distortionList = []
    #
    # a1 = img1.astype(np.float32)
    # a2 = img2.astype(np.float32)
    #
    # for k in range(length):
    #     b = imgList1[k].astype(np.float32)
    #     c = np.maximum(a1 - b, b - a1)
    #     total = np.sum(c)
    #     distortionList.append(total / img1.size)
    #     print(distortionList[k])
    #     b = imgList2[k].astype(np.float32)
    #     c = np.maximum(a2 - b, b - a2)
    #     total = np.sum(c)
    #     distortionList[k] = ((total / img2.size) + distortionList[k])/2
    #
    distortionList1 = getLine('C')
    distortionList2 = getLine('MM')

    # print(distortionList)
    K = [40, 60, 80, 100]
    plt.plot(K, distortionList1,'r')
    plt.plot(K, distortionList2, 'b')
    plt.xlabel('K')  # Abscissa title
    plt.ylabel('distortion')  # Title of ordinate axis
    plt.show()
Because I numpy am not proficient enough, the code runs slowly, especially the C-means method, which takes half an hour to run, so there is still a lot of room for optimization.