Now everyone's life is more and more inseparable from station B,
In the first quarter of 2020, the monthly active users of station B reached 172 million, and the daily active users have exceeded 50 million.
The continuous flow of traffic makes the up owners of station B also the number of fans soar, and there are up owners with millions of fans everywhere.
Today, Xiaobian will lead you to climb and analyze the hottest video ranking of station B to see what kind of video everyone likes to watch ~
requirement analysis
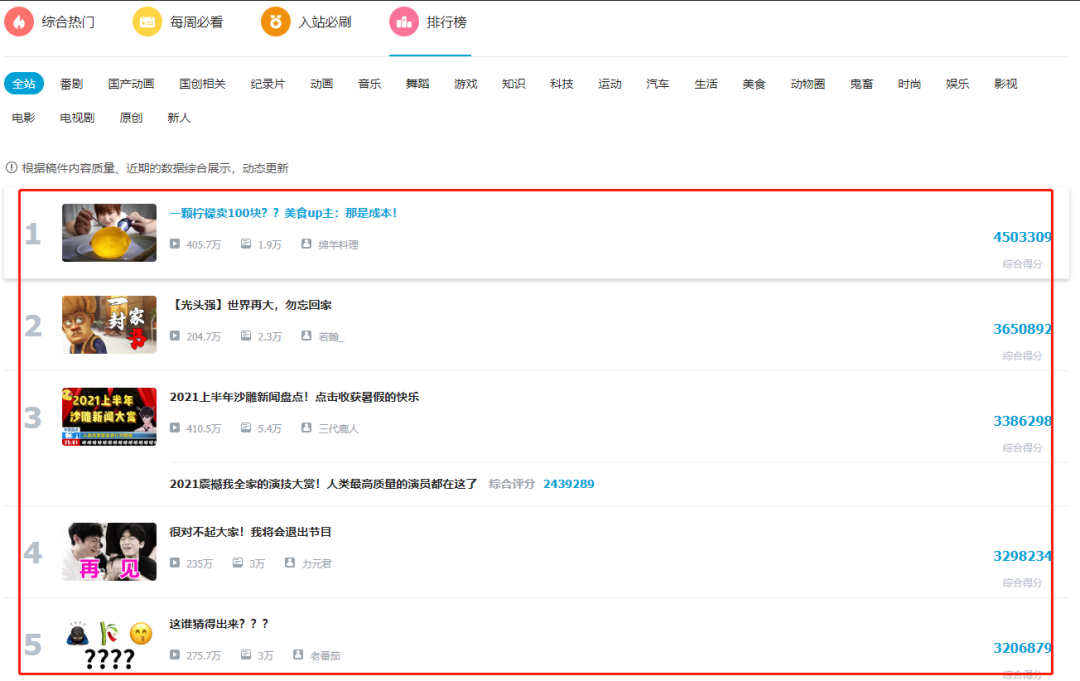
For the crawling of the list, we climbed the top 100 video of the list
Ranking, title, video link, playback volume, number of bullets, author, comprehensive score and author details page
And other information.
Web page analysis
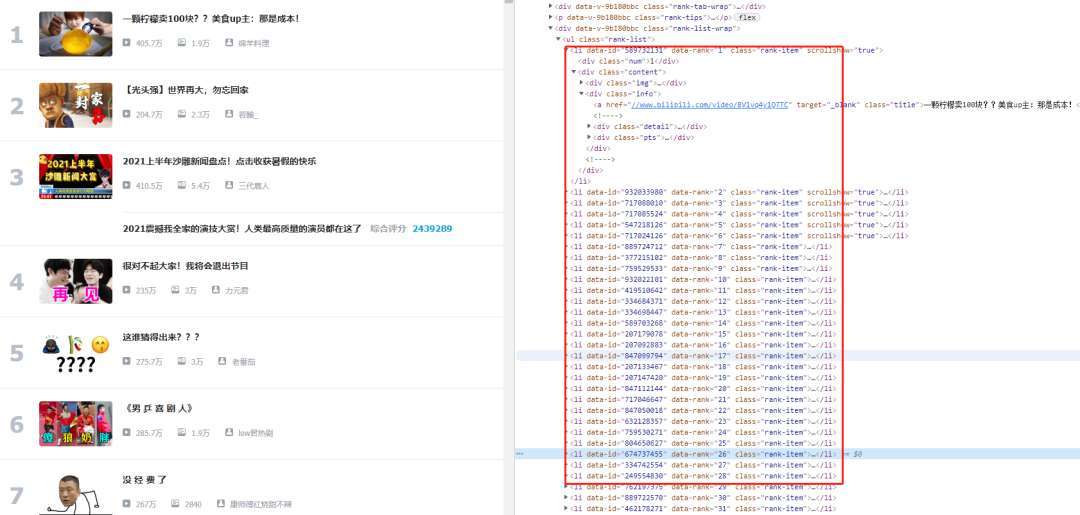
First, we open the browser developer mode as follows. All information can be found in the ul tab on the right,
So we first get the page information, and then use xpath to get the tag information.
Send request
  url = 'https://www.bilibili.com/v/popular/rank/all'

  headers = {
       "cookie": "_uuid=7D3DFA6C-6EB1-F72A-632B-C9AF9B9AD4C627183infoc; buvid3=D25672DE-BD2D-4E7C-B79E-DB356316D023167639infoc; sid=aylq5kgg; fingerprint=84acc3579a53d0eba78d769e71574df6; buvid_fp=BA184AFC-F4DC-408A-8897-D0EDEA653CE5148812infoc; buvid_fp_plain=BA184AFC-F4DC-408A-8897-D0EDEA653CE5148812infoc; DedeUserID=434541726; DedeUserID__ckMd5=448fda6ab5098e5e; SESSDATA=78a505c8%2C1643594982%2Cdfa35*81; bili_jct=1d9f4e960fb0ae7fe1de53663029874b; bsource=search_baidu; CURRENT_FNVAL=80; blackside_state=1; rpdid=|(u)YJR~R~)m0J'uYk)ku)~~)",
      "referer": "https://www.bilibili.com/",
      "user-agent": "Mozilla/5.0 (Windows NT 10.0; WOW64) AppleWebKit/537.36 (KHTML, like Gecko) Chrome/93.0.4577.8 Safari/537.36"
    }

  resp = requests.get(url, headers = headers, timeout=15)
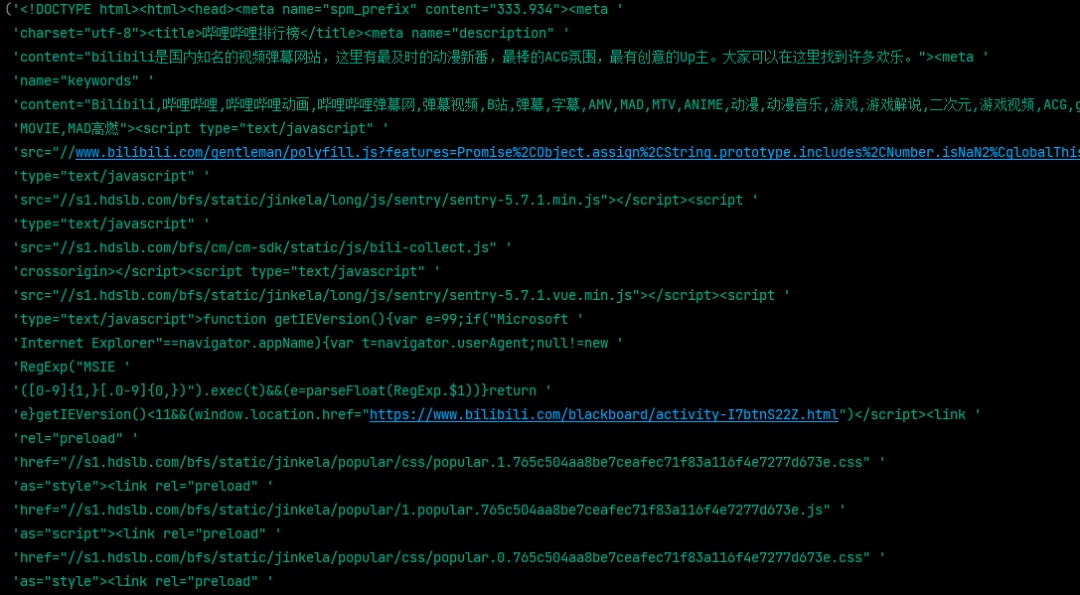
  ic(resp.text)
Get browser response information
Next, we use xpath to get the information inside the tag
 for li in lis:

    #Ranking
    sort = li.xpath("./div[@class='num']/text()")
    sort = ''.join(sort)

    #Author
    author = li.xpath("./div[@class='content']/div[@class='info']/div[@class='detail']/a/span[@class='data-box up-name']/text()")
    author = ''.join(author).strip()

    #Comprehensive score
    score = li.xpath("./div[@class='content']/div[@class='info']/div[@class='pts']/div/text()")
    score = ''.join(score)

    #Video title
    title = li.xpath("./div[@class='content']/div[@class='info']/a[@class='title']/text()")
    title = ''.join(title)

    #Video link
    links = li.xpath("./div[@class='content']/div[@class='img']/a/@href")
    links = ''.join(links).strip()[2:]

    #Number of plays
    video_num = li.xpath("./div[@class='content']/div[@class='info']/div[@class='detail']/span[@class='data-box'][1]/text()")
    video_num = ''.join(video_num).strip()

    #Number of barrages
    barrage_num = li.xpath("./div[@class='content']/div[@class='info']/div[@class='detail']/span[@class='data-box'][2]/text()")
    barrage_num = ''.join(barrage_num).strip()

    #Author details
    detail_auth = li.xpath(".//div[@class='content']/div[@class='info']/div[@class='detail']/a/@href")
    detail_auth = ['https:' + i for i in detail_auth]
    detail_auth = ''.join(detail_auth)

    ic(sort, author, score, title,links, video_num, barrage_num, detail_auth)
Some information is as follows:
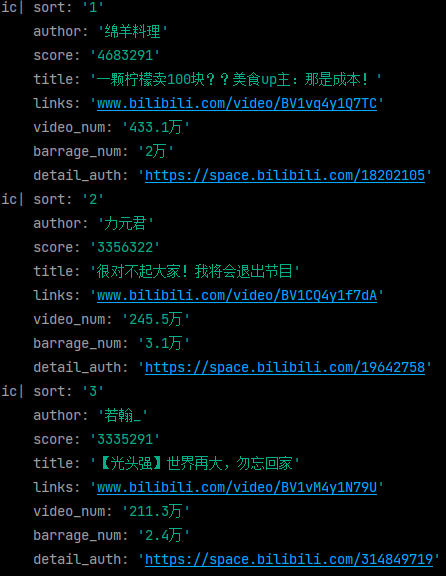
Data saving
Next, we use the openpyxl module to save the obtained information in excel
Facilitate subsequent data processing and visualization
  ws = op.Workbook()
  wb = ws.create_sheet(index=0)

  wb.cell(row=1, column=1, value='ranking')
  wb.cell(row=1, column=2, value='author')
  wb.cell(row=1, column=3, value='Comprehensive score')
  wb.cell(row=1, column=4, value='Video title')
  wb.cell(row=1, column=5, value='Video link')
  wb.cell(row=1, column=6, value='Number of plays')
  wb.cell(row=1, column=7, value='Number of barrages')
  wb.cell(row=1, column=8, value='Author details')
  ws.save('Bilibili Top100.xlsx')
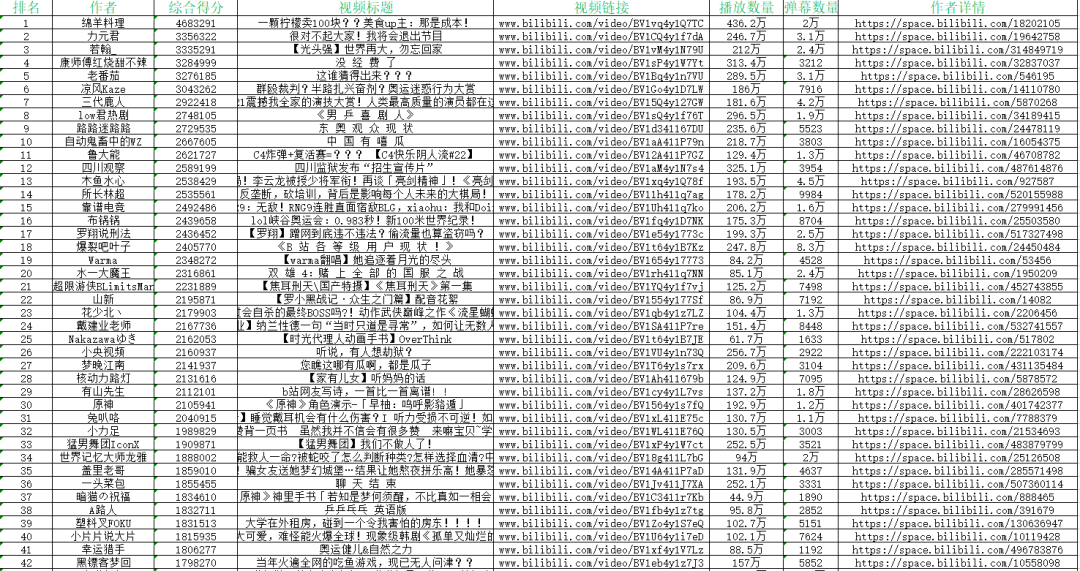
data processing
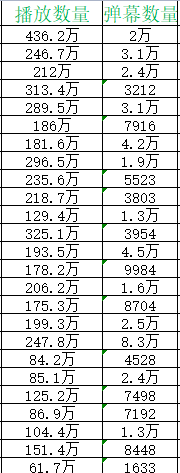
When processing data, we found that the unit formats of some data are inconsistent, as follows:
Some are in units of and some are in units of ten thousand.
In addition, we need to remove the "ten thousand" word behind the number and convert the number in string format into number type to facilitate the subsequent visual operation.
Here, we use pandas for data processing. If you don't understand, you can take a look at this tutorial. This is a very practical panda document summarized by myself.
People can not refuse the pandas skills, simple but easy to use!
  #Read data
  df = pd.read_excel('Bilibili Top100.xlsx')

  #Delete spaces
   pd_data = df.dropna(subset=['Number of plays', 'Number of barrages'])

  #Number of formatted data playback
  #Remove '10000‘
  pd_data['Number of plays'] = pd_data['Number of plays'].str.replace('ten thousand', '')
  #Conversion format: ≥ 10000 - > 10000
  pd_data['Number of barrages'] = pd_data['Number of barrages'].map(lambda x: float(x[:-1]) * 10000 if ('ten thousand' in x) else float(x))

  #Save processed data as
  pd_data.to_excel('Bilibili Top101.xlsx')
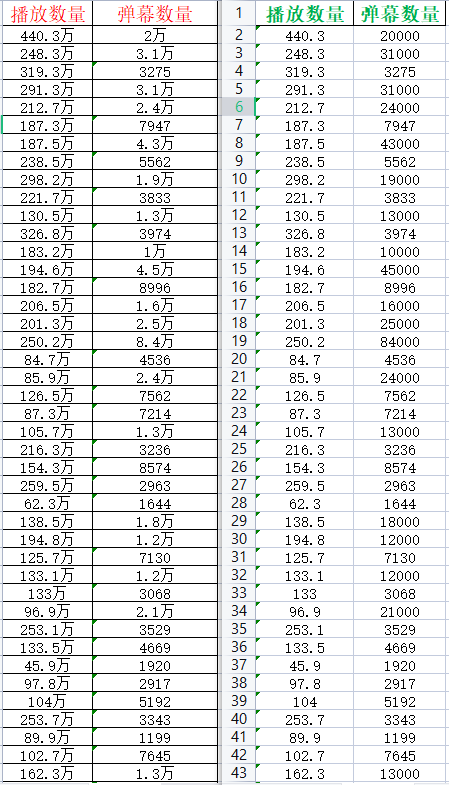
Red is the data before processing
Green is the processed data
We have converted a number of string type to a subtype
And unify numerical units
Next, we will find the video with the most comments and the video with the most barrage
See why they are so popular?
  #Maximum playback
  max_video_num = rcv_data[rcv_data['Number of plays'] == rcv_data['Number of plays'].max()]
  ic(max_video_num)

  #Maximum barrage
  max_cmts_num = rcv_data[rcv_data['Number of barrages'] == rcv_data['Number of barrages'].max()]
  ic(max_cmts_num)

  '''
  ic| max_video_num:    Unnamed: 0  ranking    author     Comprehensive score                    Video title                                 Video link   Number of plays   Number of barrages                                 Author details
                   0           0   1  Sheep cuisine  4742269  A lemon costs $100?? delicious food up Master: that's the cost!  www.bilibili.com/video/BV1vq4y1Q7TC  445.3  20000  https://space.bilibili.com/18202105
  ic| max_bag_num:     Unnamed: 0  ranking     author     Comprehensive score                   Video title                                 Video link   Number of plays   Number of barrages                                 Author details
                 19          19  20  Burst, leaf  2320837  <B station various etc. level use household present shape !>  www.bilibili.com/video/BV1t64y1B7Kz  252.7  84000  https://space.bilibili.com/24450484

  '''
This is the most played video,
Is lemon so expensive because miss is good-looking


Let's take a look at the video with the most bullets
What are you talking about? Look

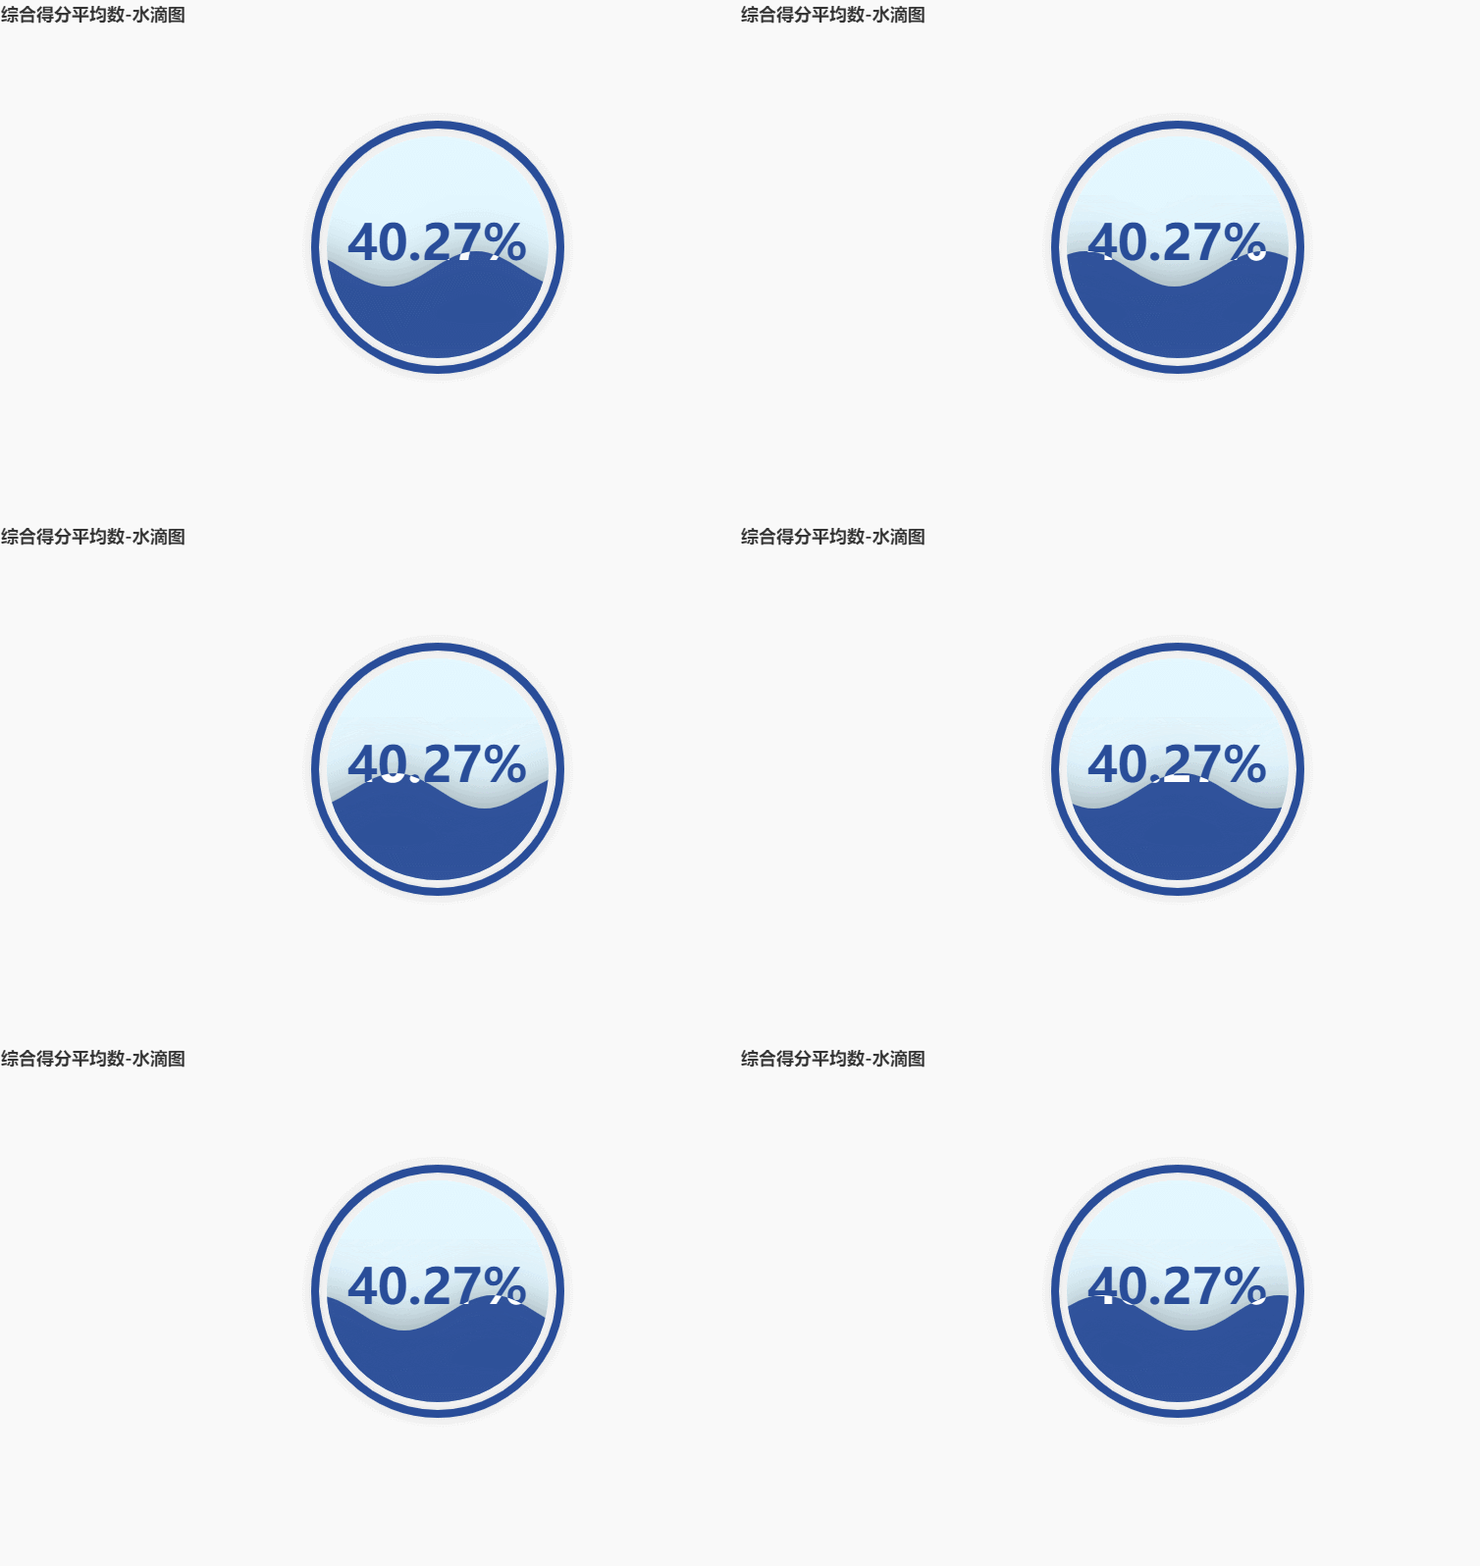
Finally, we use the water drop diagram to see the proportion of comprehensive scores
  #Average
  mean_score = rcv_data['Comprehensive score'].mean()

  #Maximum
  max_score = rcv_data['Comprehensive score'].max()
  #ic(mean_score/max_score)

  '''
  ic| mean_score/max_score: 0.39690731166873916
  '''
