introduction
This issue is a crawler and data analysis of Tencent's popular drama, fierce knife in the snow. It takes one hour, with a total of 1W comments. It is very suitable for newcomers to practice. It is worth noting that the emotional text analysis and processing of comments is the knowledge of the first contact.

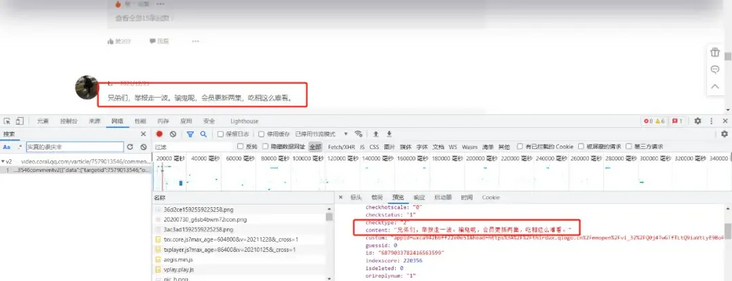
Crawler: since Tencent's comment data is encapsulated in json, you only need to find the json file and extract and save the required data.
- Video website: https://v.qq.com/x/cover/mzc0...
- Comment json data website: https://video.coral.qq.com/va...
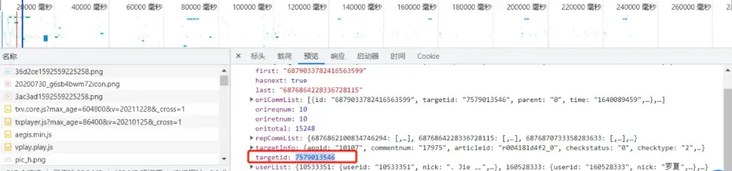
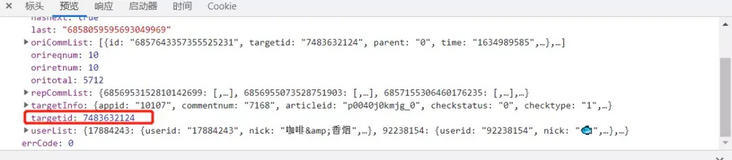
- Note: as long as you replace the value of the video digital id, you can crawl the comments of other videos
How do I find the video id?
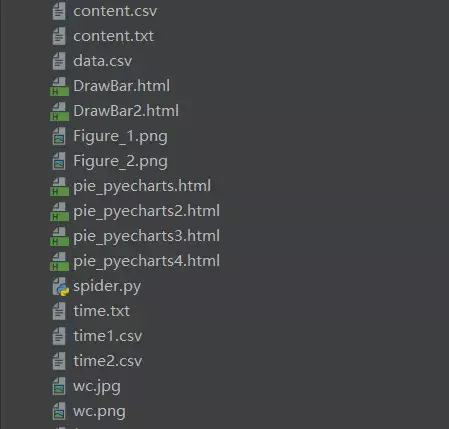
Project structure:
I Crawler part:
1. Crawling comment content code: spiders py
import requests
import re
import random

def get_html(url, params):
    uapools = [
        'Mozilla/5.0 (Macintosh; Intel Mac OS X 10_9_2) AppleWebKit/537.36 (KHTML, like Gecko) Chrome/35.0.1916.153 Safari/537.36',
        'Mozilla/5.0 (Windows NT 6.1; WOW64; rv:30.0) Gecko/20100101 Firefox/30.0',
        'Mozilla/5.0 (Macintosh; Intel Mac OS X 10_9_2) AppleWebKit/537.75.14 (KHTML, like Gecko) Version/7.0.3 Safari/537.75.14'
    ]

    thisua = random.choice(uapools)
    headers = {"User-Agent": thisua}
    r = requests.get(url, headers=headers, params=params)
    r.raise_for_status()
    r.encoding = r.apparent_encoding
    r.encoding = 'utf-8'# There is garbled code without this sentence
    return r.text

def parse_page(infolist, data):
    commentpat = '"content":"(.*?)"'
    lastpat = '"last":"(.*?)"'
    commentall = re.compile(commentpat, re.S).findall(data)
    next_cid = re.compile(lastpat).findall(data)[0]
    infolist.append(commentall)
    return next_cid


def print_comment_list(infolist):
    j = 0
    for page in infolist:
        print('Number' + str(j + 1) + 'page\n')
        commentall = page
        for i in range(0, len(commentall)):
            print(commentall[i] + '\n')
        j += 1


def save_to_txt(infolist, path):
    fw = open(path, 'w+', encoding='utf-8')
    j = 0
    for page in infolist:
        #fw.write('page '+ str(j + 1) +' page \ n ')
        commentall = page
        for i in range(0, len(commentall)):
            fw.write(commentall[i] + '\n')
        j += 1
    fw.close()


def main():
    infolist = []
    vid = '7579013546';
    cid = "0";
    page_num = 3000
    url = 'https://video.coral.qq.com/varticle/' + vid + '/comment/v2'
    #print(url)

    for i in range(page_num):
        params = {'orinum': '10', 'cursor': cid}
        html = get_html(url, params)
        cid = parse_page(infolist, html)


    print_comment_list(infolist)
    save_to_txt(infolist, 'content.txt')


main()
2. Crawl comment time code: sp.py
import requests
import re
import random


def get_html(url, params):
    uapools = [
        'Mozilla/5.0 (Macintosh; Intel Mac OS X 10_9_2) AppleWebKit/537.36 (KHTML, like Gecko) Chrome/35.0.1916.153 Safari/537.36',
        'Mozilla/5.0 (Windows NT 6.1; WOW64; rv:30.0) Gecko/20100101 Firefox/30.0',
        'Mozilla/5.0 (Macintosh; Intel Mac OS X 10_9_2) AppleWebKit/537.75.14 (KHTML, like Gecko) Version/7.0.3 Safari/537.75.14'
    ]

    thisua = random.choice(uapools)
    headers = {"User-Agent": thisua}
    r = requests.get(url, headers=headers, params=params)
    r.raise_for_status()
    r.encoding = r.apparent_encoding
    r.encoding = 'utf-8'# There is garbled code without this sentence
    return r.text


def parse_page(infolist, data):
    commentpat = '"time":"(.*?)"'
    lastpat = '"last":"(.*?)"'

    commentall = re.compile(commentpat, re.S).findall(data)
    next_cid = re.compile(lastpat).findall(data)[0]

    infolist.append(commentall)

    return next_cid


def print_comment_list(infolist):
    j = 0
    for page in infolist:
        print('Number' + str(j + 1) + 'page\n')
        commentall = page
        for i in range(0, len(commentall)):
            print(commentall[i] + '\n')
        j += 1


def save_to_txt(infolist, path):
    fw = open(path, 'w+', encoding='utf-8')
    j = 0
    for page in infolist:
        #fw.write('page '+ str(j + 1) +' page \ n ')
        commentall = page
        for i in range(0, len(commentall)):
            fw.write(commentall[i] + '\n')
        j += 1
    fw.close()


def main():
    infolist = []
    vid = '7579013546';
    cid = "0";
    page_num =3000
    url = 'https://video.coral.qq.com/varticle/' + vid + '/comment/v2'
    #print(url)

    for i in range(page_num):
        params = {'orinum': '10', 'cursor': cid}
        html = get_html(url, params)
        cid = parse_page(infolist, html)


    print_comment_list(infolist)
    save_to_txt(infolist, 'time.txt')


main()
II Data processing part
1. The timestamp of the comment is converted to the normal time py
# coding=gbk
import csv
import time

csvFile = open("data.csv",'w',newline='',encoding='utf-8')
writer = csv.writer(csvFile)
csvRow = []
#print(csvRow)
f = open("time.txt",'r',encoding='utf-8')
for line in f:
    csvRow = int(line)
    #print(csvRow)

    timeArray = time.localtime(csvRow)
    csvRow = time.strftime("%Y-%m-%d %H:%M:%S", timeArray)
    print(csvRow)
    csvRow = csvRow.split()
    writer.writerow(csvRow)

f.close()
csvFile.close()
2. Read the comments into csv} CD py
# coding=gbk
import csv
csvFile = open("content.csv",'w',newline='',encoding='utf-8')
writer = csv.writer(csvFile)
csvRow = []

f = open("content.txt",'r',encoding='utf-8')
for line in f:
    csvRow = line.split()
    writer.writerow(csvRow)

f.close()
csvFile.close()
3. Count the number of comments in each time period of the day py py
# coding=gbk
import csv

from pyecharts import options as opts
from sympy.combinatorics import Subset
from wordcloud import WordCloud

with open('../Spiders/data.csv') as csvfile:
    reader = csv.reader(csvfile)

    data1 = [str(row[1])[0:2] for row in reader]

    print(data1)
print(type(data1))


#First become a set to get all the elements in seq to avoid repeated traversal
set_seq = set(data1)
rst = []
for item in set_seq:
    rst.append((item,data1.count(item)))  #Added elements and number of occurrences
rst.sort()
print(type(rst))
print(rst)

with open("time2.csv", "w+", newline='', encoding='utf-8') as f:
    writer = csv.writer(f, delimiter=',')
    for i in rst:                # For each row, write each element of the row in the corresponding column
        writer.writerow(i)

with open('time2.csv') as csvfile:
     reader = csv.reader(csvfile)
     x = [str(row[0]) for row in reader]
     print(x)
with open('time2.csv') as csvfile:
    reader = csv.reader(csvfile)
    y1 = [float(row[1]) for row in reader]
    print(y1)
4. Statistics of recent comments py1 py
# coding=gbk
import csv

from pyecharts import options as opts
from sympy.combinatorics import Subset
from wordcloud import WordCloud

with open('../Spiders/data.csv') as csvfile:
    reader = csv.reader(csvfile)

    data1 = [str(row[0]) for row in reader]
    #print(data1)
print(type(data1))


#First become a set to get all the elements in seq to avoid repeated traversal
set_seq = set(data1)
rst = []
for item in set_seq:
    rst.append((item,data1.count(item)))  #Added elements and number of occurrences
rst.sort()
print(type(rst))
print(rst)


with open("time1.csv", "w+", newline='', encoding='utf-8') as f:
    writer = csv.writer(f, delimiter=',')
    for i in rst:                # For each row, write each element of the row in the corresponding column
        writer.writerow(i)

with open('time1.csv') as csvfile:
     reader = csv.reader(csvfile)
     x = [str(row[0]) for row in reader]
     print(x)
with open('time1.csv') as csvfile:
    reader = csv.reader(csvfile)
    y1 = [float(row[1]) for row in reader]

    print(y1)
III Data analysis
Data analysis: it involves word cloud chart, bar, broken line and pie chart. The latter three are the analysis of the proportion of comment time and starring. However, Tencent's comment time is displayed in the form of timestamp, so it needs to be converted, and then count the number of occurrences. Finally, an emotional analysis of comment content is added.
1. Make word cloud picture
wc.py
import numpy as np
import re
import jieba
from wordcloud import WordCloud
from matplotlib import pyplot as plt
from PIL import Image

# The above package is installed by yourself. If not, just Baidu

f = open('content.txt', 'r', encoding='utf-8')  # This is the data source, that is, the data to generate the word cloud
txt = f.read()  # read file
f.close()  # Close the file. In fact, use with, but don't bother to change it
# If it is an article, you need to use jieba word segmentation. After segmentation, you can also deal with it yourself and then generate word cloud
newtxt = re.sub("[A-Za-z0-9!%[],\. ]", "", txt)
print(newtxt)
words = jieba.lcut(newtxt)

img = Image.open(r'wc.jpg')  # Want to make shape
img_array = np.array(img)

# Related configurations, in which the collaborations configuration can avoid duplication
wordcloud = WordCloud(
    background_color="white",
    width=1080,
    height=960,
    font_path="../Wen Yuexin youth.otf",
    max_words=150,
    scale=10,#definition
    max_font_size=100,
    mask=img_array,
    collocations=False).generate(newtxt)

plt.imshow(wordcloud)
plt.axis('off')
plt.show()
wordcloud.to_file('wc.png')
Outline drawing: WC jpg

Insert picture description here
Word cloud: result Png (Note: English letters should be filtered out here)

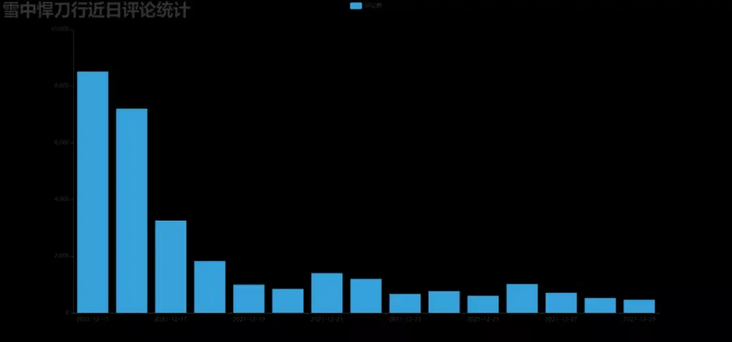
2. Make a bar chart of recent comments drawbar py
# encoding: utf-8
import csv
import pyecharts.options as opts
from pyecharts.charts import Bar
from pyecharts.globals import ThemeType


class DrawBar(object):

    """Draw column chart class"""
    def __init__(self):
        """Create a histogram instance and set the width, height and style"""
        self.bar = Bar(init_opts=opts.InitOpts(width='1500px', height='700px', theme=ThemeType.LIGHT))

    def add_x(self):
        """Add to drawing X Axis data"""
        with open('time1.csv') as csvfile:
            reader = csv.reader(csvfile)
            x = [str(row[0]) for row in reader]
            print(x)


        self.bar.add_xaxis(
            xaxis_data=x,

        )

    def add_y(self):
        with open('time1.csv') as csvfile:
            reader = csv.reader(csvfile)
            y1 = [float(row[1]) for row in reader]

            print(y1)


        """Add to drawing Y Axis data, multiple can be added"""
        self.bar.add_yaxis(  # First Y-axis data
            series_name="Number of comments",  # Y-axis data name
            y_axis=y1,  # Y-axis data
            label_opts=opts.LabelOpts(is_show=True,color="black"),  # Set label
            bar_max_width='100px',  # Sets the maximum width of the column
        )


    def set_global(self):
        """Set the global properties of the drawing"""
        #self.bar(width=2000,height=1000)
        self.bar.set_global_opts(
            title_opts=opts.TitleOpts(  # Set title
                title='Recent comments and statistics of fierce sabre in the snow',title_textstyle_opts=opts.TextStyleOpts(font_size=35)

            ),
            tooltip_opts=opts.TooltipOpts(  # Prompt box configuration item (what is displayed when the mouse is moved over the drawing)
                is_show=True,  # Show prompt box
                trigger="axis",  # Trigger type (triggered by axis coordinate axis, a solid line perpendicular to X axis will follow the mouse when the mouse moves, and prompt information will be displayed)
                axis_pointer_type="cross"# Indicator type (cross will generate two dashed lines perpendicular to the X-axis and Y-axis respectively, which will be displayed completely only if trigger is not enabled)
            ),
            toolbox_opts=opts.ToolboxOpts(),  # Toolbox configuration item (nothing is filled in, and all tools are enabled by default)

        )

    def draw(self):
        """Drawing graphics"""

        self.add_x()
        self.add_y()
        self.set_global()
        self.bar.render('../Html/DrawBar.html')  # Plot the graph to test HTML file, which can be opened in the browser
    def run(self):
        """Execution function"""
        self.draw()


if __name__ == '__main__':
    app = DrawBar()

app.run()
Effect picture: drawbar html
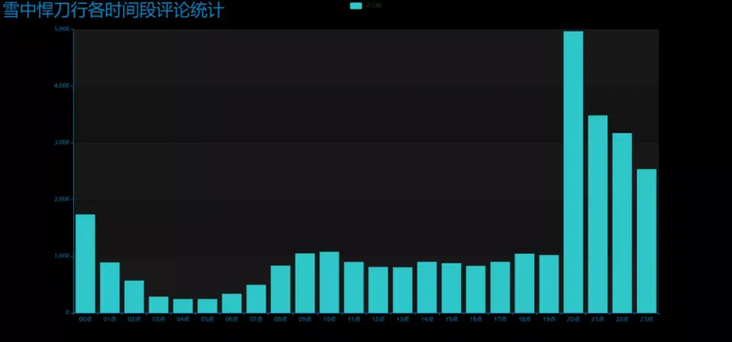
3. Make hourly comment bar chart # drawbar2 py
# encoding: utf-8
# encoding: utf-8
import csv
import pyecharts.options as opts
from pyecharts.charts import Bar
from pyecharts.globals import ThemeType


class DrawBar(object):

    """Draw column chart class"""
    def __init__(self):
        """Create a histogram instance and set the width, height and style"""
        self.bar = Bar(init_opts=opts.InitOpts(width='1500px', height='700px', theme=ThemeType.MACARONS))

    def add_x(self):
        """Add to drawing X Axis data"""
        str_name1 = 'spot'

        with open('time2.csv') as csvfile:
            reader = csv.reader(csvfile)
            x = [str(row[0] + str_name1) for row in reader]
            print(x)


        self.bar.add_xaxis(
            xaxis_data=x
        )

    def add_y(self):
        with open('time2.csv') as csvfile:
            reader = csv.reader(csvfile)
            y1 = [int(row[1]) for row in reader]

            print(y1)


        """Add to drawing Y Axis data, multiple can be added"""
        self.bar.add_yaxis(  # First Y-axis data
            series_name="Number of comments",  # Y-axis data name
            y_axis=y1,  # Y-axis data
            label_opts=opts.LabelOpts(is_show=False),  # Set label
            bar_max_width='50px',  # Sets the maximum width of the column

        )


    def set_global(self):
        """Set the global properties of the drawing"""
        #self.bar(width=2000,height=1000)
        self.bar.set_global_opts(
            title_opts=opts.TitleOpts(  # Set title
                title='Comments and statistics of fierce sabre in snow at each time period',title_textstyle_opts=opts.TextStyleOpts(font_size=35)

            ),
            tooltip_opts=opts.TooltipOpts(  # Prompt box configuration item (what is displayed when the mouse is moved over the drawing)
                is_show=True,  # Show prompt box
                trigger="axis",  # Trigger type (triggered by axis coordinate axis, a solid line perpendicular to X axis will follow the mouse when the mouse moves, and prompt information will be displayed)
                axis_pointer_type="cross"# Indicator type (cross will generate two dashed lines perpendicular to the X-axis and Y-axis respectively, which will be displayed completely only if trigger is not enabled)
            ),
            toolbox_opts=opts.ToolboxOpts(),  # Toolbox configuration item (nothing is filled in, and all tools are enabled by default)

        )

    def draw(self):
        """Drawing graphics"""

        self.add_x()
        self.add_y()
        self.set_global()
        self.bar.render('../Html/DrawBar2.html')  # Plot the graph to test HTML file, which can be opened in the browser
    def run(self):
        """Execution function"""
        self.draw()

if __name__ == '__main__':
    app = DrawBar()

app.run()
Effect picture: drawbar2 html
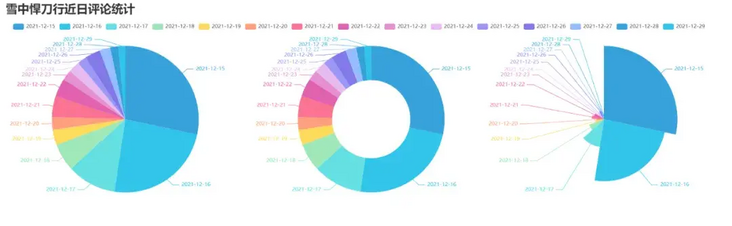
4. Make a pie chart of recent comments_ pyecharts. py
import csv
from pyecharts import options as opts
from pyecharts.charts import Pie
from random import randint
from pyecharts.globals import ThemeType
with open('time1.csv') as csvfile:
    reader = csv.reader(csvfile)
    x = [str(row[0]) for row in reader]
    print(x)
with open('time1.csv') as csvfile:
    reader = csv.reader(csvfile)
    y1 = [float(row[1]) for row in reader]
    print(y1)
num = y1
lab = x
(
    Pie(init_opts=opts.InitOpts(width='1700px',height='450px',theme=ThemeType.LIGHT))#Default 900600
    .set_global_opts(
        title_opts=opts.TitleOpts(title="Recent comments and statistics of fierce sabre in the snow",
                                               title_textstyle_opts=opts.TextStyleOpts(font_size=27)),legend_opts=opts.LegendOpts(

            pos_top="10%", pos_left="1%",# Legend position adjustment
            ),)
    .add(series_name='',center=[280, 270], data_pair=[(j, i) for i, j in zip(num, lab)])#Pie chart
   .add(series_name='',center=[845, 270],data_pair=[(j,i) for i,j in zip(num,lab)],radius=['40%','75%'])#Ring graph
    .add(series_name='', center=[1380, 270],data_pair=[(j, i) for i, j in zip(num, lab)], rosetype='radius')#Nightingale map
).render('pie_pyecharts.html')
design sketch
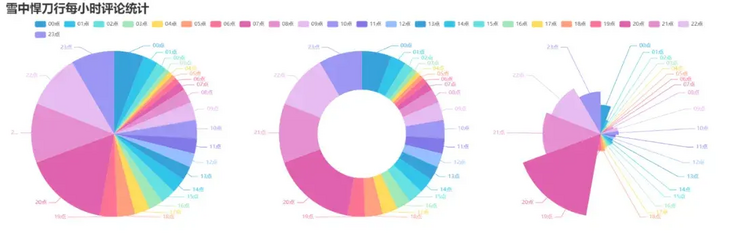
5. Make an hourly review pie_pyecharts2.py
import csv
from pyecharts import options as opts
from pyecharts.charts import Pie
from random import randint
from pyecharts.globals import ThemeType
str_name1 = 'spot'
with open('time2.csv') as csvfile:
    reader = csv.reader(csvfile)
    x = [str(row[0]+str_name1) for row in reader]
    print(x)
with open('time2.csv') as csvfile:
    reader = csv.reader(csvfile)
    y1 = [int(row[1]) for row in reader]

    print(y1)
num = y1
lab = x
(
    Pie(init_opts=opts.InitOpts(width='1650px',height='500px',theme=ThemeType.LIGHT,))#Default 900600
     .set_global_opts(
        title_opts=opts.TitleOpts(title="Hourly comment statistics of fierce sabre in snow"
                                  ,title_textstyle_opts=opts.TextStyleOpts(font_size=27)),
        legend_opts=opts.LegendOpts(

            pos_top="8%", pos_left="4%",# Legend position adjustment
            ),
    )
    .add(series_name='',center=[250, 300], data_pair=[(j, i) for i, j in zip(num, lab)])#Pie chart
    .add(series_name='',center=[810, 300],data_pair=[(j,i) for i,j in zip(num,lab)],radius=['40%','75%'])#Ring graph
    .add(series_name='', center=[1350, 300],data_pair=[(j, i) for i, j in zip(num, lab)], rosetype='radius')#Nightingale map
).render('pie_pyecharts2.html')
design sketch
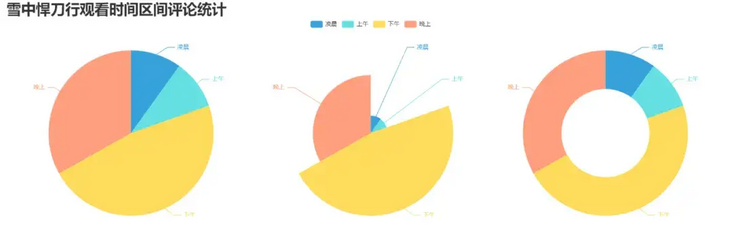
6. Make a statistical pie chart of comments in the viewing time interval_ pyecharts3. py
# coding=gbk
import csv
from pyecharts import options as opts
from pyecharts.globals import ThemeType
from sympy.combinatorics import Subset
from wordcloud import WordCloud
from pyecharts.charts import Pie
from random import randintwith open(/data.csv') as csvfile:
    reader = csv.reader(csvfile)
    data2 = [int(row[1].strip('')[0:2]) for row in reader]
    #print(data2)
print(type(data2))
#First become a set to get all the elements in seq to avoid repeated traversal
set_seq = set(data2)
list = []
for item in set_seq:
    list.append((item,data2.count(item)))  #Added elements and number of occurrences
list.sort()
print(type(list))
#print(list)
with open("time2.csv", "w+", newline='', encoding='utf-8') as f:
    writer = csv.writer(f, delimiter=',')
    for i in list:                # For each row, write each element of the row in the corresponding column
        writer.writerow(i)
n = 4#Divided into n groups
m = int(len(list)/n)
list2 = []
for i in range(0, len(list), m):
    list2.append(list[i:i+m])

print("before dawn : ",list2[0])
print("morning : ",list2[1])
print("afternoon : ",list2[2])
print("night : ",list2[3])

with open('time2.csv') as csvfile:
    reader = csv.reader(csvfile)
    y1 = [int(row[1]) for row in reader]

    print(y1)

n =6
groups = [y1[i:i + n] for i in range(0, len(y1), n)]

print(groups)

x=['before dawn','morning','afternoon','night']
y1=[]
for y1 in groups:
    num_sum = 0
    for groups in y1:
        num_sum += groups
str_name1 = 'spot'
num = y1
lab = x
(
    Pie(init_opts=opts.InitOpts(width='1500px',height='450px',theme=ThemeType.LIGHT))#Default 900600
        .set_global_opts(
        title_opts=opts.TitleOpts(title="Comment statistics of viewing time interval of fierce knife in snow"
                                  , title_textstyle_opts=opts.TextStyleOpts(font_size=30)),
        legend_opts=opts.LegendOpts(

            pos_top="8%",  # Legend position adjustment
        ),
    )
    .add(series_name='',center=[260, 270], data_pair=[(j, i) for i, j in zip(num, lab)])#Pie chart
   .add(series_name='',center=[1230, 270],data_pair=[(j,i) for i,j in zip(num,lab)],radius=['40%','75%'])#Ring graph
    .add(series_name='', center=[750, 270],data_pair=[(j, i) for i, j in zip(num, lab)], rosetype='radius')#Nightingale map
).render('pie_pyecharts3.html')
design sketch
7. Make the pie chart of the proportion of the fierce knife in the snow_ pyecharts4. py
import csv
from pyecharts import options as opts
from pyecharts.charts import Pie
from random import randint
from pyecharts.globals import ThemeType
f = open('content.txt', 'r', encoding='utf-8')  # This is the data source, that is, the data to generate the word cloud
words = f.read()  # read file
f.close()  # Close the file. In fact, use with, but don't bother to change it

name=["Zhang Ruoyun","Li Gengxi","Hu Jun"]

print(name)
count=[float(words.count("Zhang Ruoyun")),
      float(words.count("Li Gengxi")),
      float(words.count("Hu Jun"))]
print(count)
num = count
lab = name
(
    Pie(init_opts=opts.InitOpts(width='1650px',height='450px',theme=ThemeType.LIGHT))#Default 900600
    .set_global_opts(
        title_opts=opts.TitleOpts(title="Proportion of fierce knife in snow",
                                               title_textstyle_opts=opts.TextStyleOpts(font_size=27)),legend_opts=opts.LegendOpts(
            pos_top="3%", pos_left="33%",# Legend position adjustment
            ),)
    .add(series_name='',center=[280, 270], data_pair=[(j, i) for i, j in zip(num, lab)])#Pie chart
   .add(series_name='',center=[800, 270],data_pair=[(j,i) for i,j in zip(num,lab)],radius=['40%','75%'])#Ring graph
    .add(series_name='', center=[1300, 270],data_pair=[(j, i) for i, j in zip(num, lab)], rosetype='radius')#Nightingale map
).render('pie_pyecharts4.html')
design sketch

8. Emotional analysis of comment content: snownlp py
import numpy as np
from snownlp import SnowNLP
import matplotlib.pyplot as plt

f = open('content.txt', 'r', encoding='UTF-8')
list = f.readlines()
sentimentslist = []
for i in list:
    s = SnowNLP(i)

    print(s.sentiments)
    sentimentslist.append(s.sentiments)
plt.hist(sentimentslist, bins=np.arange(0, 1, 0.01), facecolor='g')
plt.xlabel('Sentiments Probability')
plt.ylabel('Quantity')
plt.title('Analysis of Sentiments')
plt.show()
Effect picture (frequency of each score segment of emotion)
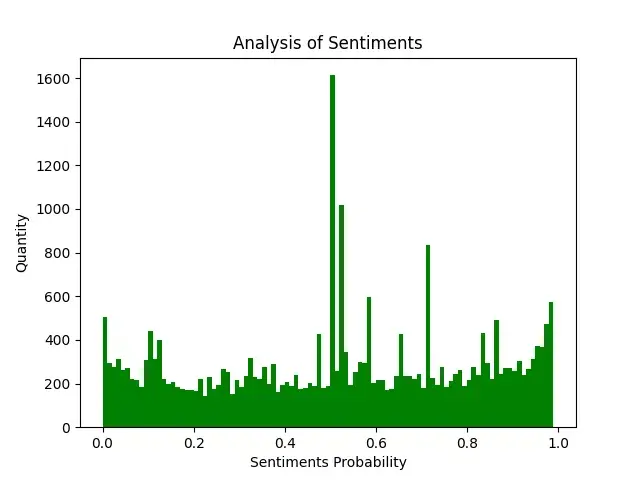
SnowNLP emotion analysis is based on the emotion dictionary. It simply divides the text into two categories: positive and negative. The return value is the probability of emotion, that is, the emotion score is between [0,1]. The closer it is to 1, the more positive it is. The closer it is to 0, the more negative it is.