The performance optimization of web pages will be divided into two parts: the performance optimization of resource loading and the performance optimization of code running.
For the Performance optimization of code operation, you need to use the Performance tool to record the code operation for a certain period of time, analyze the long task, locate the time-consuming code and optimize it.
For example, long task is marked in red in the following figure:
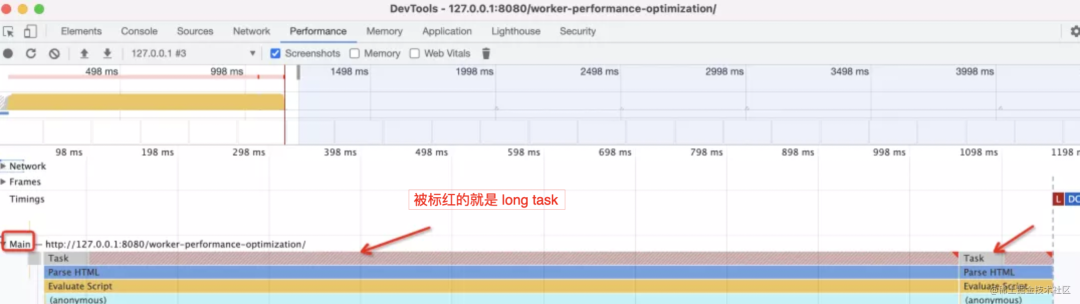
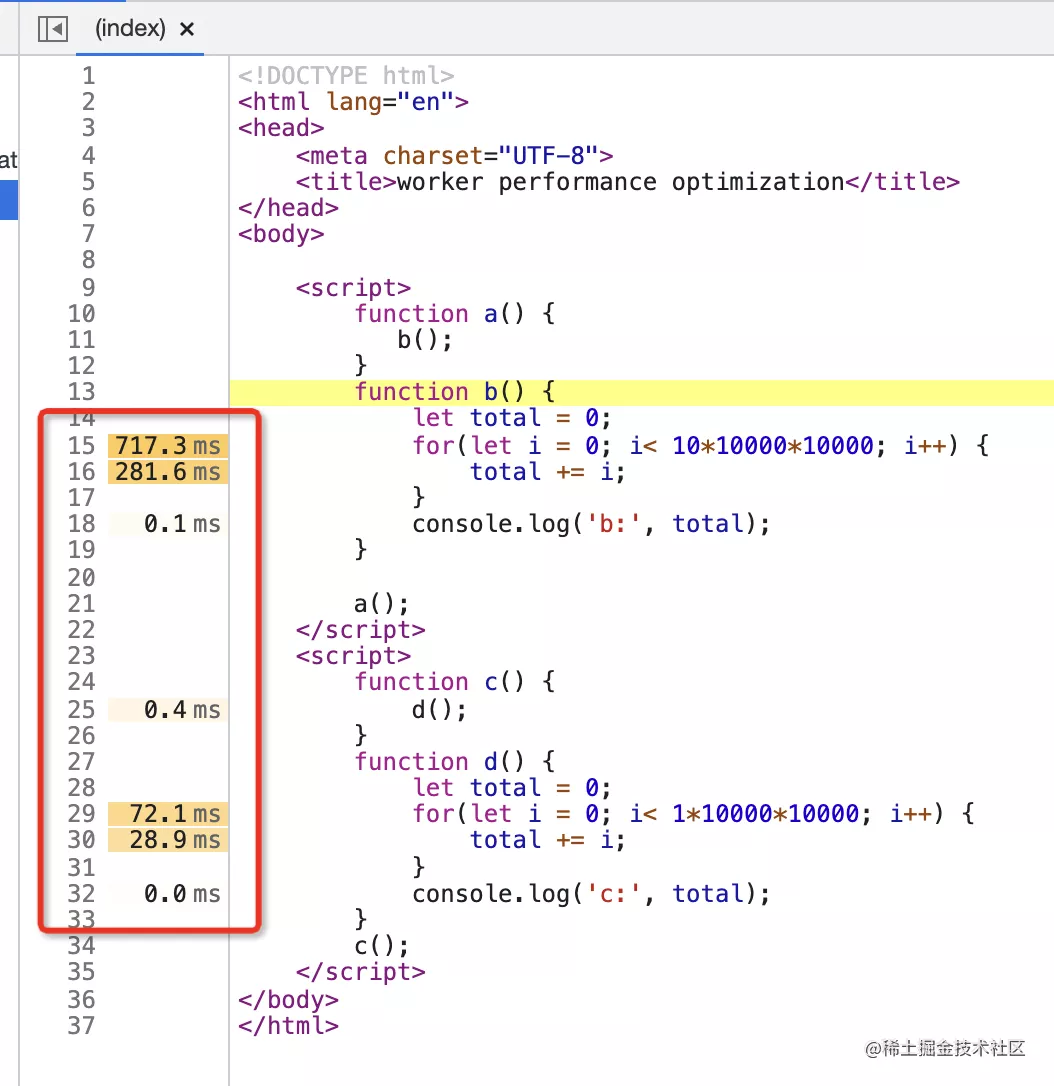
You can further locate time-consuming code and optimize it.
(if you can't use Performance tools for Performance analysis, you can see this article: Quickly master Performance analysis: a real optimization case)
Another aspect is the performance optimization of resource loading.
We will use webpack and purgecss for js and css treeshaking, and webpack's code splitting for lazy loading. The purpose is to remove useless code or delay loading to improve web page performance.
However, in many cases, treeshaking and code splitting are done in the dark. We may use this function, but we don't know the effect. We don't know whether we really achieve the purpose of optimizing the loading performance, delete the unused code or delay loading.
If only we could analyze the unused code and display it visually, just like the time-consuming Performance tool analysis and visual code, so that we could do treeshaging or lazy loading, and intuitively see the effects before and after optimization.
In fact, Chrome Devtools has this function, but many people don't know it. Let's learn this tool today.
Coverage tool analyzes useless code
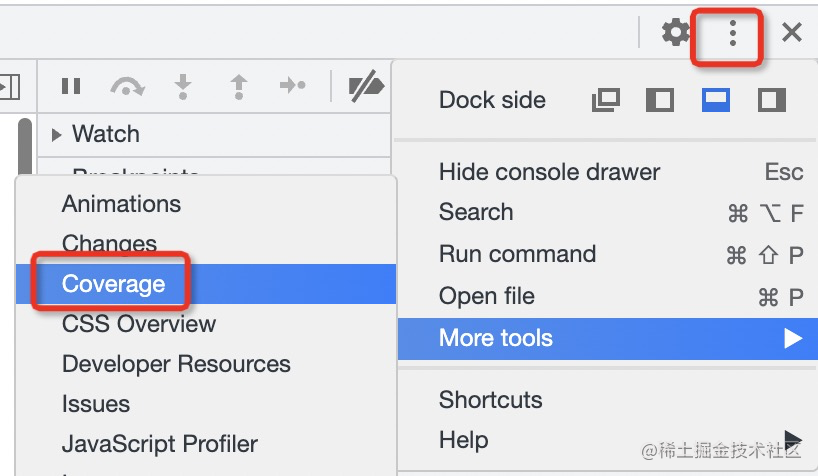
Chrome Devtools provides Coverage tools to analyze code usage at runtime:
We prepare this Code:
<!DOCTYPE html>
<html lang="en">
<head>
    <meta charset="UTF-8">
    <style type="text/css">
        #box {
            width: 300px;
            height: 300px;
            background: blue;
        }
        a {
            color: #fff;
        }
        .box {
            background: pink;
        }
    </style>
</head>
<body>
    <div id="box">
    </div>
    <script>
        function add(a, b) {
            return a + b;
        }
        function subtract(a, b) {
            return a - b;
        }
        function multiply(a, b) {
            return a * b;
        }
        function divide(a, b) {
            return a / b;
        }

        const res = add(3, 5);
        console.log(res);

        const res2 = multiply(2, 4);
        console.log(res2);
    </script>
</body>
</html>
Obviously, the two functions of subtract and divide in js are not used, and a and. In css The box style is not used.
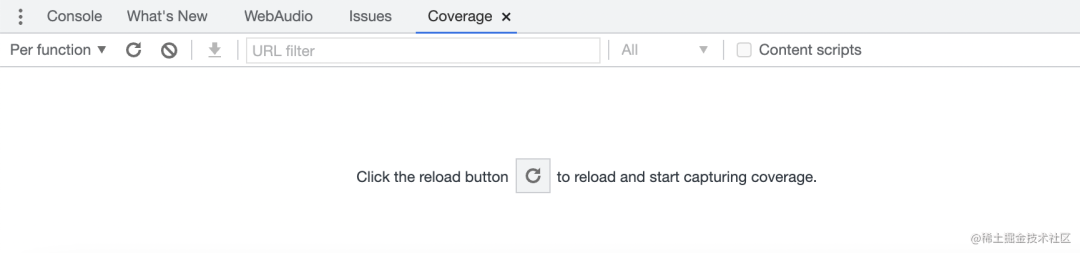
We use the Coverage tool to analyze:
Click the reload button
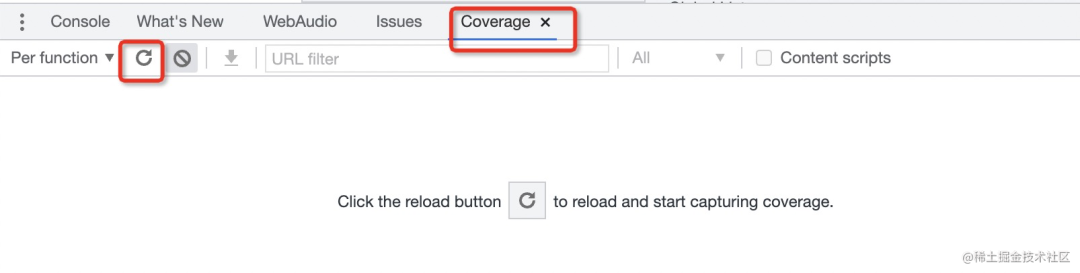
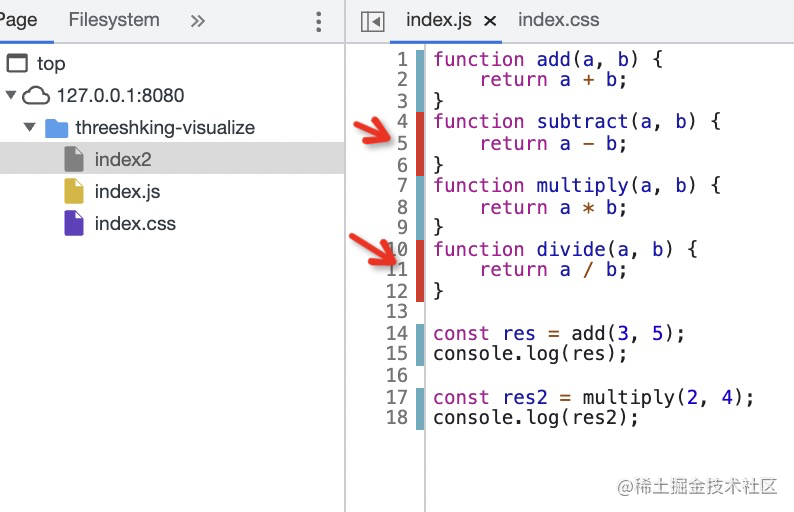
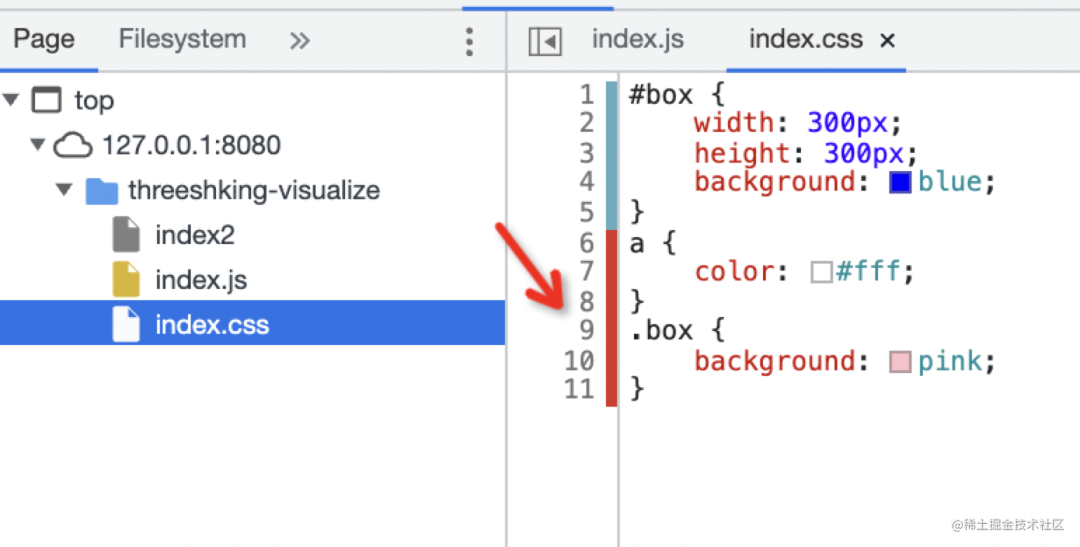
The page will reload and record the code usage. Blue is used and red is unused.
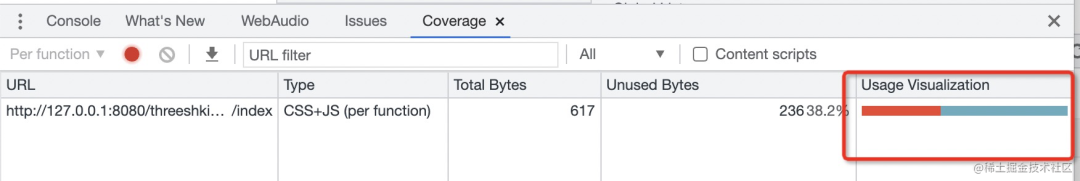
Click to open the Sources panel to display details:
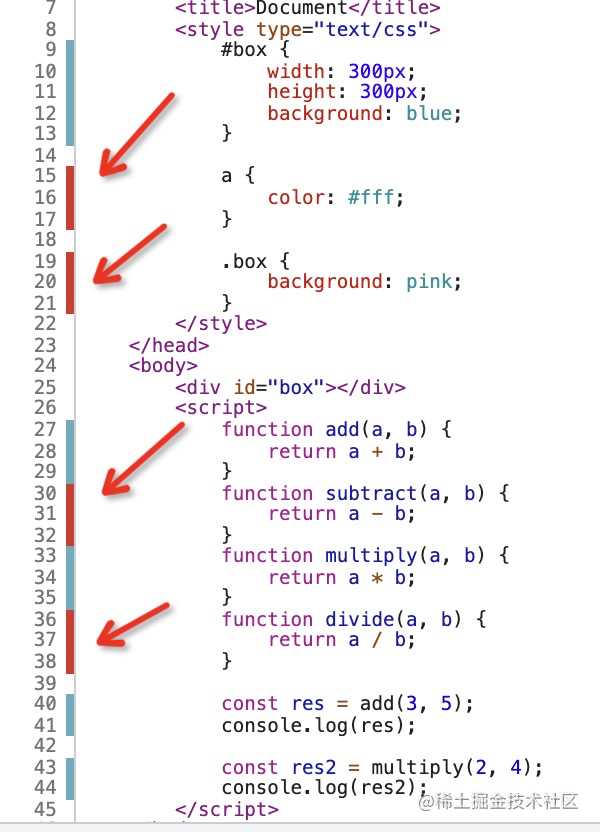
As we can see, as we analyzed, the unused code of js and css has been analyzed.
With the optimization goal, the next optimization is very targeted.
We will do these optimizations:
- Delete from the source code (if the code is really useless)
- Delete it from the product with the treeshking function of webpack, purgecss or other tools (if it is not used in this page)
- Use the code splitting of webpack or other tools for lazy loading (if it is not available temporarily, it may be used later)
The goal of these optimization is to delete or lazy load the analyzed code. The optimization is very targeted, and the optimization effect can be seen intuitively after optimization.
Summary: for the performance optimization of resource loading, you can use the Coverage tool to record the code usage, analyze the unused code, and use treeshking, lazy loading and other methods to optimize it.
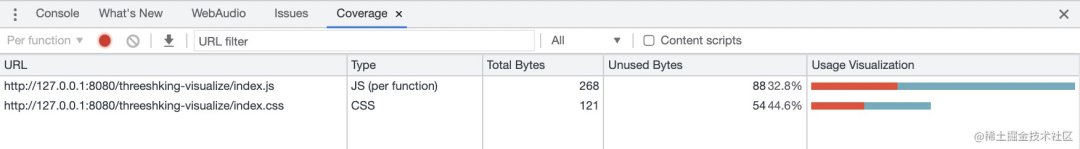
In general, multiple files are introduced into web pages, and the analysis of code usage of each file is the same.
For example, in such an html, two external css and js files are introduced
<!DOCTYPE html>
<html lang="en">
<head>
    <meta charset="UTF-8">
    <link rel="stylesheet" type="text/css" href="index.css" />
</head>
<body>
    <div id="box">
    </div>
    <script src="index.js"></script>
</body>
</html>
js:
function add(a, b) {
    return a + b;
}
function subtract(a, b) {
    return a - b;
}
function multiply(a, b) {
    return a * b;
}
function divide(a, b) {
    return a / b;
}

const res = add(3, 5);
console.log(res);

const res2 = multiply(2, 4);
console.log(res2);
css:
#box {
    width: 300px;
    height: 300px;
    background: blue;
}
a {
    color: #fff;
}
.box {
    background: pink;
}
It can also be analyzed:
summary
Performance optimization is divided into code running performance optimization and resource loading performance optimization.
The Performance optimization of code operation will record time-consuming data with Performance tools, which can be visually analyzed and then targeted optimization.
Similarly, for the performance optimization of resource loading, the Coverage tool can be used to record the code usage, visually mark the unused code, and then targeted optimization can be carried out, such as lazy loading by treeshaking or code splitting.
In short, stop doing treeshaking and other performance optimization in the dark. Learn to use Coverage tools. What to optimize and how the optimization effect is at a glance!