catalogue
- 🌲 preface 🌲
- I ⭐ Host level ⭐ ️
- II 💫 Database level 💫
- 1, 🍔 View database instances and listen
- 2, 🍖 Database tablespace usage
- 3, 🍢 Check RMAN backup
- 4, 🍡 Check control file redundancy
- 5, 🍭 Check parameter file
- 6, 🍬 Are archiving and flashback enabled
- 7, 🍗 Check the online log and switching frequency
- 8, 🍕 View database character set
- 9, 🍯 Check for invalid objects
- 10, 🍋 Check partition table object
- III ❄️ Reporting level ❄️
- ⚡ Write at the end ⚡ ️
🌲 preface 🌲
If you are given a new Oracle stand-alone database environment, what do you need to pay attention to as a DBA? This article only discusses Linux hosts~
📢 First of all, it is not a standard answer, but some personal opinions. Welcome 👏🏻 We need to improve~
First, of course, confirm whether it is a stand-alone or cluster database! This article mainly explains stand-alone database.
I ⭐ Host level ⭐ ️
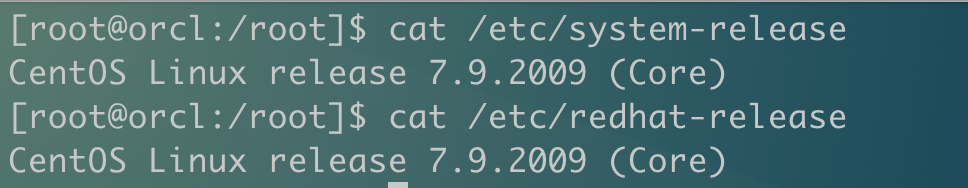
1, 📚 Host version and Oracle version
Host version:
cat /etc/system-release
cat /etc/redhat-release
Oracle version and patch version:
sqlplus -version
opatch lspatches

2, 💻 Host hardware resources
Including CPU load, physical memory and disk usage.
CPU load and memory:
top
free -m
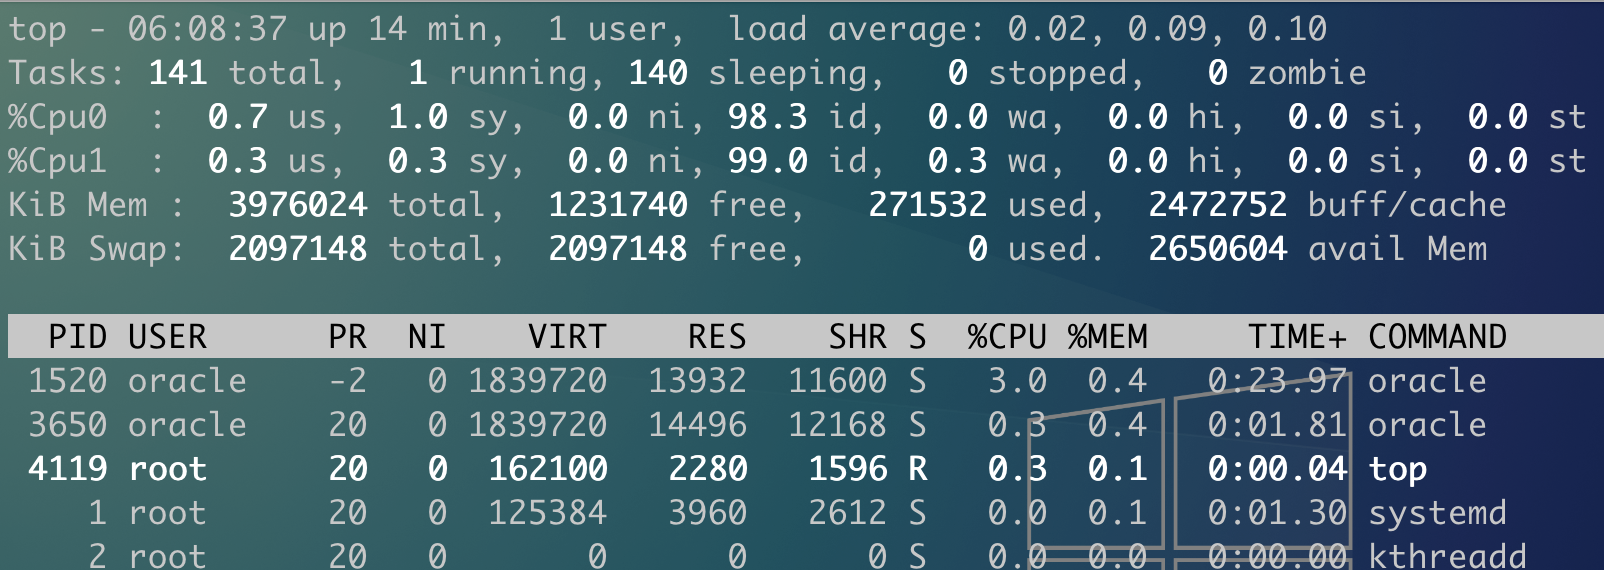
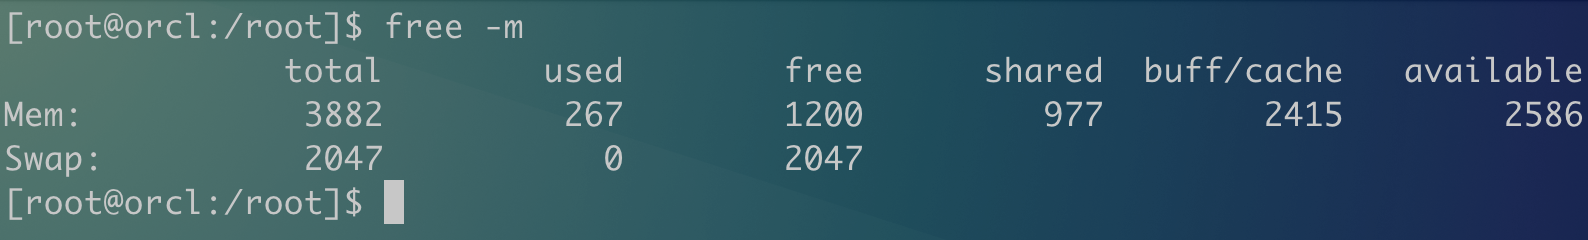
⚠️ Pay attention to whether the CPU load and physical memory usage of the host are abnormal, and whether Swap is used too much.
Disk usage:
lsblk
fdisk -l
df -Th

⚠️ Obviously, we need to pay attention to the disk usage and whether the utilization rate is too high.
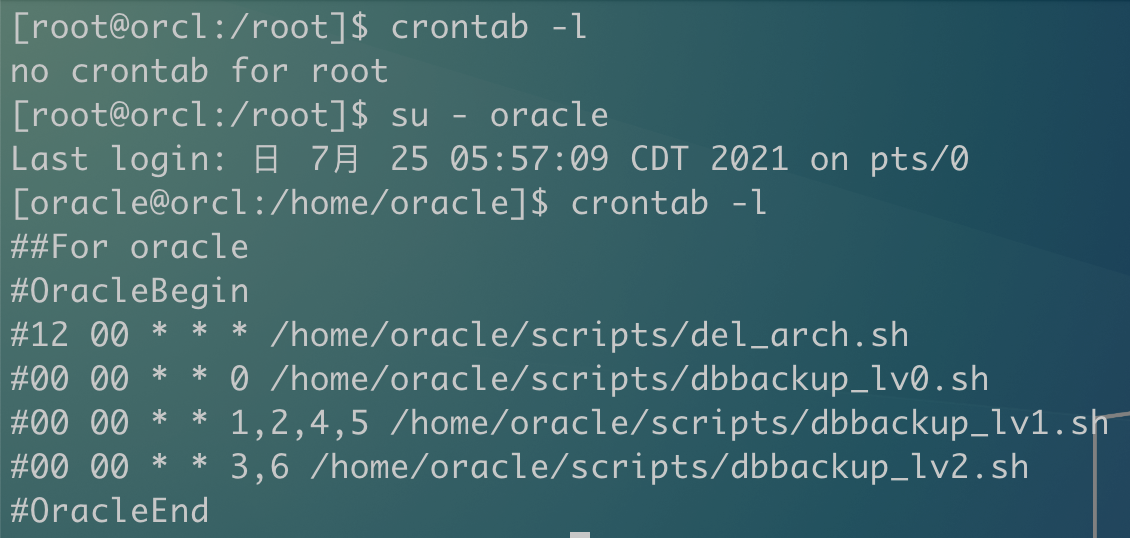
3, 📒 Schedule task crontab
Some backup strategies or archive deletion strategies will be arranged for general planning tasks. We can view them through crontab:
crontab -l
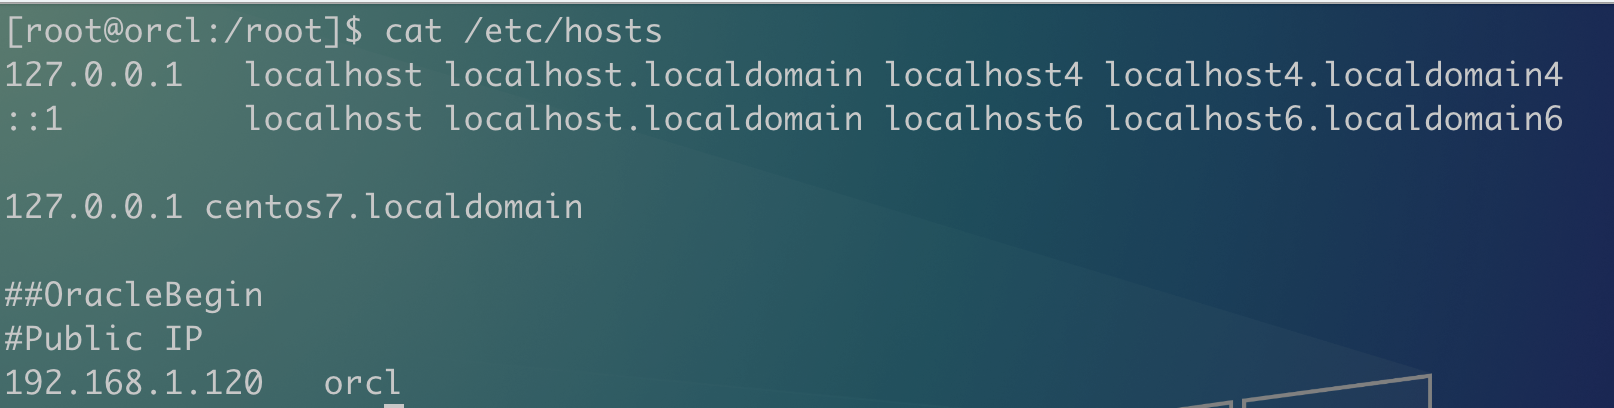
4, 🌿 Check the Hosts file and network configuration
cat /etc/hosts
ip addr
nmcli connection show

5, 🍄 Check the system parameter file
cat /etc/sysctl.conf
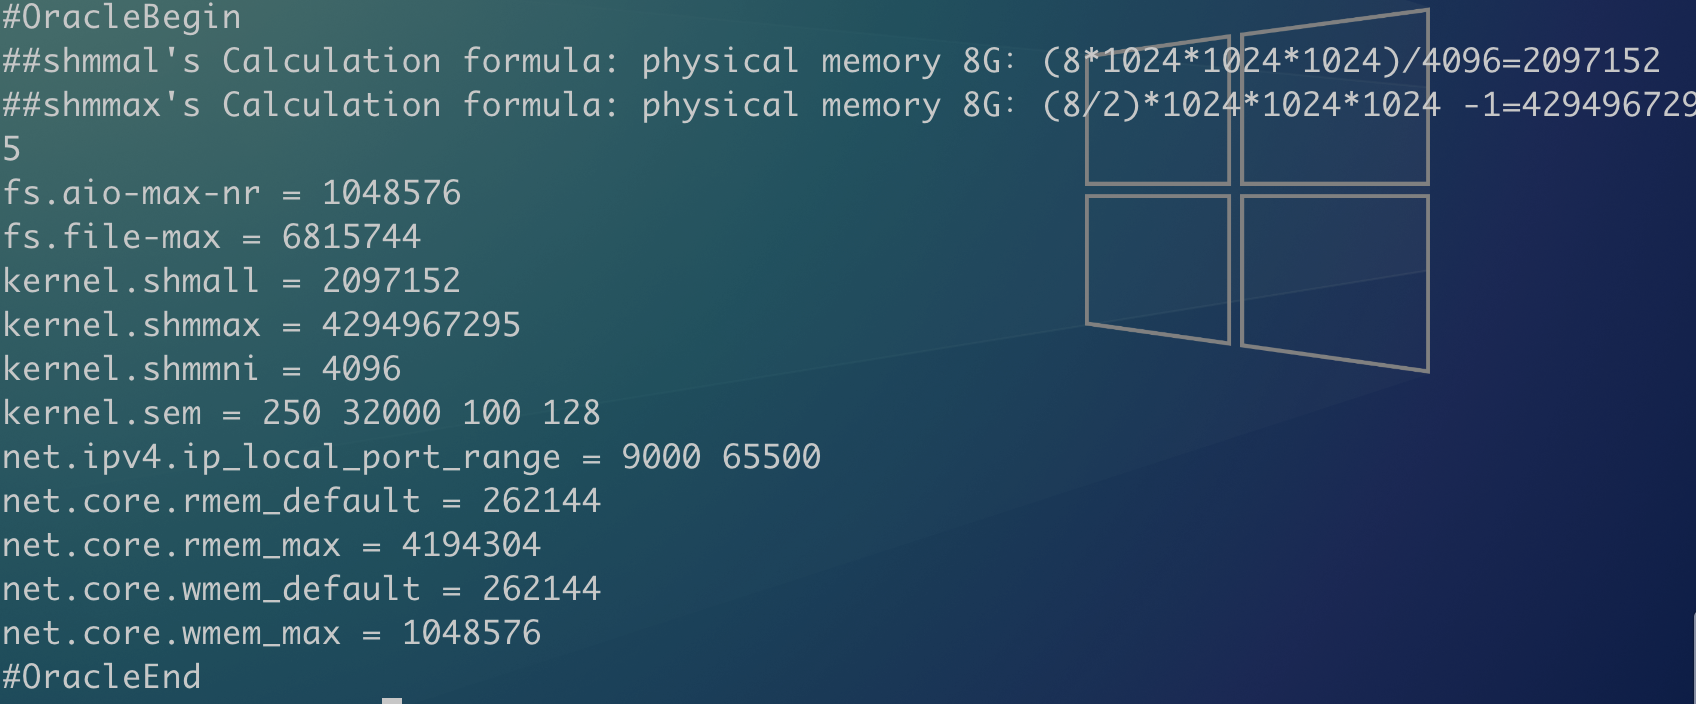
⚠️ Pay attention to whether unconventional parameters are set.
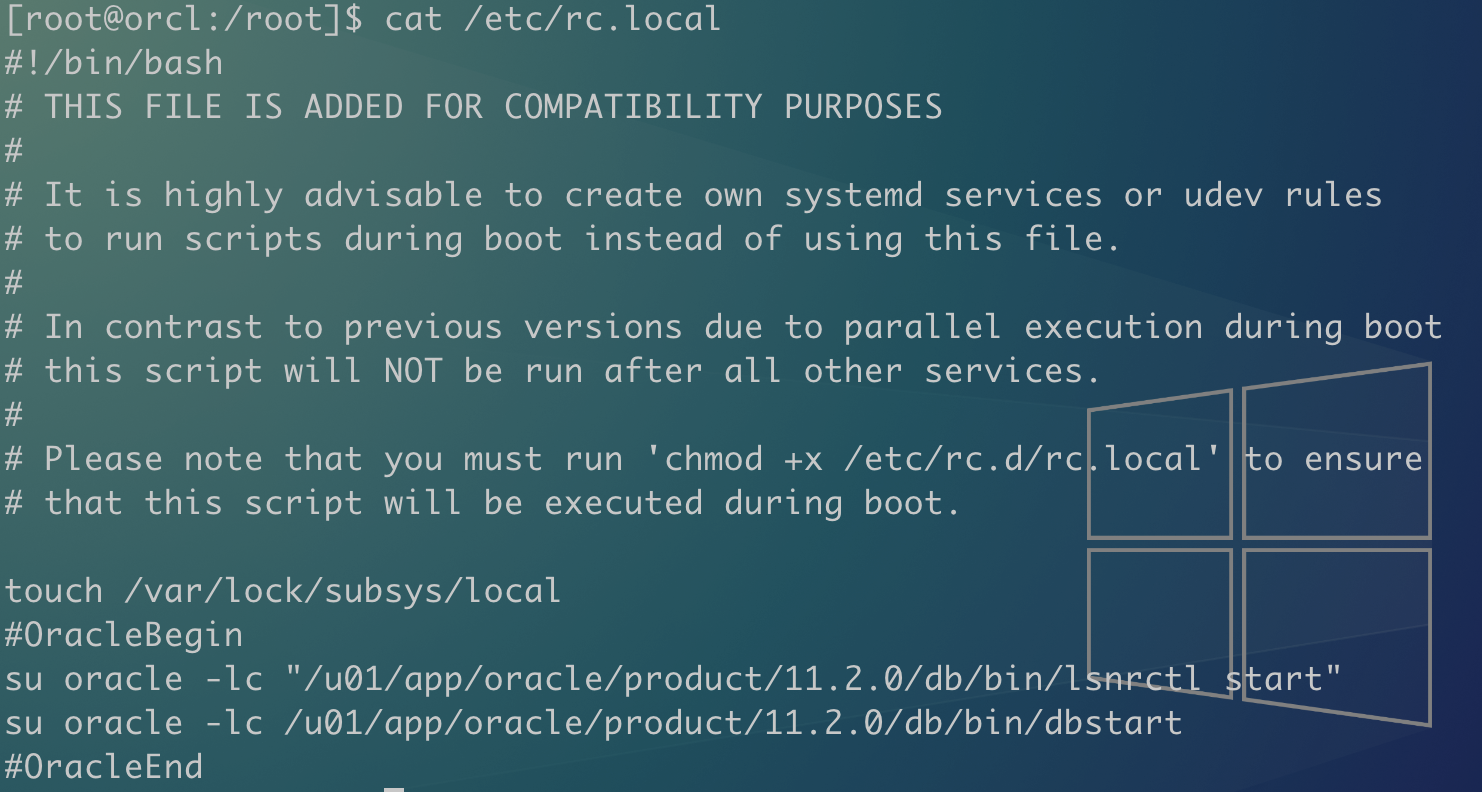
6, 🌻 Check RC Local file
rc. The local file is used to configure the startup self startup script. Generally, it will be set to close the transparent large page or the startup self startup of Oracle database.
cat /etc/rc.local
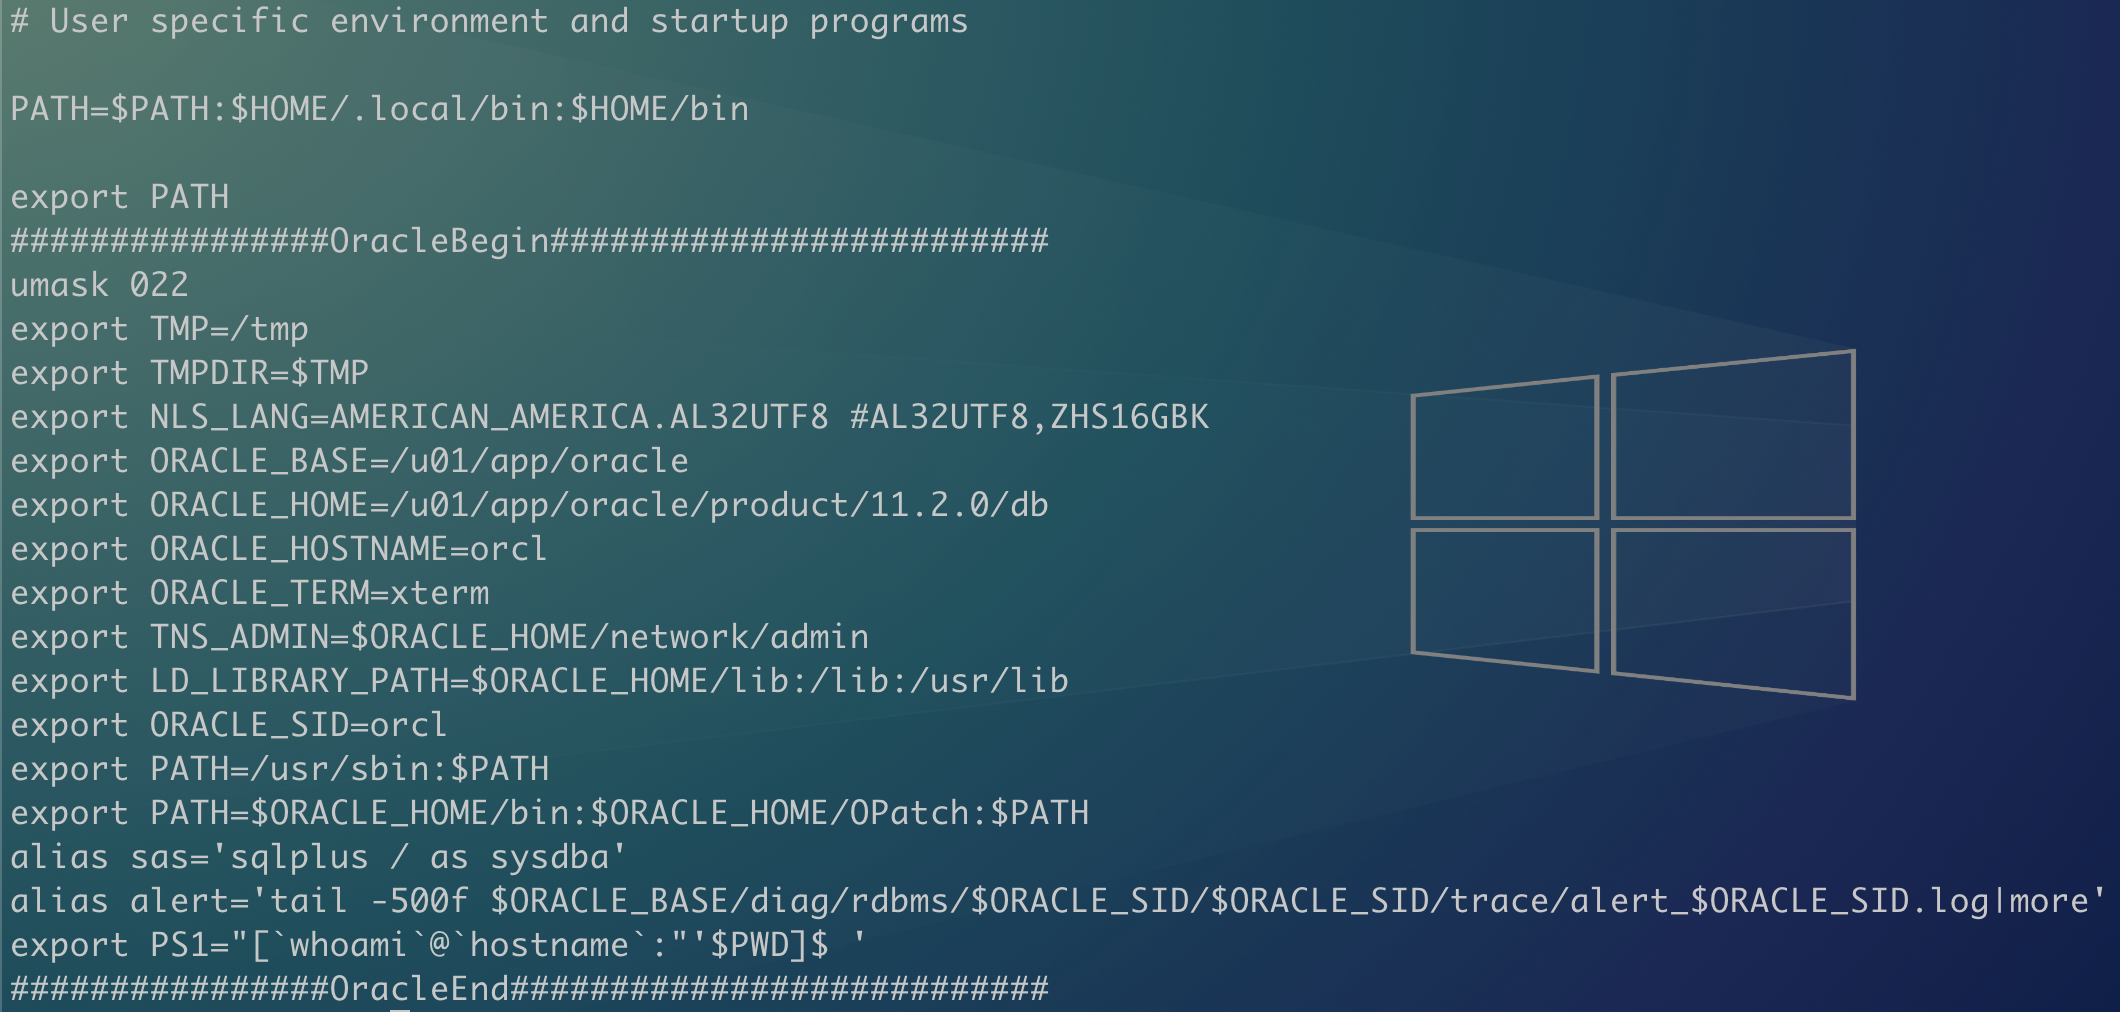
7, 🍁 Environment variable configuration
View the environment variable configuration to get more familiar with the environment.
cat ~/.bash_profile
cat /home/oracle/.bash_profile

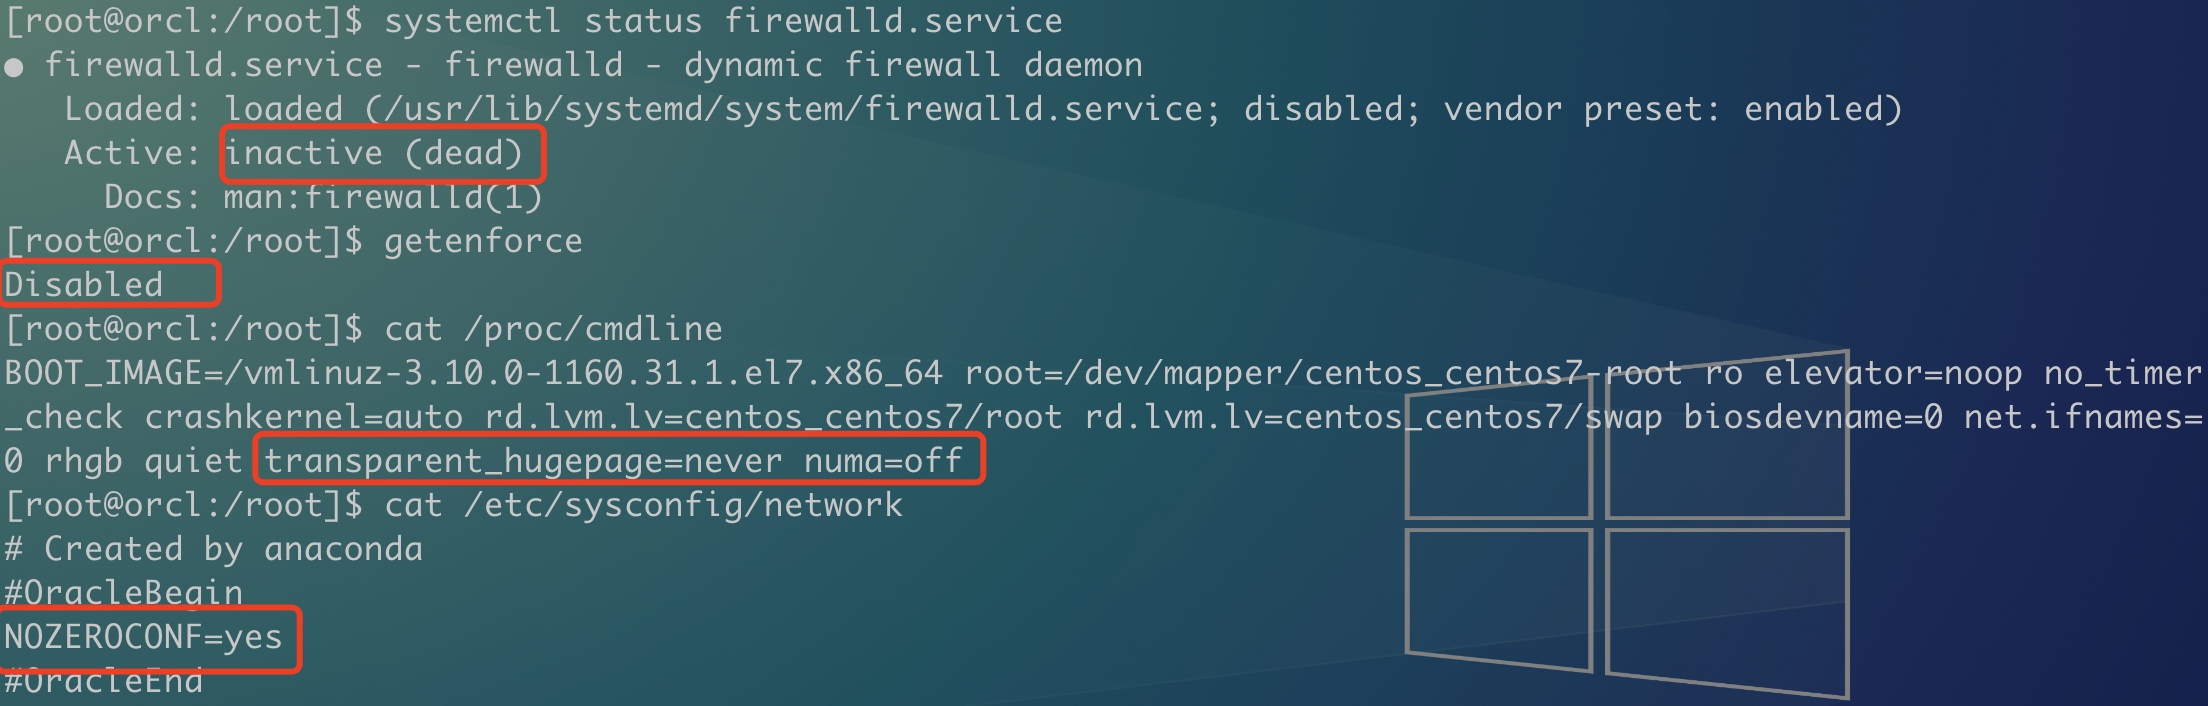
8, 🌵 Check system service
systemctl status firewalld.service
getenforce
cat /proc/cmdline
cat /etc/sysconfig/network
II 💫 Database level 💫
1, 🍔 View database instances and listen
ps -ef|grep smon
su - oracle
lsnrctl status


2, 🍖 Database tablespace usage
sqlplus / as sysdba
col TABLESPACE_NAME for a20
select tbs_used_info.tablespace_name,
       tbs_used_info.alloc_mb,
       tbs_used_info.used_mb,
       tbs_used_info.max_mb,
       tbs_used_info.free_of_max_mb,
       tbs_used_info.used_of_max || '%' used_of_max_pct
  from (select a.tablespace_name,
               round(a.bytes_alloc / 1024 / 1024) alloc_mb,
               round((a.bytes_alloc - nvl(b.bytes_free,
                                          0)) / 1024 / 1024) used_mb,
               round((a.bytes_alloc - nvl(b.bytes_free,
                                          0)) * 100 / a.maxbytes) used_of_max,
               round((a.maxbytes - a.bytes_alloc + nvl(b.bytes_free,
                                                       0)) / 1048576) free_of_max_mb,
               round(a.maxbytes / 1048576) max_mb
          from (select f.tablespace_name,
                       sum(f.bytes) bytes_alloc,
                       sum(decode(f.autoextensible,
                                  'YES',
                                  f.maxbytes,
                                  'NO',
                                  f.bytes)) maxbytes
                  from dba_data_files f
                 group by tablespace_name) a,
               (select f.tablespace_name,
                       sum(f.bytes) bytes_free
                  from dba_free_space f
                 group by tablespace_name) b
         where a.tablespace_name = b.tablespace_name(+)) tbs_used_info
 order by tbs_used_info.used_of_max desc;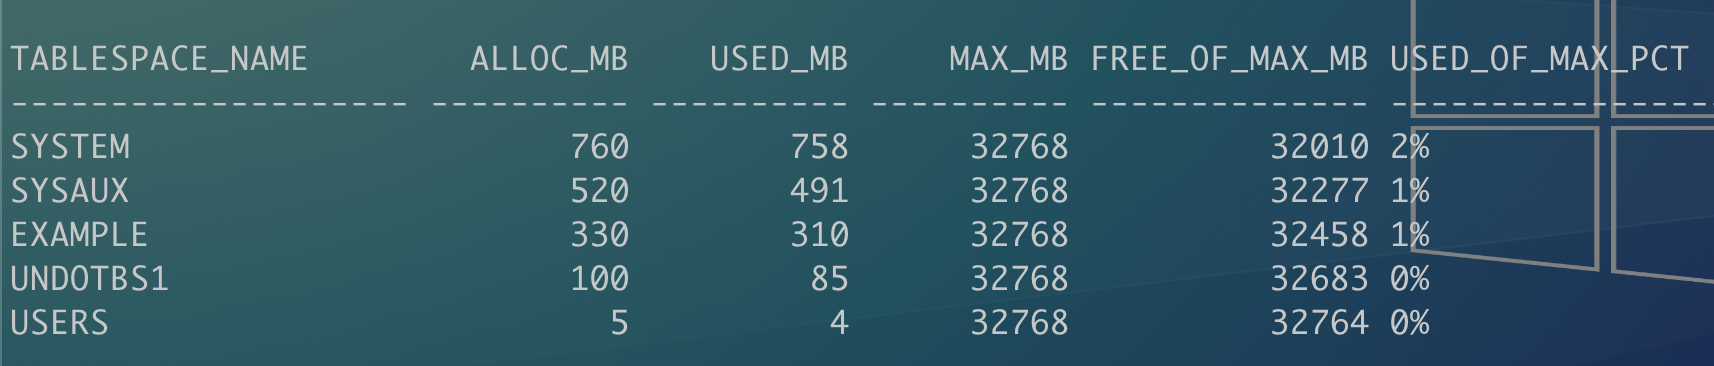
3, 🍢 Check RMAN backup
rman target /
list backup;

sqlplus / as sysdba
col status for a10
col input_type for a20
col INPUT_BYTES_DISPLAY for a10
col OUTPUT_BYTES_DISPLAY for a10
col TIME_TAKEN_DISPLAY for a10

select input_type,
       status,
       to_char(start_time,
               'yyyy-mm-dd hh24:mi:ss'),
       to_char(end_time,
               'yyyy-mm-dd hh24:mi:ss'),
       input_bytes_display,
       output_bytes_display,
       time_taken_display,
       COMPRESSION_RATIO
  from v$rman_backup_job_details
 where start_time > date '2021-07-01'
 order by 3 desc;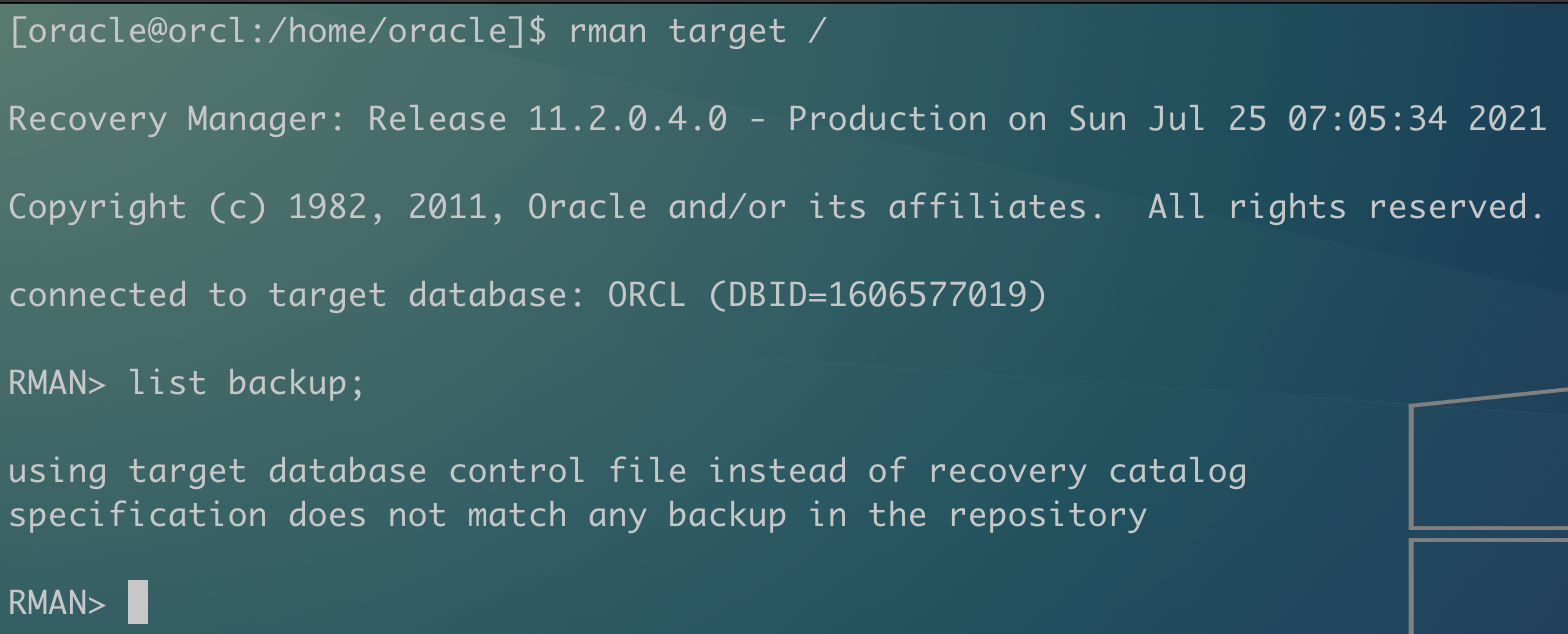
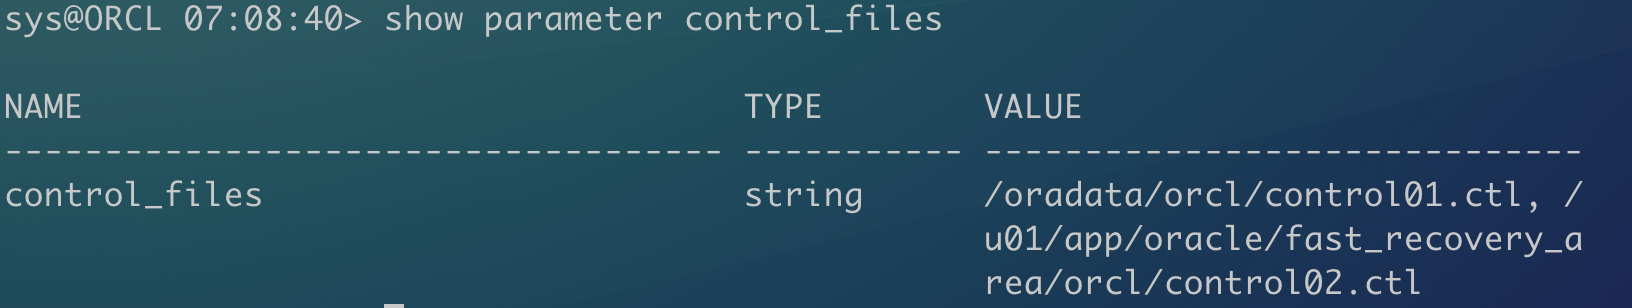
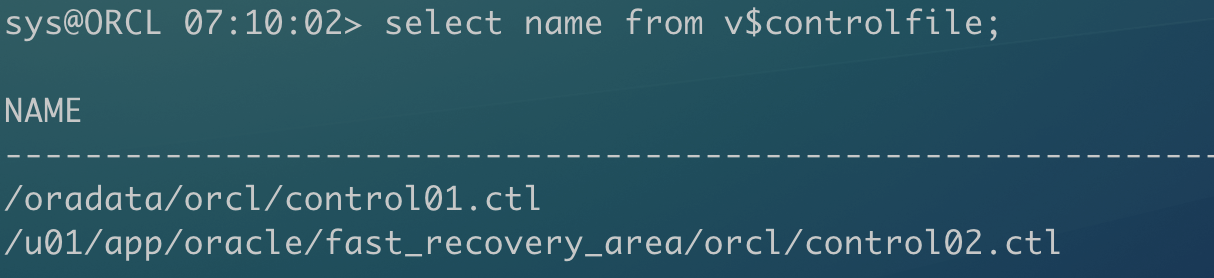
4, 🍡 Check control file redundancy
Check the number and location of control files and whether they are in multiple redundancy status.
sqlplus / as sysdba
show parameter control_files
select name from v$controlfile;
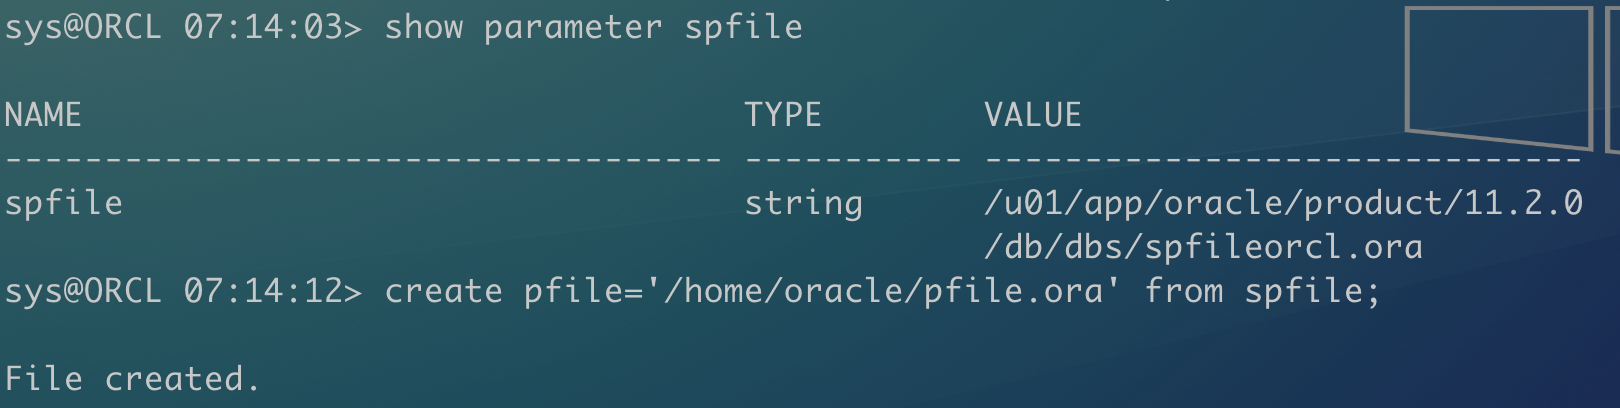
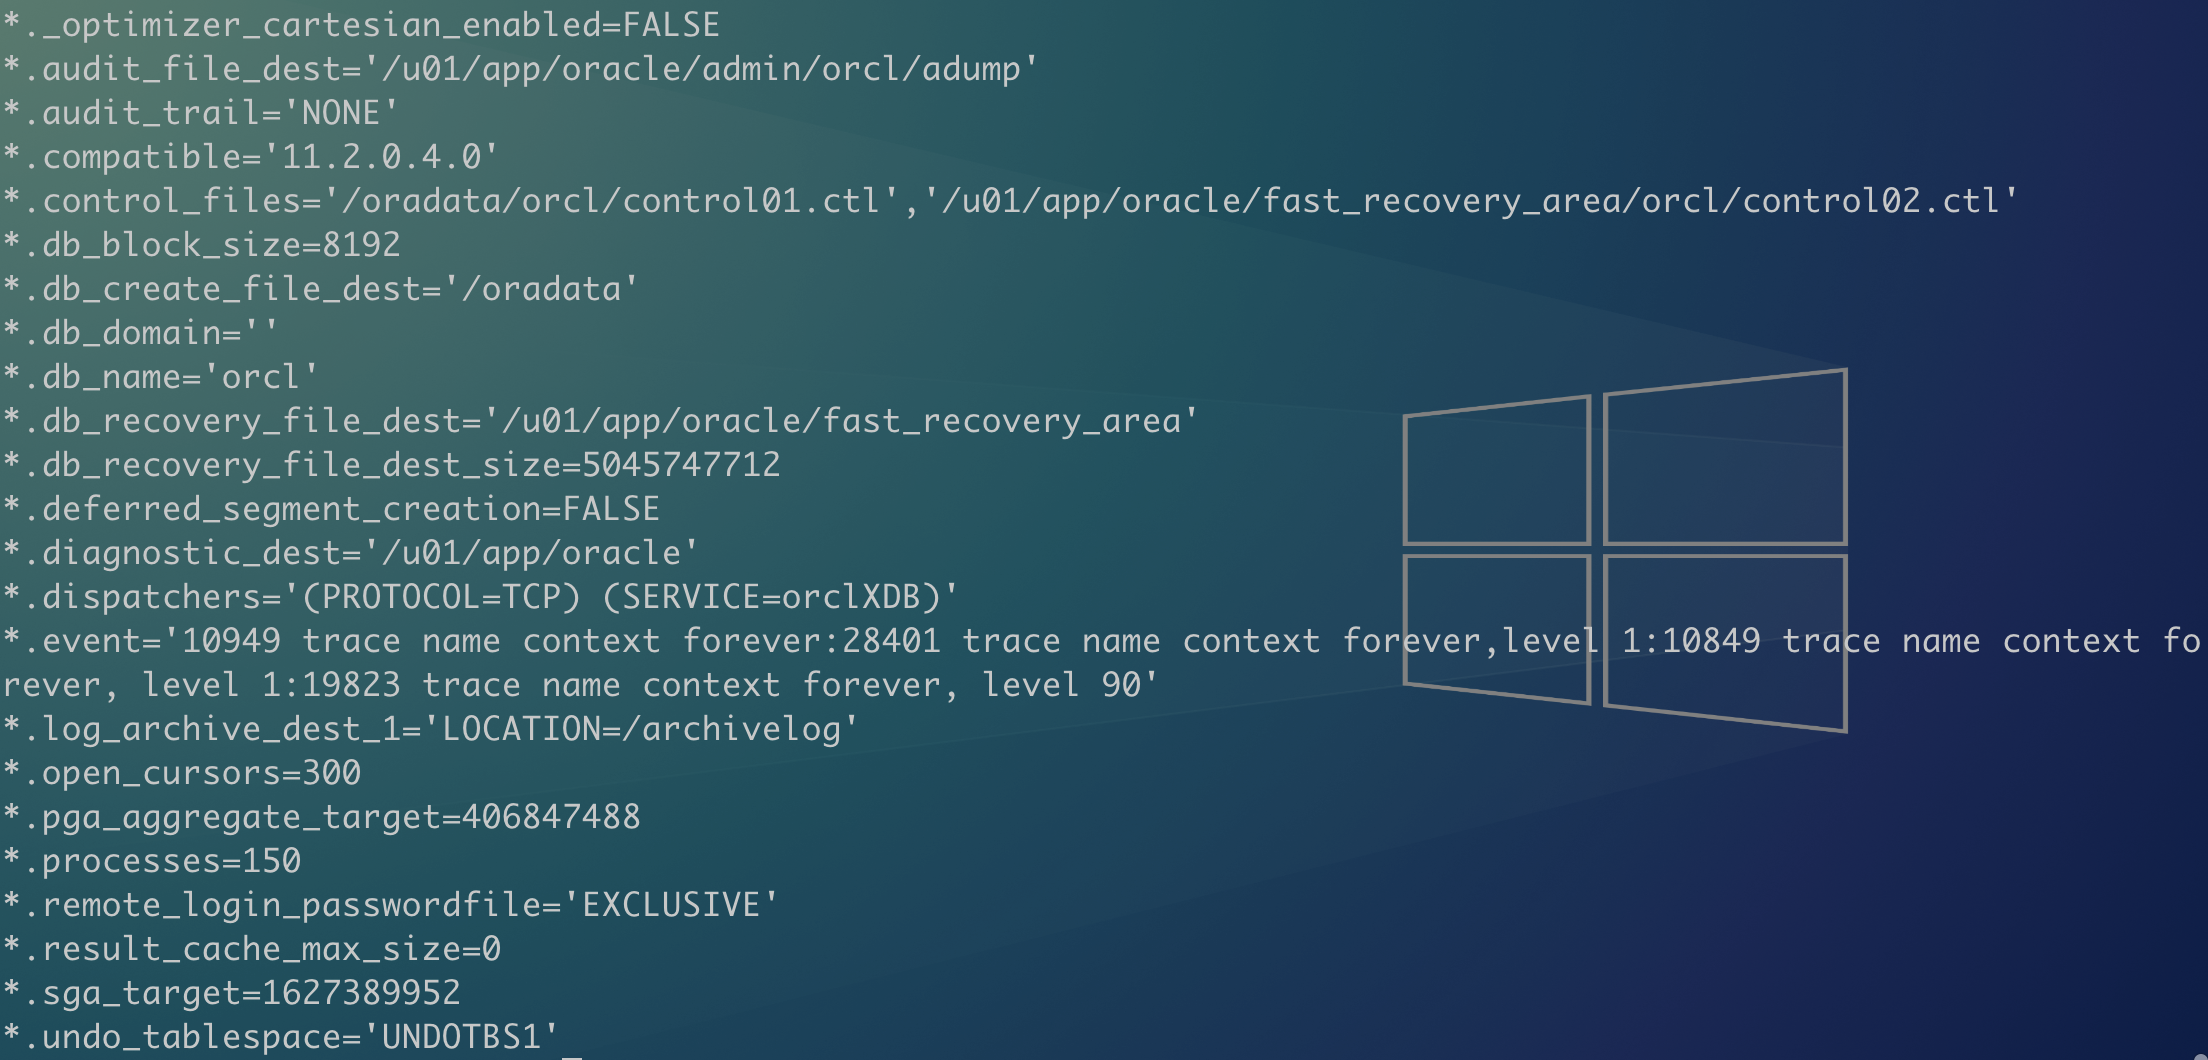
5, 🍭 Check parameter file
View the database parameter file and check whether the parameters are used normally.
sqlplus / as sysdba
show parameter spfile
create pfile='/home/oracle/pfile.ora' from spfile;

strings /home/oracle/pfile.ora
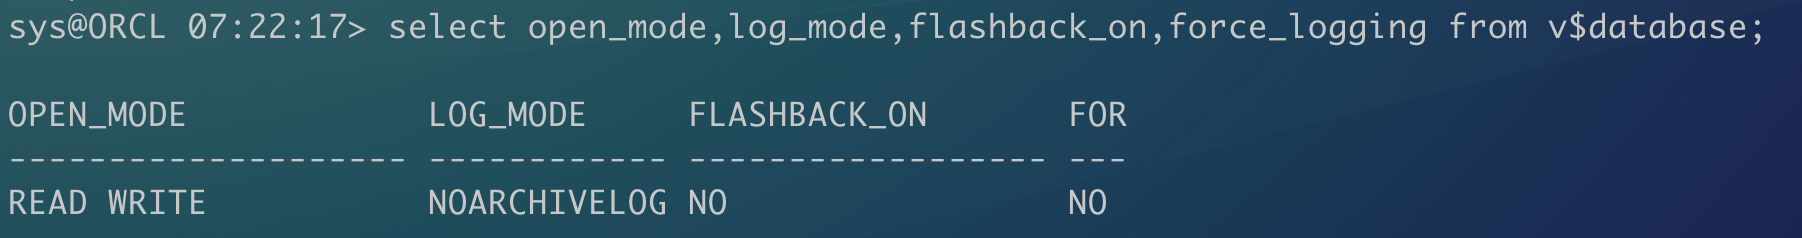
6, 🍬 Are archiving and flashback enabled
sqlplus / as sysdba
archive log list
select open_mode,log_mode,flashback_on,force_logging from v$database;
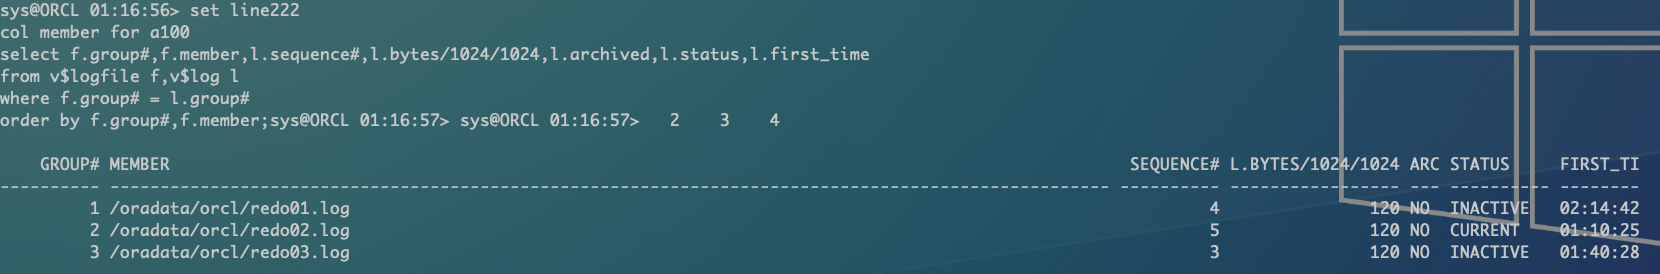
7, 🍗 Check the online log and switching frequency
View online log size:
set line222
col member for a100
select f.group#,f.member,l.sequence#,l.bytes/1024/1024,l.archived,l.status,l.first_time
from v$logfile f,v$log l
where f.group# = l.group#
order by f.group#,f.member;
View online log switching frequency:
col day for a30
SELECT
  SUBSTR(TO_CHAR(first_time, 'MM/DD/RR HH:MI:SS'),1,5)  DAY,
  SUM(DECODE(SUBSTR(TO_CHAR(first_time, 'MM/DD/RR HH24:MI:SS'),10,2),'00',1,0)) H00,
  SUM(DECODE(SUBSTR(TO_CHAR(first_time, 'MM/DD/RR HH24:MI:SS'),10,2),'01',1,0)) H01,
  SUM(DECODE(SUBSTR(TO_CHAR(first_time, 'MM/DD/RR HH24:MI:SS'),10,2),'02',1,0)) H02,
  SUM(DECODE(SUBSTR(TO_CHAR(first_time, 'MM/DD/RR HH24:MI:SS'),10,2),'03',1,0)) H03,
  SUM(DECODE(SUBSTR(TO_CHAR(first_time, 'MM/DD/RR HH24:MI:SS'),10,2),'04',1,0)) H04,
  SUM(DECODE(SUBSTR(TO_CHAR(first_time, 'MM/DD/RR HH24:MI:SS'),10,2),'05',1,0)) H05,
  SUM(DECODE(SUBSTR(TO_CHAR(first_time, 'MM/DD/RR HH24:MI:SS'),10,2),'06',1,0)) H06,
  SUM(DECODE(SUBSTR(TO_CHAR(first_time, 'MM/DD/RR HH24:MI:SS'),10,2),'07',1,0)) H07,
  SUM(DECODE(SUBSTR(TO_CHAR(first_time, 'MM/DD/RR HH24:MI:SS'),10,2),'08',1,0)) H08,
  SUM(DECODE(SUBSTR(TO_CHAR(first_time, 'MM/DD/RR HH24:MI:SS'),10,2),'09',1,0)) H09,
  SUM(DECODE(SUBSTR(TO_CHAR(first_time, 'MM/DD/RR HH24:MI:SS'),10,2),'10',1,0)) H10,
  SUM(DECODE(SUBSTR(TO_CHAR(first_time, 'MM/DD/RR HH24:MI:SS'),10,2),'11',1,0)) H11,
  SUM(DECODE(SUBSTR(TO_CHAR(first_time, 'MM/DD/RR HH24:MI:SS'),10,2),'12',1,0)) H12,
  SUM(DECODE(SUBSTR(TO_CHAR(first_time, 'MM/DD/RR HH24:MI:SS'),10,2),'13',1,0)) H13,
  SUM(DECODE(SUBSTR(TO_CHAR(first_time, 'MM/DD/RR HH24:MI:SS'),10,2),'14',1,0)) H14,
  SUM(DECODE(SUBSTR(TO_CHAR(first_time, 'MM/DD/RR HH24:MI:SS'),10,2),'15',1,0)) H15,
  SUM(DECODE(SUBSTR(TO_CHAR(first_time, 'MM/DD/RR HH24:MI:SS'),10,2),'16',1,0)) H16,
  SUM(DECODE(SUBSTR(TO_CHAR(first_time, 'MM/DD/RR HH24:MI:SS'),10,2),'17',1,0)) H17,
  SUM(DECODE(SUBSTR(TO_CHAR(first_time, 'MM/DD/RR HH24:MI:SS'),10,2),'18',1,0)) H18,
  SUM(DECODE(SUBSTR(TO_CHAR(first_time, 'MM/DD/RR HH24:MI:SS'),10,2),'19',1,0)) H19,
  SUM(DECODE(SUBSTR(TO_CHAR(first_time, 'MM/DD/RR HH24:MI:SS'),10,2),'20',1,0)) H20,
  SUM(DECODE(SUBSTR(TO_CHAR(first_time, 'MM/DD/RR HH24:MI:SS'),10,2),'21',1,0)) H21,
  SUM(DECODE(SUBSTR(TO_CHAR(first_time, 'MM/DD/RR HH24:MI:SS'),10,2),'22',1,0)) H22,
  SUM(DECODE(SUBSTR(TO_CHAR(first_time, 'MM/DD/RR HH24:MI:SS'),10,2),'23',1,0)) H23,
  COUNT(*)                                                                      TOTAL
FROM
  v$log_history  a where SYSDATE - first_time < 35
GROUP BY SUBSTR(TO_CHAR(first_time, 'MM/DD/RR HH:MI:SS'),1,5) order by 1;
8, 🍕 View database character set
select * from nls_database_parameters;

9, 🍯 Check for invalid objects
SELECT owner,object_name,object_type,status
FROM dba_objects
WHERE status <> 'VALID'
ORDER BY owner,object_name;

10, 🍋 Check partition table object
set line222
col high_value for a100
select t2.TABLE_OWNER,t1.table_name, t1.max_partition_name, t2.high_value
  from (select table_name, max(partition_name) as max_partition_name
          from dba_tab_partitions
         group by table_name) t1,
       (select TABLE_OWNER,table_name, partition_name, high_value
          from dba_tab_partitions
         where tablespace_name not in ('SYSAUX', 'SYSTEM')) t2
 where t1.table_name = t2.table_name
   and t1.max_partition_name = t2.partition_name
   order by 1,2;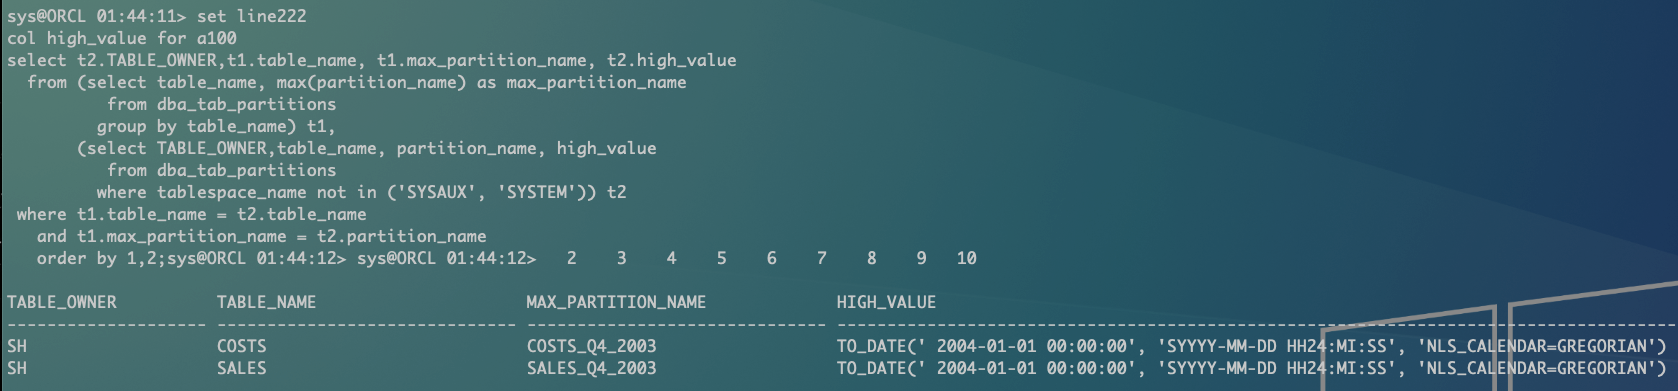
Pay attention to the maximum expansion of the partition. It is recommended to expand the partition in advance to avoid splitting.
III ❄️ Reporting level ❄️
Through the awr, ash, awrsqrpt and other reports provided by Oracle, you can clearly understand the current database situation.
1, 🍉 awr Report
AWR contains the detailed information collection of database operation, which is often used to analyze and collect performance problems.
sqlplus / as sysdba @?/rdbms/admin/awrrpt.sql
The above command can generate AWR report, and you need to fill in the report type, grab time and how to use it. You can also check your official account of the AWR Hawkeye free video tutorial.

2, 🍊 ash Report
ash can capture more detailed information than AWR report, which can be accurate to minutes, and it is also commonly used.
sqlplus / as sysdba @?/rdbms/admin/ashrpt.sql
The above is the generation method, optional time period, and the default is to obtain the report from the current time to 15 minutes ago.
3, 🍒 awrsqrpt Report
It is used to analyze the report when a single SQL has performance problems. You need to know the SQL_ID.
sqlplus / as sysdba @?/rdbms/admin/awrsqrpt.sql
You need to fill in the time period and sql_id to get the relevant sql report.
4, 🍑 sqltrpt Report
It is usually used together with awrsqrpt report to obtain sql optimization suggestions provided by Oracle. Generally speaking, it is recommended to create more indexes and profile s, which is suitable for novices to optimize sql.
sqlplus / as sysdba @?/rdbms/admin/sqltrpt.sql
Only SQL is required_ ID is enough.
5, 🍍 addmrpt Report
addmrpt is a report generated by oracle through automatic diagnosis of awr reports.
sqlplus / as sysdba @?/rdbms/admin/addmrpt.sql
For reference only, real help is not of great significance. The process requires a time period to be entered.
6, 🌽 Health examination report
This kind of health examination report is generally a report generated by individual script execution. The examination results usually contain the above required information according to individual definition. Of course, the Oracle official also provides the report generation method of the complete database. There is no too much introduction here. If you need it, you can contact me for it.
⚡ Write at the end ⚡ ️
Through the above inspections, I believe you have a general understanding of the database system you are new to. Next, you just need to make a slow and in-depth analysis, and then formulate a set of operation and maintenance specifications in line with the actual situation.
ヾ(◍°∇°◍)ノ゙