preface
A few days ago, my classmate Wazi asked me to help with some musical homework, homework content collection network, data volume 1W homework evaluation, and then do some work related to data analysis. Easy cloud homework has Internet bugs and solutions. If you find a big experiment, you still need to hand in the experiment report. Here are some homework and some knowledge points to share. Student's article: Netease cloud music review crawl.
data sources
The first is the data. Netease cloud music reviews are not released from here. They are obtained by calling the API, and the source code is much less. I won't repeat it here.

Analysis process
Time processing
The following code is mainly released by time. It is the data arranged according to the time column. It is processed normally. You also operate things mainly by date and time.
<span style="color:#444444"><span style="background-color:#f6f6f6"><span style="color:#333333"><strong>from</strong></span>pyecharts <span style="color:#333333"><strong>import</strong></span> Line<span style="color:#333333"><strong>Import</strong></span>pandas <span style="color:#333333"><strong>as</strong></span> pd


<span style="color:#888888"># Read data</span>
df = pd.read_csv( <span style="color:#880000">'music_comments.csv'</span> , header= <span style="color:#333333"><strong>None</strong></span> , names=[ <span style="color:#880000">'name'</span> , <span style="color:#880000">'userid'</span> , <span style="color:#880000">'age'</span> , <span style="color:#880000">'gender'</span> , <span style="color:#880000">'city'</span> , <span style="color:#880000">'text'</span> , <span style="color:#880000">'comment'</span> , <span style="color:#880000">'commentid'</span> , <span style="color:#880000">'praise'</span> , <span style="color:#880000">'date'</span> ], encoding= <span style="color:#880000">'utf-8-sig'</span> )
 <span style="color:#888888">#We can see that the comment ID is de duplicated</span>
df = df.drop_duplicates( <span style="color:#880000">'commentid'</span> )
df = df.dropna()
<span style="color:#888888"># Get time</span>
df[ <span style="color:#880000">'time'</span> ] = [int(i.split( <span style="color:#880000">' '</span> )[ <span style="color:#880000">1</span> ].split( <span style="color:#880000">':'</span> )[ <span style="color:#880000">0</span> ]) <span style="color:#333333"><strong>for</strong></span> i <span style="color:#333333"><strong>in</strong></span> df[ <span style="color:#880000">'date'</span> ]]

<span style="color:#888888">#</span>
grouping<span style="color:#888888">Summary</span>date_message = df.groupby([ <span style="color:#880000">'time'</span> ])
date_com = date_message[ <span style="color:#880000">'time'</span> ].agg([ <span style="color:#880000">'count'</span> ])
date_com.reset_index(Local=<span style="color:#333333 "> < strong > true < / strong > < / span >)

<span style="color:#888888"># Draw a chart</span>
attr = date_com[ <span style="color:#880000 "> 'time' < / span >]
v1 = date_com[ <span style="color:#880000">'count'</span> ]
line = Line( <span style="color:#880000">"After the song was copied-Comment time</span>distribute<span style="color:#880000">"</span> , title_pos= <span style="color:#880000">'center'</span> , title_top= <span style="color:#880000">'18'</span> , width= <span style="color:#880000">800</span> , height= <span style="color:#880000">400</span> )
line.add( <span style="color:#880000">""</span> , attr, v1, is_smooth= <span style="color:#333333"><strong>True</strong></span> , is_fill= <span style="color:#333333"><strong>True</strong></span> , area_color= <span style="color:#880000">"#000"</span> , is_xaxislabel_align= <span style="color:#333333"><strong>True</strong></span> , xaxis_min= <span style="color:#880000">"dataMin"</span> , area_opacity= <span style="color:#880000">0.3</span> , mark_point=[ <span style="color:#880000">"max"</span> ], mark_point_symbol= <span style="color:#880000">""Pin"</span>,mark_point_symbolsize= <span style="color:#880000">55</span>)
line.render( <span style="color:#After 880000 ">" songs were copied - time distribution of comments html"</span> )</span></span>
After running, the effect diagram is as follows:

You can see that partners like to comment in the afternoon and in the evening.
Number of user comments
The code and the above data need to be changed, just.
<span style="color:#444444"><span style="background-color:#f6f6f6"><span style="color:#333333"><strong>take</strong></span>panda<span style="color:#333333"><strong>Import</strong></span><span style="color:#333333 "> < strong > is < / strong > < / span > PD

<span style="color:#888888"># Read data</span>
df = pd.read_csv( <span style="color:#880000">'music_comments.csv'</span> , header= <span style="color:#333333"><strong>None</strong></span> , names=[ <span style="color:#880000">'name'</span> , <span style="color:#880000">'userid'</span> , <span style="color:#880000">'age'</span> , <span style="color:#880000">'gender'</span> , <span style="color:#880000">'city'</span> , <span style="color:#880000">'text'</span> , <span style="color:#880000">'comment'</span> , <span style="color:#880000">'commentid'</span> , <span style="color:#880000">'praise'</span> , <span style="color:#880000">'date'</span> ], encoding= <span style="color:#880000">'utf-8-sig'</span> )
 <span style="color:#888888">#We can see that the comment ID is de duplicated</span>
df = df.drop_duplicates( <span style="color:#880000">'commentid'</span> )
df = df.dropna()
<span style="color:#888888">#</span>
grouping<span style="color:#888888">Summary</span>user_message = df.groupby([ <span style="color:#880000">'userid'</span> ])
user_com = user_message[ <span style="color:#880000">'userid'</span> ].agg([ <span style="color:#880000">'count'</span> ])
user_com.reset_index(Local=<span style="color:#333333 "> < strong > true < / strong > < / span >)
user_com_last = user_com.sort_values(<span style="color:#880000">'count'</span>,Ascending order=<span style="color:#333333"><strong>false</strong></span>)[ <span style="color:#880000">0</span>: <span style="color:#880000">10</span> ]
Print( user_com_last)</span></span>
After running, the results are as follows:

You can see loyal fans, crazy fans, hundreds of data comments, such as terror.
Comment cloud
Word cloud is a cliche. It is often done. Just apply the template and change the base map. The code is as follows:
<span style="color:#444444"><span style="background-color:#f6f6f6"><span style="color:#333333"><strong>from</strong></span> wordcloud <span style="color:#333333"><strong>import</strong></span> WordCloud
 <span style="color:#333333"><strong>import</strong></span> matplotlib.pyplot <span style="color:#333333"><strong>as</strong></span> plt
 <span style="color:#333333"><strong>import</strong></span> pandas <span style="color:#333333"><strong>as</strong></span> pd
 <span style="color:#333333"><strong>import</strong></span> random
 <span style="color:#333333"><strong>import</strong></span> jieba


<span style="color:#888888"># Set text</span>
<span style="color:#880000"><strong>at any time</strong></span><span style="color:#888888">colour</span><span style="color:#333333"><strong>def </strong></span> <span style="color:#880000"><strong>random_color_func </strong></span>(word=None, font_size=None, position=None,orientation=None, font_path=None, random_state=None) :
    h, s, l = random.choice([( <span style="color:#880000">188</span> , <span style="color:#880000">72</span> , <span style="color:#880000">53</span> ), ( <span style="color:#880000">253</span> , <span style="color:#880000">63</span> , <span style="color:#880000">56</span> ), ( <span style="color:#880000">12</span> , <span style="color:#880000">78</span> , <span style="color:#880000">69</span> )])
    <span style="color:#333333"><strong>return</strong></span> <span style="color:#880000">"hsl({}, {}%, {}%)"</span> .format(h, s, l)


<span style="color:#888888"># Read information</span>
df = pd.read_csv( <span style="color:#880000">'music_comments.csv'</span> , header= <span style="color:#333333"><strong>None</strong></span> , names=[ <span style="color:#880000">'name'</span> , <span style="color:#880000">'userid'</span> , <span style="color:#880000">'age'</span> , <span style="color:#880000">'gender'</span> , <span style="color:#880000">'city'</span> , <span style="color:#880000">'text'</span> , <span style="color:#880000">'comment'</span> , <span style="color:#880000">'commentid'</span> , <span style="color:#880000">'praise'</span> , <span style="color:#880000">'date'</span> ], encoding= <span style="color:#880000">'utf-8-sig'</span> )
 <span style="color:#888888">#We can see that the comment ID is de duplicated</span>
df = df.drop_duplicates( <span style="color:#880000">'commentid'</span> )
df = df.dropna()
words = pd.read_csv( <span style="color:#880000">'chineseStopWords.txt'</span> , encoding= <span style="color:#880000">'gbk'</span> , sep= <span style="color:#880000">'\t'</span> , names=[ <span style="color:#880000">'stopword'</span> ])
 <span style="color:#888888"># Participle</span>
text = <span style="color:#880000">'' </span>
<span style="color:#333333"><strong>for</strong></span> line <span style="color:#333333"><strong>in</strong></span> df[ <span style="color:#880000">'comment'</span> ]:
    text += <span style="color:#880000">' '</span> join(jieba.cut(str(line, cut_all= <span style="color:#333333"><strong>False</strong></span> ))
 <span style="color:#888888"># Use the word stopwords</span>
= set( <span style="color:#880000">''</span> )
stopwords.update(words[ <span style="color:#880000">'stopword'</span> ])
backgroud_Image = plt.imread( <span style="color:#880000">'music.jpg'</span> )

wc = Ci Yun(
    background<span style="color:#880000">colour</span>= <span style="color:#880000 ">" white "< / span >,
    Mask=Background image,
    font_path= <span style="color:#880000">'FZSTK.TTF'</span> ,
    Maximum number of words= <span style="color:#880000">2000</span> ,
    Maximum font size= <span style="color:#880000">250</span> ,
    min_font_size= <span style="color:#880000">15</span> ,
    color_func=random_color_func,
    Preferred level= <span style="color:#880000">1</span> ,
    Random state= <span style="color:#880000">50</span> ,
    Stop words=Stop words
)

wc.generate_from_text((text)
<span style="color:#888888">#img_colors = ImageColorGenerator(backgroud_Image) </span>
<span style="color:#888888">#Look at those with high word frequency</span>
process_word = WordCloud.process_text(wc,(text)
sort = sorted(process_word.items(), key= <span style="color:#333333"><strong>lambda</strong></span> e: e[ <span style="color:#880000">1</span> ], reverse= <span style="color:#333333"><strong>True</strong></span> )
Print (sort)[: <span style="color:#880000">50</span> ])
plt.imshow(wc)
plt.axis( <span style="color:#880000 "> 'off' < / span >)
wc.to_file( <span style="color:#880000 ">" Netease cloud music review cloud jpg"</span> )
print( <span style="color:#880000 "> 'successfully generated word cloud' < / span >)</span></span>
Finally, the generated word cloud is as follows:

User age
The code and the above data need to be changed. Only the renderings are directly displayed here, as shown in the following figure:

There are still many young fans!
Regional distribution
This code involves some complex situations, and finally involves the map. The code is as follows:
<span style="color:#444444"><span style="background-color:#f6f6f6"><span style="color:#333333"><strong>Import</strong></span>panda<span style="color:#333333 "> < strong > as < / strong > < / span > PD
<span style="color:#333333"><strong>from</strong></span>pyecharts<span style="color:#333333 "> < strong > Import < / strong > < / span > map


<span style="color:#333333"><strong>def </strong></span> <span style="color:#880000"><strong>city_group </strong></span>(cityCode) :
    <span style="color:#880000">"""
    City Code
    """</span>
    City Map = {
        <span style="color:#880000">'11'</span> : <span style="color:#880000 "> 'Beijing' < / span >,
         <span style="color:#880000">'12'</span> : <span style="color:#880000 "> 'Tianjin' < / span >,
         <span style="color:#880000">'31'</span> : <span style="color:#880000 "> 'Shanghai' < / span >,
         <span style="color:#880000">'50'</span> : <span style="color:#880000 "> 'Chongqing' < / span >,
         <span style="color:#880000">'5e'</span> : <span style="color:#880000 "> 'Chongqing' < / span >,
         <span style="color:#880000">'81'</span> : <span style="color:#880000 "> 'Hong Kong' < / span >,
         <span style="color:#880000">'82 '</span> : <span style="color:#880000 "> 'Macao' < / span >,
         <span style="color:#880000">'13'</span> : <span style="color:#880000 "> 'Hebei' < / span >,
         <span style="color:#880000">'14'</span> : <span style="color:#880000 "> 'Shanxi' < / span >,
         <span style="color:#880000">'15'</span> : <span style="color:#880000 "> 'Inner Mongolia' < / span >,
         <span style="color:#880000">'21'</span>: <span style="color:#880000 "> 'Liaoning' < / span >,
         <span style="color:#880000">'22'</span> : <span style="color:#880000 "> 'Jilin' < / span >,
         <span style="color:#880000">'23'</span> : <span style="color:#880000 "> 'Heilongjiang' < / span >,
         <span style="color:#880000">'32'</span> : <span style="color:#880000 "> 'Jiangsu' < / span >,
         <span style="color:#880000">'33'</span> : <span style="color:#880000 "> 'Zhejiang' < / span >,
         <span style="color:#880000">'34'</span> : <span style="color:#880000 "> 'Anhui' < / span >,
         <span style="color:#880000">'35'</span> : <span style="color:#880000 "> 'Fujian' < / span >,
         <span style="color:#880000">'36'</span> : <span style="color:#880000 "> 'Jiangxi' < / span >,
         <span style="color:#880000">' 37'</span>: <span style="color:#880000 "> 'Shandong' < / span >,
         <span style="color:#880000">'41' </span>: <span style="color:#880000 "> 'Henan' < / span >,
         <span style="color:#880000">'42' </span>: <span style="color:#880000 "> 'Hubei' < / span >,
         <span style="color:#880000">'43' </span>: <span style="color:#880000 "> 'Hunan' < / span >,
        <span style="color:#880000">'44'</span> : <span style="color:#880000 "> 'Guangdong' < / span >,
         <span style="color:#880000">'45'</span> :<span style="color:#880000 "> 'Guangxi' < / span >,
         <span style="color:#880000">'46' </span>: <span style="color:#880000 "> 'Hainan' < / span >,
         <span style="color:#880000">'51' </span>: <span style="color:#880000 "> 'Sichuan' < / span >,
         <span style="color:#880000">'52' </span>: <span style="color:#880000 "> 'Guizhou' < / span >,
         <span style="color:#880000">'53' </span>: <span style="color:#880000 "> 'Yunnan' < / span >,
         <span style="color:#880000">'54' </span>: <span style="color:#880000 "> 'Tibet' < / span >,
         <span style="color:#880000">'61' </span>: <span style="color:#880000 ">" Shaanxi '< / span >,
         <span style="color:#880000">'62'</span> : <span style="color:#880000 "> 'Gansu' < / span >,
         <span style="color:#880000">'63'</span> : <span style="color:#880000 "> 'Qinghai' < / span >,
         <span style="color:#880000">'64'</span> : <span style="color:#880000 "> 'Ningxia' < / span >,
         <span style="color:#880000">'65'</span> : <span style="color:#880000 "> 'Xinjiang' < / span >,
         <span style="color:#880000">'71'</span> : <span style="color:#880000 "> 'Taiwan' < / span >,
         <span style="color:#880000">'10'</span>: <span style="color:#880000 "> 'others' < / span >,
    }
    City Code = str(City Code)
    <span style="color:#333333"><strong>return</strong></span>city_map[cityCode[: <span style="color:#880000">2</span> ]]


<span style="color:#888888"># Read data</span>
df = pd.read_csv( <span style="color:#880000">'music_comments.csv'</span> , header= <span style="color:#333333"><strong>None</strong></span> , names=[ <span style="color:#880000">'name'</span> , <span style="color:#880000">'userid'</span> , <span style="color:#880000">'age'</span> , <span style="color:#880000">'gender'</span> , <span style="color:#880000">'city'</span> , <span style="color:#880000">'text'</span> , <span style="color:#880000">'comment'</span> , <span style="color:#880000">'commentid'</span> , <span style="color:#880000">'praise'</span> , <span style="color:#880000">'date'</span> ], encoding= <span style="color:#880000">'utf-8-sig'</span> )
 <span style="color:#888888">#We can see that the comment ID is de duplicated</span>
df = df.drop_duplicates( <span style="color:#880000">'commentid'</span> )
df = df.dropna()
<span style="color:#888888"># Apply for matching</span>
df[ <span style="color:#880000">'location'</span> ] = df[ <span style="color:#880000">'city'</span> ].apply(

<span style="color:#888888">#</span>
grouping<span style="color:#888888">Summary</span>loc_message = df.groupby([ <span style="color:#880000">'location'</span> ])
loc_com = loc_message[ <span style="color:#880000">'location'</span> ].agg([ <span style="color:#880000">'count'</span> ])
loc_com.reset_index(Local=<span style="color:#333333 "> < strong > true < / strong > < / span >)

<span style="color:#888888"># Draw a map</span>
value = [i <span style="color:#333333"><strong>for</strong></span> i <span style="color:#333333"><strong>in</strong></span> loc_com[ <span style="color:#880000">'count'</span> ]]
attr = [i <span style="color:#333333"><strong>for</strong></span> i <span style="color:#333333"><strong>in</strong></span> loc_com[ <span style="color:#880000">'location'</span> ]]
Print (value)
Print (properties)
map = Map( <span style="color:#880000">"Regional distribution map of user comments after songs were copied"</span> ,title_pos= <span style="color:#880000">'center'</span> ,title_top= <span style="color:#880000">0</span> )
map.add( <span style="color:#880000">""</span> , attr, value, maptype= <span style="color:#880000">"china"</span> , is_visualmap= <span style="color:#333333"><strong>True</strong></span> , visual_text_color= <span style="color:#880000">"#000"</span> , is_map_symbol_show= <span style="color:#333333"><strong>False</strong></span> , visual_range=[ <span style="color:#880000">0</span> , <span style="color:#880000">60</span> ])
map.render( <span style="color:#880000 "> 'regional release map of commenting users after the song was copied. HTML' < / span >)</span></span>
The final rendering is as follows:

It can be seen that Sichuan and Guangdong provinces have a large number of comments.
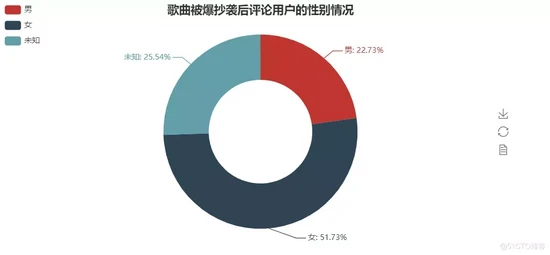
Fan gender
The code and the above description will not be repeated here, but directly on the renderings.

Fans can see that women occupy a large area.
Finally, there is a surprise (don't miss it)
It is the dream of every programmer to become a big manufacturer. He also hopes to have the opportunity to shine and make great achievements. However, the distance between ideal and reality needs to be shortened.
So here I have prepared some gift bags, hoping to help you.
★ gift bag 1
If you have no self-control or motivation to learn and communicate together, welcome to leave a message in the private letter or comment area. I will pull you into the learning and exchange group. We will communicate and study together, report to the group and punch in. There are many benefits in the group, waiting for you to unlock. Join us quickly!
★ gift bag 2
❶ a complete set of Python e-books, 200, a total of 6 G e-book materials, covering all major fields of Python.
❷ Python hands-on projects, including crawler, data analysis, machine learning, artificial intelligence and small game development.