Today, let's look at an interesting problem in data preprocessing: how to deal with missing values. Before we discuss the problem, let's review some basic terms to help us understand why we need to focus on missing values. The content of this article is long. I suggest learning after collection. I like to praise and support it.
catalogue
-
Introduction to data cleaning
-
Importance of filling in missing values
-
Problems caused by missing values
-
Missing data type
-
How to handle missing data in a dataset
Dry goods recommendation
- In depth sorting by the doctoral tutor of Zhejiang University: Tensorflow and pytoch's notes (including the actual combat of classic projects)
- It's worth collecting. This machine learning algorithm data is really fragrant
- It's more delicious than the official documents of PyTorch. Here comes the Chinese version of PyTorch
- Collect it quickly. Here comes the PDF collection of common code snippets of PyTorch
Data cleaning
Data cleaning in data preprocessing has nothing to do with machine learning methods, deep learning architecture or any other complex methods in the field of data science. We have data collection, data preprocessing, modeling (machine learning, computer vision, deep learning or any other complex method), evaluation, and final model deployment. Therefore, data processing modeling technology is a very hot topic, but there is a lot of work waiting for us to complete data preprocessing.
In the process of data analysis and mining, you will be familiar with this ratio: 60:40, which means that 60% of the work is related to data preprocessing, and sometimes the ratio is as high as more than 80%.
In this article, we will learn about data cleaning in the data preprocessing module. That is, the practice of correcting or eliminating inaccurate, damaged, malformed, duplicate or incomplete data from the data set is called data cleaning.
Importance of filling in missing values
In order to manage data effectively, it is important to understand the concept of missing values. If the data worker does not correctly handle the missing numbers, he or she may draw wrong conclusions about the data, which will have a significant impact on the modeling phase. This is an important issue in data analysis because it affects the results. In the process of analyzing data, when we find that one or more characteristic data are missing, it is difficult to fully understand or believe the conclusions or models. Missing values in the data may reduce the statistical ability of the research object, and even lead to wrong results due to the deviation of estimation.
Problems caused by missing values
-
In the absence of evidence, the statistical ability, that is, the probability of rejecting the null hypothesis when the null hypothesis is wrong, will be reduced.
-
The loss of data may lead to deviation in parameter estimation.
-
It has the ability to reduce the representativeness of samples.
-
This may make research and analysis more challenging.
Missing data type
You can classify data sets or patterns or data that do not exist in the data.
-
Complete random deletion (MCAR)
When the probability of losing data is independent of the exact value to be obtained or the set of observed answers. -
Random deletion (MAR)
When the probability of missing response is determined by the set of observed responses rather than the exact missing value expected. -
Non random deletion (MNAR)
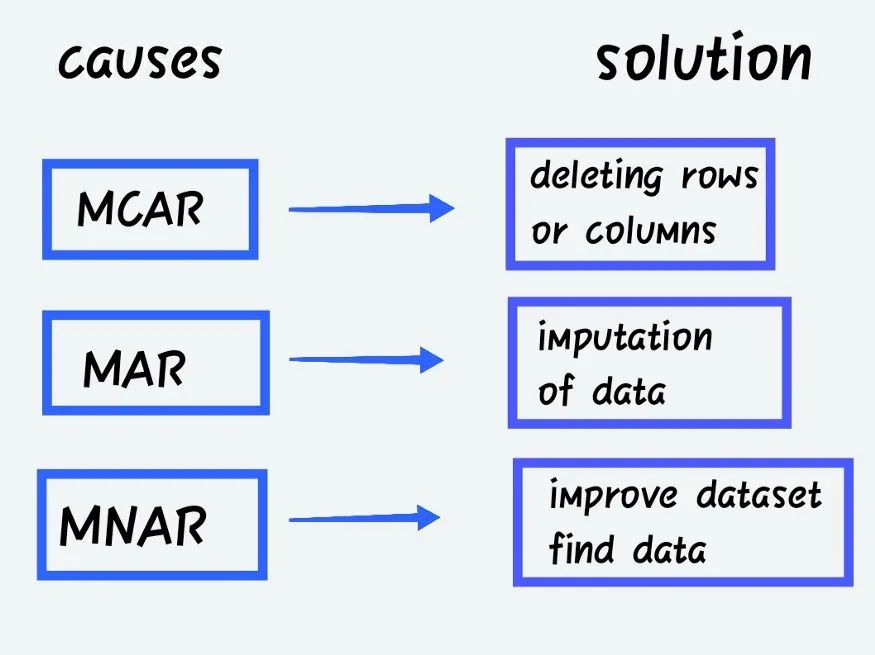
In addition to the above categories, MNAR is missing data. MNAR data cases are difficult to handle. In this case, modeling the missing data is the only way to obtain a fair approximation of the parameters.
Category of missing values
The missing columns have the following values:
-
Continuous variables or characteristics - numerical data sets, i.e. numbers, can be of any type
-
Categorical variable or characteristic - it can be numeric or objective.
For example:
Customer rating – poor, satisfied, good, better, best
Or gender – male or female.
Missing value imputation type
Interpolation has many sizes and forms. This is one of the ways to solve the problem of missing data in the dataset before modeling our application to improve accuracy.
-
Univariate interpolation or mean interpolation refers to the interpolation of values using only the target variable.
-
Multiple imputation: impute values based on other factors, such as using linear regression to estimate missing values based on other variables.
-
Single imputation: to build a single imputation dataset, you only need to interpolate the missing values in the dataset once.
-
Mass imputation: impute the same missing value multiple times in the dataset. This essentially requires repeating a single interpolation to obtain a large number of interpolated data sets.
How to handle missing data in a dataset
There are many ways to deal with missing data. First, import the library we need.
# Import library
import pandas as pd
import numpy as np
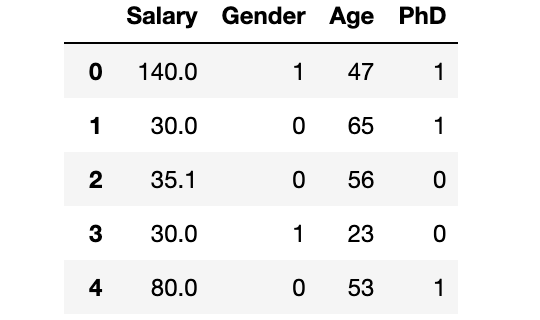
dataset = pd.read_csv("SalaryGender.csv",sep='\t')
# Then we need to import the dataset,
dataset.head()
Check the dimensions of the dataset
dataset.shape
Check for missing values
print(dataset.isnull().sum())

Salary    0
Gender    0
Age       0
PhD       0
dtype: int64
01 no treatment
Do nothing about lost data. On the one hand, some algorithms have the ability to deal with missing values. At this time, we can give full control to the algorithm to control how it responds to data. On the other hand, various algorithms react differently to missing data. For example, some algorithms determine the best interpolation value of missing data based on training loss reduction. Take XGBoost as an example. However, in some cases, the algorithm will also make errors, such as linear regression, which means that we must deal with the missing data value in the data preprocessing stage or when the model fails, and we must find out what the problem is.
In the actual work, we need to make a specific analysis according to the actual situation. Here, in order to demonstrate the processing method of missing values, we use the trial and error method to deduce the processing method of missing values according to the results.
# Old dataset with missing values
dataset["Age"][:10]
0    47
1    65
2    56
3    23
4    53
5    27
6    53
7    30
8    44
9    63
Name: Age, dtype: int64
02 delete it when not in use (mainly Rows)
Excluding records with missing data is the easiest way. However, some key data points may be lost. We can do this by using the dropna() function of the Python pandas package to delete all columns with missing values. Instead of eliminating all missing values in all columns, it is better to use domain knowledge or seek the help of domain experts to selectively delete rows / columns with missing values unrelated to machine learning problems.
-
Advantages: after deleting the lost data, the robustness of the model will become better.
-
Disadvantages: the loss of useful data cannot be underestimated, which may also be very important. However, if there are many missing values in the data set, it will seriously affect the modeling efficiency.
#deleting line - missing value
dataset.dropna(inplace=True)
print(dataset.isnull().sum())
Salary    0
Gender    0
Age       0
PhD       0
dtype: int64
03 mean interpolation
Using this method, you can first calculate the mean of the non missing values of the column, and then replace the missing values in each column independently of the other columns. The biggest disadvantage is that it can only be used for numerical data. This is a simple and fast method, which is suitable for small numerical data sets. However, there are limitations such as ignoring the fact of feature correlation. Each padding applies only to one of the independent columns.
In addition, if the outlier processing is skipped, a skewed average will almost certainly be replaced, thus reducing the overall quality of the model.
- Disadvantages: it is only applicable to numerical data sets, and the covariance between independent variables cannot be
#Mean - missing value
dataset["Age"] = dataset["Age"].replace(np.NaN, dataset["Age"].mean())
print(dataset["Age"][:10])
0    47
1    65
2    56
3    23
4    53
5    27
6    53
7    30
8    44
9    63
Name: Age, dtype: int64
04 median interpolation
Another interpolation technique to solve the outlier problem in the above method is to use the median. When sorting, it ignores the impact of outliers and updates the intermediate values that appear in the column.
- Disadvantages: it is only applicable to numerical data sets, and the covariance between independent variables cannot be
#Median - missing value
dataset["Age"] = dataset["Age"].replace(np.NaN, dataset["Age"].median())
print(dataset["Age"][:10])
05 mode interpolation
This method can be applied to classification variables with finite value sets. Sometimes, you can use the most commonly used values to fill in missing values.
For example, the available options are nominal category values (such as True/False) or conditions (such as normal / abnormal). This is especially true for ordinal classification factors such as education. Preschool, primary school, middle school, high school, graduation and so on are all examples of education level. Unfortunately, because this method ignores feature connection, there is a risk of data deviation. If the category values are unbalanced, it is more likely to introduce bias in the data (category imbalance problem).
-
Advantages: applicable to data in all formats.
-
Disadvantages: it is impossible to predict the covariance difference between independent features.
#Mode - missing value
import statistics
dataset["Age"] = dataset["Age"].replace(np.NaN, statistics.mode(dataset["Age"]))
print(dataset["Age"][:10])
06 imputation of classification values
When the category column has missing values, you can fill in the blanks with the most commonly used categories. If there are many missing values, you can create a new class to replace them.
-
Advantages: suitable for small data sets. Compensate for losses by inserting new categories
-
Disadvantages: it can not be used for other data except classification data, and additional coding features may lead to accuracy degradation
dataset.isnull().sum()

# True value - Classification - solution
dataset["PhD"] = dataset["PhD"].fillna('U')

# Check missing values in classification - nacelle
dataset.isnull().sum()
07 previous observation results (LOCF)
This is a common statistical method used to analyze longitudinal repeated measurement data, and some subsequent observations are missing.
#LOCF - previous observation
dataset["Age"] = dataset["Age"].fillna(method ='ffill')
dataset.isnull().sum()
08 linear interpolation
This is an approximate missing value method, connecting points in increasing order along a straight line. In short, it calculates unknown values in the same ascending order as the values that appear before it. Because linear interpolation is the default method, we do not need to specify it when using it. This method is often used in time series data sets.
#interpolation - linear
dataset["Age"] = dataset["Age"].interpolate(method='linear', limit_direction='forward', axis=0)

dataset.isnull().sum()
09 KNN interpolation
A basic classification method is the k nearest neighbor (kNN) algorithm. Class members are the result of k-NN classification.
The classification of the item depends on its similarity with the points in the training set. The object will enter the class with the most members in its K nearest neighbors. If k = 1, the item is simply assigned to the class of the nearest neighbor of the item. Using missing data to find the K neighborhood closest to the observed value, and then interpolating them according to the non missing values in the neighborhood may help to generate a prediction about the missing value.
# for knn imputation - we need to remove the normalized data and the classified data we need to convert
cat_variables = dataset[['PhD']]
cat_dummies = pd.get_dummies(cat_variables, drop_first=True)
cat_dummies.head()
dataset = dataset.drop(['PhD'], axis=1)
dataset = pd.concat([dataset, cat_dummies], axis=1)
dataset.head()

# Remove unwanted features
dataset = dataset.drop(['Gender'], axis=1)
dataset.head()

# scaling is mandatory before knn
from sklearn.preprocessing import MinMaxScaler
scaler = MinMaxScaler()
dataset = pd.DataFrame(scaler.fit_transform(dataset), columns = dataset.columns)
dataset.head()

# knn interpolation
from sklearn.impute import KNNImputer
imputer = KNNImputer(n_neighbors=3)
dataset = pd.DataFrame(imputer.fit_transform(dataset),columns = dataset.columns)

#Check for missing
dataset.isnull().sum()
10 interpolation of multivariate interpolation by chained equation (MICE)
MICE is a method of replacing missing data values in a data collection by multiple interpolation. You can first make duplicate copies of data sets with missing values in one or more variables.
#MICE
import numpy as np
import pandas as pd
from sklearn.experimental import enable_iterative_imputer
from sklearn.impute import IterativeImputer
df = pd.read_csv('https://raw.githubusercontent.com/datasciencedojo/datasets/master/titanic.csv')
df = df.drop(['PassengerId','Name'],axis=1)
df = df[["Survived", "Pclass", "Sex", "SibSp", "Parch", "Fare", "Age"]]
df["Sex"] = [1 if x=="male" else 0 for x in df["Sex"]]

df.isnull().sum()
imputer=IterativeImputer(imputation_order='ascending',max_iter=10,random_state=42,n_nearest_features=5)
imputed_dataset = imputer.fit_transform(df)
Writing last
For our dataset, we can use the above ideas to solve the missing values. The way we deal with missing values depends on the missing values in our characteristics and the model we need to apply
Technical exchange
At present, a technical exchange group has been opened, with more than 1000 group friends. The best way to add notes is: source + Interest direction, which is convenient to find like-minded friends
- Method ① send the following pictures to wechat, long press identification, and the background replies: add group;
- Second, WeChat search official account: machine learning community, background reply: add group;
- Mode ③ micro signal can be added directly: mlc2060. Note when adding: research direction + school / company + CSDN. Then we can pull you into the group.