Reference article:
https://blog.csdn.net/jasonchen_gbd/article/details/45585133
brief introduction
When the kernel has a serious error, such as Oops error or the kernel thinks the system running state is abnormal, the kernel will print the stack backtracking information of the current process, including the location of the current executing code and adjacent instructions, the cause of the error, the value of the key register and the function call relationship, This information is useful for debugging kernel errors.
The function that prints the function call relationship is dump_stack(), which can be used not only when the system has problems, but also when debugging the kernel through dump_ The printing information of stack () function makes it easier to understand the kernel code execution process.
dump_ The implementation of stack () function is closely related to the system structure. This paper introduces dump in ARM system_ Implementation of stack() function. This function is defined in arch / ARM / kernel / traps In the C file, call dump_. The stack () function does not need to add header files. It can be used directly anywhere in the kernel code.
Relevant basic knowledge
Readers need to know some basic knowledge of ARM assembly. Before talking about the code, let me briefly talk about the general process of function calls in the kernel.
Introduction to key registers:
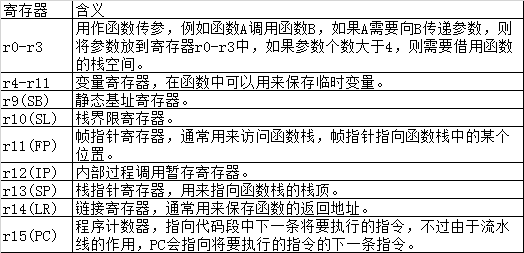
Function stack in kernel
In the kernel, the initial instructions of a function code are in the following form:
1             mov   ip, sp
2             stmfd sp!, {r0 - r3} (Optional)
3             stmfd sp!, {..., fp, ip, lr, pc}
4             ......
It can be seen from the two stmfd (stack pressing) instructions that the structure of the bottom (high address) of the function stack of a function is basically fixed, as shown in the following figure:
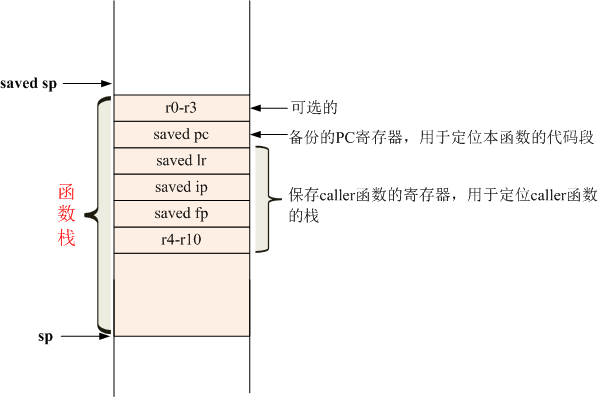
First, we agree that the called function is called callee function, and the caller function is called caller function.
During the backtracking of function calls, dump in the kernel_ The stack() function needs to try the following:
- First, read the value of FP register in the system. We know that the frame pointer points to a position of the function stack, so we can directly find the address of the function stack of the current function through the value of FP.
- It is easy to get the code segment address of the current function, because the currently executing code (available through PC register) is in the code segment of the function. A backup of PC register is saved in the function stack. Through the value of this PC register, you can locate the first instruction of the function, that is, the entry address of the function.
- After getting the entry address of the current function, the kernel saves the corresponding relationship between all function addresses and function names, so you can print out the function name (see another blog: the search process of kernel symbol table for details).
- The frame pointer of the caller function (the value of FP register) is also saved in the function stack of the current function, so we can find the position of the function stack of the caller function.
- Continue to perform steps 2-4 until the frame pointer (the value of FP register) saved in the function stack of a function is 0 or illegal.
When a function call occurs, the relationship between the function stack and the code segment is shown in the following figure: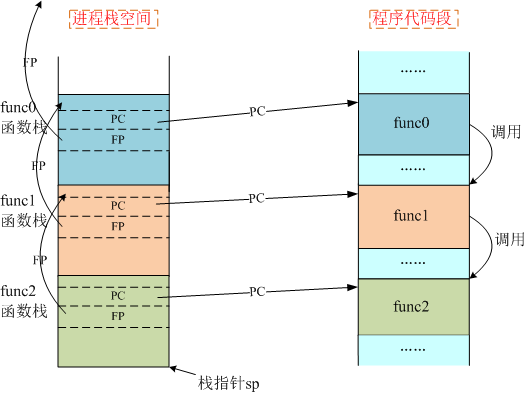
dump_stack() function
Next, let's take a look at dump_ Implementation of stack() function.
dump_stack() mainly calls the following functions
1 c_backtrace(fp, mode);
The meanings of the two parameters are:
fp: fp register of current process stack.
Mode: we don't care about the PSR mode used by ptrace here. dump_ The value passed in by stack is 0x10.
These two parameters are assigned to R0 and R1 register is passed to c_backtrace() function.
c_ The backtrace function is defined as follows (arch/arm/lib/backtrace.S):
  1 @ Define several local variables
  2 #define frame   r4
  3 #define sv_fp   r5
  4 #define sv_pc   r6
  5 #define mask    r7
  6 #define offset  r8
  7
  8 @ Currently in dump_backtrace Function stack
  9 ENTRY(c_backtrace)
 10         stmfd   sp!, {r4 - r8, lr}  @ take r4-r8 and lr Push into the stack, we want to use r4-r8,So back up the original value. sp Point to the last pressed data
 11         movs    frame, r0   @ frame=r0. r0 Is the first parameter passed in, i.e fp Register value
 12         beq no_frame        @ If frame 0, exit
 13
 14         tst r1, #0x10       @ 26 or 32-bit mode? judge r1 of bit4 Is it 0
 15         moveq   mask, #0xfc000003   @ mask for 26-bit If yes, i.e r1=0x10,be mask=0xfc000003,Namely pc The address is only low 26 bit Valid, and the last two digits are 0
 16         movne   mask, #0        @ mask for 32-bit If not, i.e r1!=0x10,be mask=0
 17
 18         @ The following is a section of code unrelated to the function, which is used to calculate pc Prefetch refers to the offset of, generally pc It points to the next two instructions, so offset Generally equal to 8
 19 1:      stmfd   sp!, {pc}       @ storage pc To the stack,sp point pc.
 20         ldr r0, [sp], #4        @ r0=sp That is, the value just saved pc The value of (the instruction to be executed), sp=sp+4 Namely restore sp
 21         adr r1, 1b              @ r1 = Address of label 1, i.e. instruction stmfd sp!, {pc} Address of
 22         sub offset, r0, r1      @ offset=r0-r1,Namely pc Instructions and reads actually pointed to pc Offset between instructions
 23
 24 /*
 25  * Stack frame layout:
 26  *             optionally saved caller registers (r4 - r10)
 27  *             saved fp
 28  *             saved sp
 29  *             saved lr
 30  *    frame => saved pc     @ frame That is, fp above, fp of each function points to this position
 31  *             optionally saved arguments (r0 - r3)
 32  * saved sp => <next word>
 33  *
 34  * Functions start with the following code sequence:
 35  *                  mov   ip, sp
 36  *                  stmfd sp!, {r0 - r3} (optional)
 37  * corrected pc =>  stmfd sp!, {..., fp, ip, lr, pc} //Instruction to stack pc
 38  */
 39  @ Function main process: start to find and print the caller function
 40 for_each_frame: tst frame, mask     @ Check for address exceptions
 41         bne no_frame
 42
 43         @ from sv_pc Find will pc The instruction pressing the stack, because the position of this instruction in the code segment is special, can be used to locate the function entry.
 44 1001:       ldr sv_pc, [frame, #0]      @ Get saved in callee In the stack sv_pc,It points to callee Somewhere in the code snippet
 45 1002:       ldr sv_fp, [frame, #-12]    @ get saved fp,this fp namely caller of fp,point caller Somewhere in the stack
 46
 47         sub sv_pc, sv_pc, offset    @ sv_pc subtract offset,Find will pc The instruction of pressing the stack, which is mentioned in the above note corrected pc.
 48         bic sv_pc, sv_pc, mask      @ mask PC/LR for the mode eliminate sv_pc in mask A bit of 1, for example, mask=0x4,Then clear sv_pc of bit2.
 49
 50         @ Locate the first instruction of the function, that is, the function entry address
 51 1003:       ldr r2, [sv_pc, #-4]    @ if stmfd sp!, {args} exists, If you press in at the beginning of the function r0-r3
 52         ldr r3, .Ldsi+4             @ adjust saved 'pc' back one. r3 = 0xe92d0000 >> 10
 53         teq r3, r2, lsr #10         @ compare stmfd Are the machine instruction codes the same(Do not pay attention to whether to save r0-r9),The purpose is to determine whether it is stmfd instructions
 54         subne   r0, sv_pc, #4       @ allow for mov: If sv_pc Only in front mov   ip, sp
 55         subeq   r0, sv_pc, #8       @ allow for mov + stmia: If sv_pc There are two instructions ahead
 56         @ So far, r0 by callee The address of the first instruction of the function, i.e callee The entry address of the function
 57
 58         @ Print r0 The symbolic name corresponding to the address, passed to dump_backtrace_entry Three parameters:
 59         @ r0:Function entry address,
 60         @ r1:The return value is caller Address in,
 61         @ r2: callee of fp
 62         ldr r1, [frame, #-4]    @ get saved lr
 63         mov r2, frame
 64         bic r1, r1, mask        @ mask PC/LR for the mode
 65         bl  dump_backtrace_entry
 66
 67         @ Print the register stored in the stack, which has nothing to do with stack backtracking, which is not concerned in this article
 68         ldr r1, [sv_pc, #-4]    @ if stmfd sp!, {args} exists, sv_pc Is the previous instruction stmfd instructions
 69         ldr r3, .Ldsi+4
 70         teq r3, r1, lsr #10
 71         ldreq   r0, [frame, #-8]    @ get sp. frame-8 Point to saved IP Register, due to mov   ip, sp,therefore caller of sp=ip
 72                                     @ therefore r0=caller The low address of the stack.
 73         subeq   r0, r0, #4      @ point at the last arg. r0+4 namely callee The high address of the stack.
 74                                 @ Because the stacking order of parameters is r3,r2,r1,r0,So here the top of the stack is actually the last parameter.
 75         bleq    .Ldumpstm       @ dump saved registers
 76
 77         @ Print the register stored in the stack, which has nothing to do with stack backtracking, which is not concerned in this article
 78 1004:       ldr r1, [sv_pc, #0]     @ if stmfd sp!, {..., fp, ip, lr, pc}
 79         ldr r3, .Ldsi       @ instruction exists, If the instruction is frame The instruction pointed to is stmfd sp!, {..., fp, ip, lr, pc}
 80         teq r3, r1, lsr #10
 81         subeq   r0, frame, #16 @ skip fp, ip, lr, pc,The saved is found r4-r10
 82         bleq    .Ldumpstm       @ dump saved registers,Print out r4-r10
 83
 84         @ To save in the current function stack caller of fp Check the legitimacy
 85         teq sv_fp, #0       @ zero saved fp means Judge acquired caller of fp Value of
 86         beq no_frame        @ no further frames   If caller fp=0,Then stop the cycle
 87
 88         @ to update frame Variable pointing caller The position of the function stack Stack frame layout
 89         cmp sv_fp, frame        @ sv_fp-frame
 90         mov frame, sv_fp        @ frame=sv_fp
 91         bhi for_each_frame      @ cmp Results, if frame<sv_fp,I.e. current fp less than caller of fp,Then continue the cycle
 92         @ At this time frame point caller Stack fp,Because it will not be modified in the function fp So this fp It must point to caller Preserved pc The location of the.
 93
 94 1006:       adr r0, .Lbad       @ Otherwise, print bad frame Tips
 95         mov r1, frame
 96         bl  printk
 97 no_frame:   ldmfd   sp!, {r4 - r8, pc}
 98 ENDPROC(c_backtrace)
 99 @ c_backtrace End of function.
100
101         @ Put the above code in__ex_table Exception table. Including 1001 b ... 1006b Refers to 1001 above-1006 grade.
102         .section __ex_table,"a"
103         .align  3
104         .long   1001b, 1006b
105         .long   1002b, 1006b
106         .long   1003b, 1006b
107         .long   1004b, 1006b
108         .previous
109
110 #define instr r4
111 #define reg   r5
112 #define stack r6
113
114 @ Print register value
115 .Ldumpstm:  stmfd   sp!, {instr, reg, stack, r7, lr}
116         mov stack, r0
117         mov instr, r1
118         mov reg, #10
119         mov r7, #0
120 1:      mov r3, #1
121         tst instr, r3, lsl reg
122         beq 2f
123         add r7, r7, #1
124         teq r7, #6
125         moveq   r7, #1
126         moveq   r1, #'\n'
127         movne   r1, #' '
128         ldr r3, [stack], #-4
129         mov r2, reg
130         adr r0, .Lfp
131         bl  printk
132 2:      subs    reg, reg, #1
133         bpl 1b
134         teq r7, #0
135         adrne   r0, .Lcr
136         blne    printk
137         ldmfd   sp!, {instr, reg, stack, r7, pc}
138
139 .Lfp:       .asciz  "%cr%d:%08x"
140 .Lcr:       .asciz  "\n"
141 .Lbad:      .asciz  "Backtrace aborted due to bad frame pointer <%p>\n"
142         .align
143 .Ldsi:
144         @ Used to determine whether it is stmfd sp!Instruction, and the parameter contains fp, ip, lr, pc,Not included r10
145         .word   0xe92dd800 >> 10    @ stmfd sp!, {... fp, ip, lr, pc}
146         @ Used to determine whether it is stmfd sp!Instruction, and the parameter does not contain r10, fp, ip, lr, pc
147         .word   0xe92d0000 >> 10    @ stmfd sp!, {}