The debugging methods of embedded system development are as follows:
1. Kernel and driver code debugging tools, such as valgrind, lttng, trace, kdump, kprobe, jprobe, etc,
2. App user program debugging method on Linux system, GDB, APP log, and some third-party capture kernel crash tools
When the application involved in the user's App program is complex and the software runs for a long time, the bug or kernel crash can be found by using the method of applog + third-party kernel capture tool to find the fault site of the system; This part will be shared separately when time is convenient. This article mainly introduces the common commands of GDBServer and GDB.
1, GDB application scenario
The performance of the target host of embedded Linux is relatively weak. Sometimes it is difficult to run GDB debugging directly on the target host; In this case, the target machine is generally selected as GDBServer, Linux desktop publishing system, such as ubuntu and centos environment as GDBclient mode, and the combined mode is used for debugging.
General desktop systems such as Ubuntu and Centos can directly run gdb + target executable programs, which can be debugged directly by gdb. Generally, the ide environment can be more convenient to use in debugging the application program in pc system (such as QT, eclipse + GDB), and there is no need to use the old debugging method of gdb life command. Therefore, this debug command can be checked first.
Development environment of this article:
Target host: LS1046 motherboard and LEDE-17 routing operating system;
pc vmware-15: Ubuntu 18 desktop system
GDB debugging tool is the function of the mainline linux kernel. Therefore, it is a general method in the minimum linux embedded platform, openWrt/LEDE routing platform and ubuntu embedded platform. In other words, as long as the operating system of linux distribution version can be used basically.
2.1 GDBServer environment construction of embedded host
-
When cutting the kernel, you need to compile the GDBServer module into the kernel. The menu path is development - > GDBServer, and select 'y'; Save and exit;
-
Select the app to be debugged, modify the Makefile file in the source directory, modify CXXFLAGS += -g, add - g to open gdb debugging;
-
Compile the kernel and app software, and burn it only in the embedded host, that is, it has the debugging environment using GDBserver.
A test case written manually in this chapter is as follows:
#include <stdio.h>

void debug(char *str)
{
    printf("debug info :%s\n",str );
}

main(int argc,char *argv[])
{
    int i,j;
    j=0;
    for(i=0;i<10;i++){
        j+=5;
        printf("now a=%d\n", j);
    }
}
Manually compile and open gdb debugging function
arm-none-linux-gnueabi-gcc -g test.c -o test
Generate an a.out executable file and copy it to the embedded host.
2.2 configure the network environment of the virtual host
The experimental environment adopts Ubuntu 18 desktop version, which is installed in the virtual machine of VMware-15.
Configure the network connection to bridge mode:
1. Select Edit - > virtual network editor from VMware menu;
2. Enable management permission, use bridge mode and VMnet0 bridge mode – > bridge to the physical network card of PC;
After ubuntu starts up, configure dhcp to automatically obtain IP, and then run the network service again. The IP address information obtained is as follows:
robot@ubuntu:/etc$ ifconfig
ens33: flags=4163<UP,BROADCAST,RUNNING,MULTICAST>  mtu 1500
        inet 192.168.15.160  netmask 255.255.255.0  broadcast 192.168.15.255
        inet6 fe80::c8dd:6c50:25ef:4ea7  prefixlen 64  scopeid 0x20<link>
        ether 00:0c:29:05:c2:d4  txqueuelen 1000  (Ethernet)
        RX packets 2194  bytes 2478926 (2.4 MB)
        RX errors 0  dropped 0  overruns 0  frame 0
        TX packets 1042  bytes 96661 (96.6 KB)
        TX errors 0  dropped 0 overruns 0  carrier 0  collisions 0
The local ip address is inet 192.168.15.160, the target host ip is 192.168.15.1 router, and the GDB server runs on this router.
2.3 running GDB server
Since gdb server has been compiled into the kernel, run it directly:
// gdb server can be connected through 3000 port for debugging
$ gdbserver:3000 /home/a.out
// Specify the client ip address as 192.168.15.160
$ gdbserver 192.168.15.160:3000 /home/a.out
2.4 running GDB client
Run the cross compiled gdb debugging tool in the ubuntu host to the compiled gdb path of the OpenWRT routing system
staging_dir/toolchain-aarch64_generic_gcc-5.5.0_musl/bin /, which is the cross compilation tool chain for generating the target host.
a. Enter target remote 192.168.15.1:3000
Insert the code slice here
b. Enter file a.out
Insert the code slice here
c. Start program execution
Insert the code slice here
Single step debugging
robot@ubuntu:~/test/gdb/simple$ arm-none-linux-gnueabi-gdb
GNU gdb (Sourcery CodeBench Lite 2012.03-57) 7.2.50.20100908-cvs
Copyright (C) 2010 Free Software Foundation, Inc.
License GPLv3+: GNU GPL version 3 or later <http://gnu.org/licenses/gpl.html>
This is free software: you are free to change and redistribute it.
There is NO WARRANTY, to the extent permitted by law.  Type "show copying"
and "show warranty" for details.
This GDB was configured as "--host=i686-pc-linux-gnu --target=arm-none-linux-gnueabi".
For bug reporting instructions, please see:
<https://support.codesourcery.com/GNUToolchain/>.
//Connect to gdb server
(gdb) target remote 172.16.30.20:777
Remote debugging using 172.16.30.20:777
0xb6ed7ed0 in ?? ()

//File load debug file
(gdb) file a.out
A program is being debugged already.
Are you sure you want to change the file? (y or n) y
Reading symbols from /home/fuzk/test/gdb/simple/a.out...done.
Cannot access memory at address 0x0
//Run program
(gdb) b main
Cannot access memory at address 0x0
Note: breakpoints 1 and 2 also set at pc 0x846c.
Breakpoint 3 at 0x846c: file test.c, line 11.
//Start debugging
(gdb) c
Continuing.

Breakpoint 1, main (argc=1, argv=0xbe9bbe54) at test.c:11
11          j=0;
(gdb) s  //Single step operation
12          for(i=0;i<10;i++){
(gdb) s
13              j+=5;
(gdb) s
14              printf("now a=%d\n", j);
(gdb) n
12          for(i=0;i<10;i++){
(gdb) s
13              j+=5;
(gdb) s
14              printf("now a=%d\n", j);
(gdb) n
12          for(i=0;i<10;i++){
(gdb) n
13              j+=5;
(gdb) n
14              printf("now a=%d\n", j);
(gdb) n
12          for(i=0;i<10;i++){
(gdb) n
13              j+=5;
(gdb) n
14              printf("now a=%d\n", j);
(gdb)
(gdb) s12          for(i=0;i<10;i++){(gdb) s13              j+=5;(gdb) s  printf Because there is no-g Compile call step Will cause exceptions, so it is recommended to use next, But if you use the system's own, there will be a red prompt above, so use it step Not afraid! fourteen              printf("now a=%d\n", j);(gdb) s12          for(i=0;i<10;i++){(gdb) s13              j+=5;(gdb) s14              printf("now a=%d\n", j);
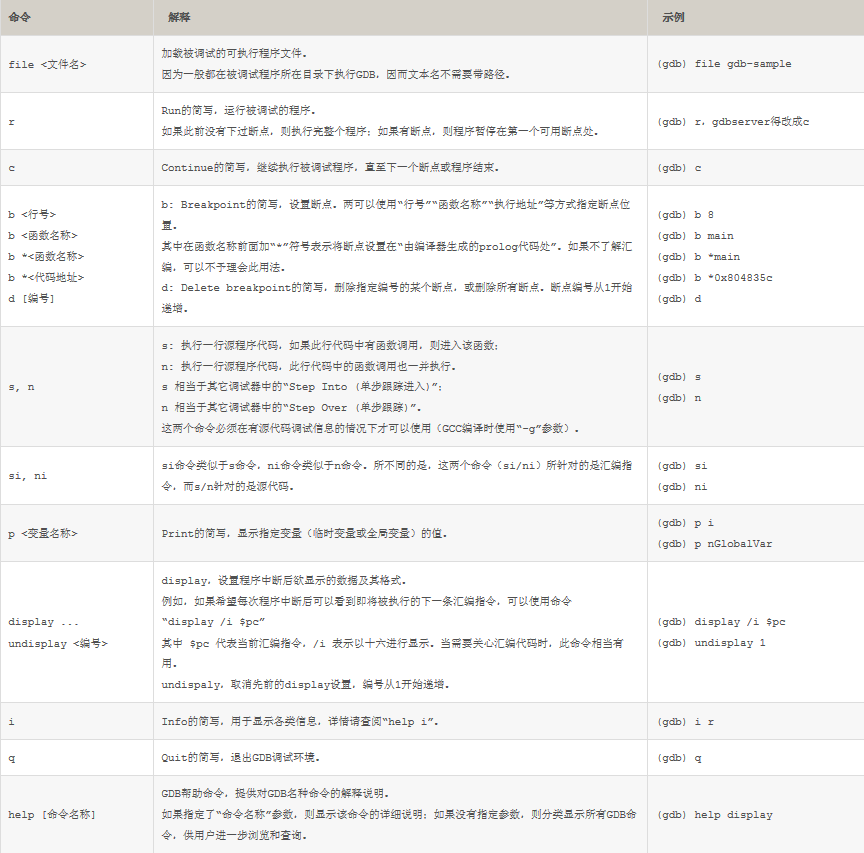
2, GDB debugging common commands
When debugging an application, a better way is to output the application log, which can more comprehensively analyze various exceptions and program logic problems in the program.
2.1 list command
The code can be listed by running the list command (abbreviated l) in gdb. The specific forms of list include:
list, display the source program around the linenum line of the program, and display the function, such as:
//Display function
(gdb) list main
4	{
5	    printf("debug info :%s\n",str );
6	}
7
8	void main(int argc,char *argv[])
9	{
10	    int i,j;
11	    j=0;
12	    for(i=0;i<10;i++){
13	        j+=5;
//Display line
(gdb) list 10
5	    printf("debug info :%s\n",str );
6	}
7
8	void main(int argc,char *argv[])
9	{
10	    int i,j;
11	    j=0;
12	    for(i=0;i<10;i++){
13	        j+=5;
14	        printf("now a=%d\n", j);
(gdb)
2.2 run command
In gdb, the run program uses the run command. Before running the program, we can set the working environment in the following four aspects:
Program running parameters
Set args can specify runtime parameters, such as: set args 10 20 30 40 50; The show args command can view the set running parameters.
Operating environment
path
show environment [varname] is used to view environment variables.
working directory
cd
Program input and output
info terminal is used to display the mode of the terminal used by the program; gdb can also use redirection control program output, such as run > outfile;
The tty command can specify the input and output terminal devices, such as tty /dev/ttyS1.
2.3 break command
Use the break command to set breakpoints in gdb. The methods to set breakpoints include:
break
Stop when entering the specified function. In C + +, you can use class::function or function(type, type) format to specify the function name.
break
Stop at the specified line number.
break +offset / break -offset
The offset line before or after the current line number stops, and offset is a natural number.
break filename:linenum
Stop at the linenum line of the source file filename.
break filename:function
Stop at the entrance of the function function of filename in the source file.
break *address
Stop at the memory address where the program is running.
break
When the break command has no parameters, it means to stop at the next instruction.
break ... if
"..." can be the parameters in the above break, break +offset / break – offset. Condition represents a condition and stops when the condition is true. For example, in the loop body, you can set break if i=100 to stop the program when i is 100.
When viewing breakpoints, you can use info commands, such as info breakpoints [n], info break [n] (n indicates breakpoint number).
2.4 single step command
During debugging, the next command is used for single step execution, similar to step over in VC + +. The next step will not enter the function. The step (abbreviation s) command corresponding to next will enter the function when executing a function step by step, similar to step into in VC + +. The following shows the execution of the step command. Executing step at the add() function call on line 23 will enter its internal "return a+b;" sentence:
(gdb) break 25
Breakpoint 1 at 0x8048362: file gdb_example.c, line 25.
(gdb) run
Starting program: /driver_study/gdb_example

Breakpoint 1, main () at gdb_example.c:25
25          sum[i] = add(array1[i], array2[i]);
(gdb) step
add (a=48, b=85) at gdb_example.c:3
3         return a + b;
2.5 print command
When debugging a program, when the program is stopped, you can use the print command (abbreviated as p) or the synonymous command inspect to view the running data of the current program. The format of the print command is:
 print <expr>
 print /<f> <expr>
Is an expression, an expression in the debugged program, and the output format. For example, if you want to output the expression in hexadecimal format, it is / x. In expressions, there are several GDB supported operators that can be used in any language, "@" is an operator related to arrays, "::" specifies a variable in a file or function, "{}" represents an object of type pointing to a memory address.
The following demonstrates the process of viewing the value of sum [] array:
(gdb) print sum
$2 = {133, 155, 0, 0, 0, 0, 0, 0, 0, 0}
(gdb) next

Breakpoint 1, main () at gdb_example.c:25
25          sum[i] = add(array1[i], array2[i]);
(gdb) next
23        for (i = 0; i < 10; i++)
(gdb) print sum
$3 = {133, 155, 143, 0, 0, 0, 0, 0, 0, 0}
When you need to view the value of a continuous memory space, you can use the "@" operator of GDB. The left side of "@" is the first memory address, and the right side of "@" is the length of memory you want to view. For example, the following dynamically requested memory:
int *array = (int *) malloc (len * sizeof (int));
*array = (int *) malloc (len * sizeof (int));
During GDB debugging, the value of this dynamic array is displayed as follows:
p *array@len
*array@len
The output formats of print include:
x displays variables in hexadecimal format.
d displays variables in decimal format.
u displays unsigned integers in hexadecimal format.
o display variables in octal format.
Tdisplay variables in binary forma t.
a displays variables in hexadecimal format.
c display variables in character format.
f displays variables in floating point format.
We can use the display command to set some automatically displayed variables. When the program stops or single-step tracking, these variables will be displayed automatically. If you want to modify a variable, such as the value of x, you can use the following command:
print x=4
x=4
2.6 watch command (view the value of variable)
watch is generally used to observe whether the value of an expression (variable is also an expression) has changed. If there is a change, stop the program immediately. We have the following methods to set the observation point: watch: set a observation point for the expression (variable) expr. When the value of a quantity expression changes, stop the program immediately. rwatch: stops the program when the expression (variable) expr is read. Wait: stops the program when the value of an expression (variable) is read or written. info watchpoints: lists all currently set observation points. The following illustrates the process of observing i and displaying the i value once i changes when running next continuously:
(gdb) watch i
Hardware watchpoint 3: i
(gdb) next
23        for (i = 0; i < 10; i++)
(gdb) next
Hardware watchpoint 3: i

Old value = 0
New value = 1
0x0804838d in main () at gdb_example.c:23
23        for (i = 0; i < 10; i++)
(gdb) next

Breakpoint 1, main () at gdb_example.c:25
25          sum[i] = add(array1[i], array2[i]);
(gdb) next
23        for (i = 0; i < 10; i++)
(gdb) next
Hardware watchpoint 3: i

Old value = 1
New value = 2
0x0804838d in main () at gdb_example.c:23
23        for (i = 0; i < 10; i++)
2.7 examine command (view the value in the memory address)
We can use the examine command (abbreviated as x) to view the values in the memory address. The syntax of the examine command is as follows:
x/<n/f/u> <addr>
/<n/f/u> <addr>
Represents a memory address. N, f and u after "x /" are optional parameters. N is a positive integer, indicating the length of display memory, that is, the contents of several addresses are displayed backward from the current address; f represents the displayed format. If the address refers to a string, the format can be s; if the address is an instruction address, the format can be i; U indicates the number of bytes requested from the current address. If not specified, GDB defaults to 4 bytes. The U parameter can be replaced by some characters: b represents a single byte, h represents a double byte, w represents four bytes, and g represents eight bytes. When we specify the byte length, GDB will read and write the specified byte from the specified memory address and take it as a value. n. The three parameters f and u can be used together. For example, the command "x/3uh 0x54320" indicates that three units (3) of memory are displayed in double byte as one unit (h) and hexadecimal mode (U) starting from the memory address 0x54320.
example:
main()
{
        char *c = "hello world";
        printf("%s\n", c);
}
We are in char *c = "hello world"; Set breakpoint on the next line:
// Load debug file debug
robot@ubuntu:~/ixeos-dev/gdb-server$ gdb debug
GNU gdb (Ubuntu 7.11.1-0ubuntu1~16.5) 7.11.1
Copyright (C) 2016 Free Software Foundation, Inc.
License GPLv3+: GNU GPL version 3 or later <http://gnu.org/licenses/gpl.html>
This is free software: you are free to change and redistribute it.
There is NO WARRANTY, to the extent permitted by law.  Type "show copying"
and "show warranty" for details.
This GDB was configured as "x86_64-linux-gnu".
Type "show configuration" for configuration details.
For bug reporting instructions, please see:
<http://www.gnu.org/software/gdb/bugs/>.
Find the GDB manual and other documentation resources online at:
<http://www.gnu.org/software/gdb/documentation/>.
For help, type "help".
Type "apropos word" to search for commands related to "word"...
Reading symbols from debug...done.
(gdb) l
1	#include <stdio.h>
2
3	void main(void)
4	{
5	        char *c = "hello world";
6	        printf("%s\n", c);
7	}
// Set breakpoint
(gdb) b 6
Breakpoint 1 at 0x400536: file debug.c, line 6.
//function
(gdb) r
Starting program: /home/robot/ixeos-dev/gdb-server/debug

Breakpoint 1, main () at debug.c:6
6	        printf("%s\n", c);
//Display variable contents
(gdb) p c
$1 = 0x4005d4 "hello world"

// Display memory address content
(gdb) x/s 0x4005d4
0x4005d4:	"hello world"
//Modify variable value
(gdb) p *(char*)0x4005d4='H'
$2 = 72 'H'
(gdb) p c
$3 = 0x4005d4 "Hello world"
2.8 jump command
Generally speaking, the debugged program will execute in sequence according to the running order of the program code, but GDB also provides the function of out of order execution, that is, GDB can modify the execution order of the program so that the program can jump at will. This function can be used by the jump command of GDB: jump to specify the running point of the next statement. It can be the line number of the file, file:line format, or + num offset format, indicating where the next running statement starts. jump
Here is the memory address of the code line. Note that the jump command will not change the contents of the current program stack. Therefore, if you use jump to jump from one function to another, an error will occur when the jump function returns after running, which may lead to unexpected results. Therefore, it is best to jump only in the same function with jump.2.9 signal command
Using the singal command, you can generate a semaphore to the debugged program, such as the interrupt signal "Ctrl+C". This is very convenient for program debugging. You can set a breakpoint at any position where the program runs, and generate a semaphore with GDB at the breakpoint. This method of accurately generating a signal somewhere is very conducive to program debugging. The syntax of the signal command is: signal. UNIX system semaphores usually range from 1 to 15, so the value is also in this range.
2.10 help command
The help command can help us use different gdb function modules, for example:
// call instructions
(gdb) help call
Call a function in the program.
The argument is the function name and arguments, in the notation of the
current working language.  The result is printed and saved in the value
history, if it is not void.
// print instructions
(gdb) help print
Print value of expression EXP.
Variables accessible are those of the lexical environment of the selected
stack frame, plus all those whose scope is global or an entire file.

$NUM gets previous value number NUM.  $ and $$ are the last two values.
$$NUM refers to NUM'th value back from the last one.
Names starting with $ refer to registers (with the values they would have
if the program were to return to the stack frame now selected, restoring
all registers saved by frames farther in) or else to debugger
"convenience" variables (any such name not a known register).
Use assignment expressions to give values to convenience variables.

{TYPE}ADREXP refers to a datum of data type TYPE, located at address ADREXP.
@ is a binary operator for treating consecutive data objects
anywhere in memory as an array.  FOO@NUM gives an array whose first
element is FOO, whose second element is stored in the space following
where FOO is stored, etc.  FOO must be an expression whose value
resides in memory.

EXP may be preceded with /FMT, where FMT is a format letter
but no count or size letter (see "x" command).
3, GDB debug core file
3.1 core files
When a Segmentation Fault occurs during the running of the program, the program will stop running. The operating system stores the current memory status of the program in a core file, namely the core dump file. The core file is the memory image of the running state of the program.
The reason why the program running state is saved as a file named core is that core means core memory, which is a memory made of coils. Nowadays, with the rapid development of semiconductor industry, core memory is no longer used. However, in many cases, people still call memory core.
Using gdb to debug the core file can help us quickly locate the location of segment errors in the program. Of course, the - g compilation option should be added when compiling executable programs to generate debugging information.
When the program accesses illegal memory, segment errors will be generated. The common situations of segment errors are:
(1) Access non-existent memory address;
(2) Access the memory address protected by the system;
(3) Array access out of bounds, etc.
3.2 control whether core files are generated
(1) Use the ulimit -c command to view the maximum size of the generated core file. If the result is 0, it means that the core file will not be generated.
(2) Use the ulimit -c FILESIZE command to limit the size of the core file (FILESIZE in KB). If the generated information exceeds this size, it will be truncated and an incomplete core file will be generated. When debugging this core file, gdb will prompt an error. For example: ulimit -c 1024.
(3) Using ulimit -c unlimited means that the size of the core file is unlimited.
At the terminal, the command ulimit -c unlimited is only a temporary modification and is invalid after restart. There are three ways to permanently modify:
(1) In / etc / RC Add a line ulimit -c unlimited in local;
(2) Add a line ulimit -c unlimited in / etc/profile;
(3) In / etc / security / limits At the end of conf, add the following two lines of records:
3.3 control the name and generation path of core file
Core the default file name is core pid, pid refers to the process number of the program that generated the segment error. The default path is the current directory of the program that generated the segment error.
If you want to modify the name and generation path of the core file, the relevant configuration file is:
/proc/sys/kernel/core_uses_pid
	Used to control generated core Add to the file name of the file pid As an extension, if added, the file content is 1, otherwise it is 0

/proc/sys/kernel/core_pattern
	Can set core The location and name where the file is saved. such as echo "/corefile/core-%e-%p-%t" > /proc/sys/kernel/core_pattern,
Generated by core The file will be stored in /corefile Directory, the generated file name is: core-Command name-pid-time stamp
4. Steps to debug core files using gdb
When using gdb to debug the core file to find the location of segment errors in the program, it should be noted that the executable program needs to add the - g compile command option when compiling.
The steps of gdb debugging core files are also relatively simple. The steps are as follows:
(1) Start gdb and specify the program and core file.
gdb EXEFILE COREFILE
#or
gdb -c | --core COREFILE EXEFILE

#or
gdb COREFILE
file EXEFILE
(2) After entering gdb, find the wrong position of the segment and use where or bt.

You can locate the specific location of the specific file in the source program, and there is a segment error.
Reference connection
https://openwrt.org/docs/guide-developer/gdb
https://zhuanlan.zhihu.com/p/95924162