Welcome to pay attention Column of "pandas_alive drawing dynamic map of competition" , continuously updating
Welcome to pay attention Column of "pandas_alive drawing dynamic map of competition" , continuously updating
Resource file download:
Column learning instructions (configured venv virtual environment + take and use test code + test data set + parameter api analysis)
Preview of all renderings:
Rendering display (configured venv virtual environment + take and use test code + test data set + parameter api analysis)
Environment configuration:
Environment configuration and detection (configured venv virtual environment + ready to use test code + test data set + parameter api analysis)
3. Scatter diagram
A reminder appears:
E:\allworkspace\python work space\Python Dynamic graph_pandas_alive\pandas_alive\charts.py:420: UserWarning: Discarding nonzero nanoseconds in conversion
  super().set_x_y_limits(self.df, i, self.ax)

User warning: converting super() set_ x_ y_ I understand that discarding non-zero nanoseconds in limits (self. DF, I, self. Ax) should be the loss of accuracy and will not affect the drawing.
Scatter diagram API Description:
parse_dates={"Timestamp": ["Year", "Month", "Day"]}
- The parsed data is in year month day format
dt.strftime('%Y/%m/%d')
- Standardize this column of data format to output year month day
kind='scatter',
- kind = "scatter", the chart type is scatter chart
keep_columns = ["Minimum temperature (Degree C)", "Maximum temperature (Degree C)"]
- Set legend content
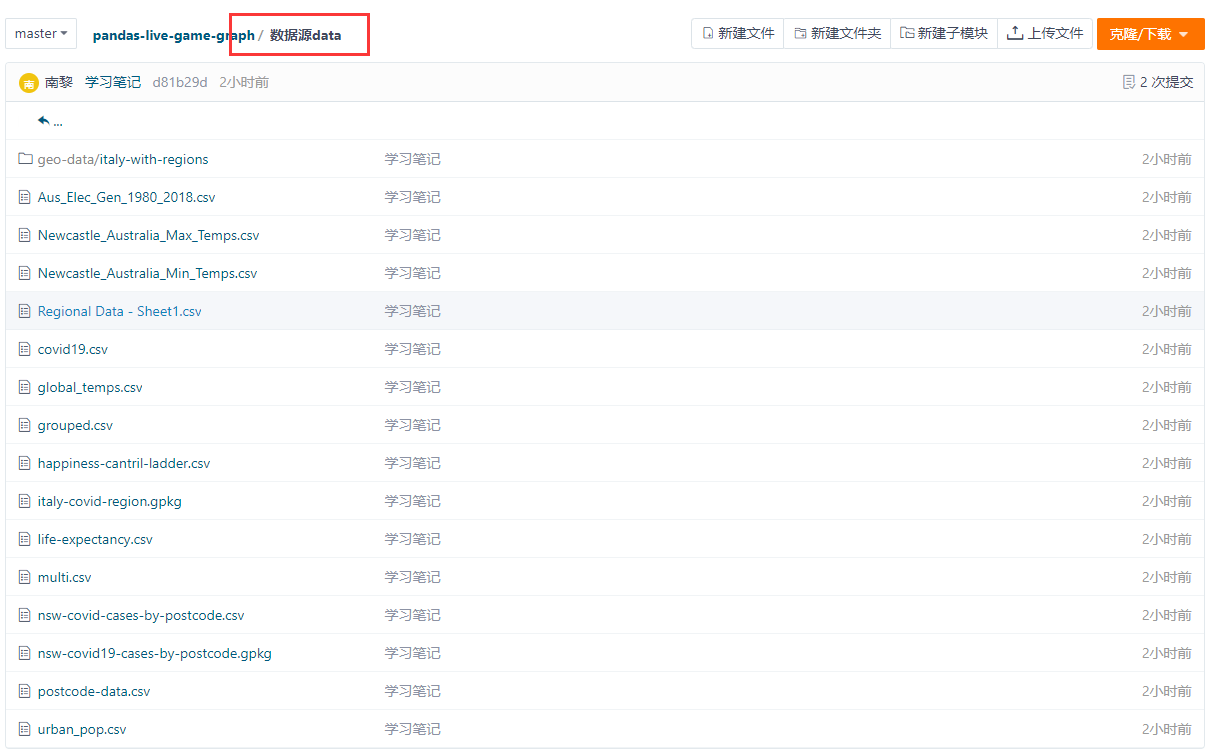
Scatter chart dataset
Newcastle_Australia_Max_Temps.csv
Newcastle_Australia_Min_Temps.csv
The amount of data is too large, and the step-by-step code cloud downloads the data set
https://gitee.com/miao-zehao/pandas-live-game-graph
Scatter routine
# @Time    : 2022/1/12 19:57
# @Author: Nanli
# @FileName: 3..py

import pandas as pd

######Display Chinese Song typeface import. If you use Chinese, add this code######
import matplotlib as plt

plt.rcParams['font.sans-serif'] = ['SimHei']
plt.rcParams['axes.unicode_minus'] = False
#####################################################

import pandas as pd
import pandas_alive

max_temp_df = pd.read_csv(
    "data source data/Newcastle_Australia_Max_Temps.csv",
    parse_dates={"Timestamp": ["Year", "Month", "Day"]},
)
min_temp_df = pd.read_csv(
    "data source data/Newcastle_Australia_Min_Temps.csv",
    parse_dates={"Timestamp": ["Year", "Month", "Day"]},
)

merged_temp_df = pd.merge_asof(max_temp_df, min_temp_df, on="Timestamp")

merged_temp_df.index = pd.to_datetime(merged_temp_df["Timestamp"].dt.strftime('%Y/%m/%d'))

#Set legend content
keep_columns = ["Minimum temperature (Degree C)", "Maximum temperature (Degree C)"]

merged_temp_df[keep_columns].resample("Y").mean().plot_animated(
    filename='3.Scatter diagram.gif',
    kind="scatter",#The chart type is scatter chart
    title='Find you far away - 3.Scatter diagram'
)
summary
Copyright notice:
If you find that you are far away from the @mzh original work, you must mark the original link for reprint
Copyright 2022 mzh
Crated: 2022-1-13
I've been tossing around for a week and sorted out a lot of methods for getting started with Xiaobai lightning protection, which will continue to be updated. If it's helpful to you, I hope to get your praise 👍 Collection support! (after all, it's too difficult to finish learning in a short time. It's recommended to put it in your favorites to eat ash)
Welcome to pay attention Column of "pandas_alive drawing dynamic map of competition" , continuously updating
Welcome to pay attention Column of "pandas_alive drawing dynamic map of competition" , continuously updating
[I. effect diagram display (configured venv virtual environment + ready to use test code + test data set + parameter api analysis)]
[II. Column learning instructions (configured venv virtual environment + ready to use test code + test data set + parameter api analysis)]
[III. environment configuration and detection (configured venv virtual environment + ready to use test code + test data set + parameter api analysis)]
[IV. data set description (configured venv virtual environment + ready to use test code + test data set + parameter api analysis)]
[v. common problems (configured venv virtual environment + ready to use test code + test data set + parameter api analysis)]
[1. Bar chart (test code + data set + drawing parameter analysis)]
[2. Line chart (test code + data set + drawing parameter analysis)]
[3. Scatter diagram (test code + data set + drawing parameter analysis)]
[4. Pie chart (test code + data set + drawing parameter analysis)]
[5. Bubble chart (test code + data set + drawing parameter analysis)]
[6. Geospatial map (test code + dataset + drawing parameter analysis)]
[7. Multiple charts (test code + data set + drawing parameter analysis)]
[8. Urban population (test code + data set + drawing parameter analysis)]
[9. Life expectancy of G7 countries (test code + data set + drawing parameter analysis)]
[10. New South Wales COVID visualization (test code + dataset + drawing parameter analysis)]
[more details]