summary
- Prometheus: container monitoring system. https://prometheus.io https://github.com/prometheus
- Grafana: it is an open source measurement analysis and visualization system. https://grafana.com/grafana
- node_ The exporter plug-in collects server data. https://github.com/prometheus/node_exporter/
Idea: node_ The exporter plug-in collects server data - prometheus stores the data collected by the plug-in - grafana shows the data collected by prometheus
1, Introducing Prometheus
Prometheus (Prometheus) is an open-source combination of monitoring & Alarm & time series database, which was initially developed by SoundCloud company. With the development, more and more companies and organizations accept Prometheus, and the society is also very active. They turn it into an independent open source project, and there are companies to operate it. The book of Google SRE also mentioned that the implementation similar to their BorgMon monitoring system is Prometheus. Now the most common Kubernetes container management system is usually monitored with Prometheus.
The basic principle of Prometheus is to periodically capture the status of monitored components through HTTP protocol. The advantage of this is that any component can access the monitoring system as long as it provides HTTP interface, without any SDK or other integration process. This is very suitable for virtualized environments, such as VM or Docker.
Prometheus should be one of the few monitoring systems suitable for Docker, Mesos and Kubernetes environments.
The HTTP interface that outputs the monitored component information is called an exporter. At present, most of the components commonly used by Internet companies can be directly used by exporters, such as Varnish, Haproxy, Nginx, MySQL and Linux system information (including disk, memory, CPU, network, etc.). See the specific support sources: https://github.com/prometheus .
Compared with other monitoring systems, Prometheus has the following main features:
A multidimensional data model (time series is defined by indicator name and set key / value size).
Very efficient storage. The average sampling data accounts for about 3.5bytes. The time series of 3.2 million is sampled every 30 seconds and maintained for 60 days, consuming about 228G of disk.
A flexible query language.
Independent of distributed storage, a single server node.
The time collection is through the PULL model over HTTP.
Push time is supported through the intermediate gateway.
Discover targets through service discovery or static configuration.
Multiple modes of graphics and dashboard support.
2, Node exporter installation
2.1 Docker installation node exporter
docker run -d -p 9100:9100 \
  --restart=always \
  --name node-exporter \
  prom/node-exporter
Check whether it starts normally

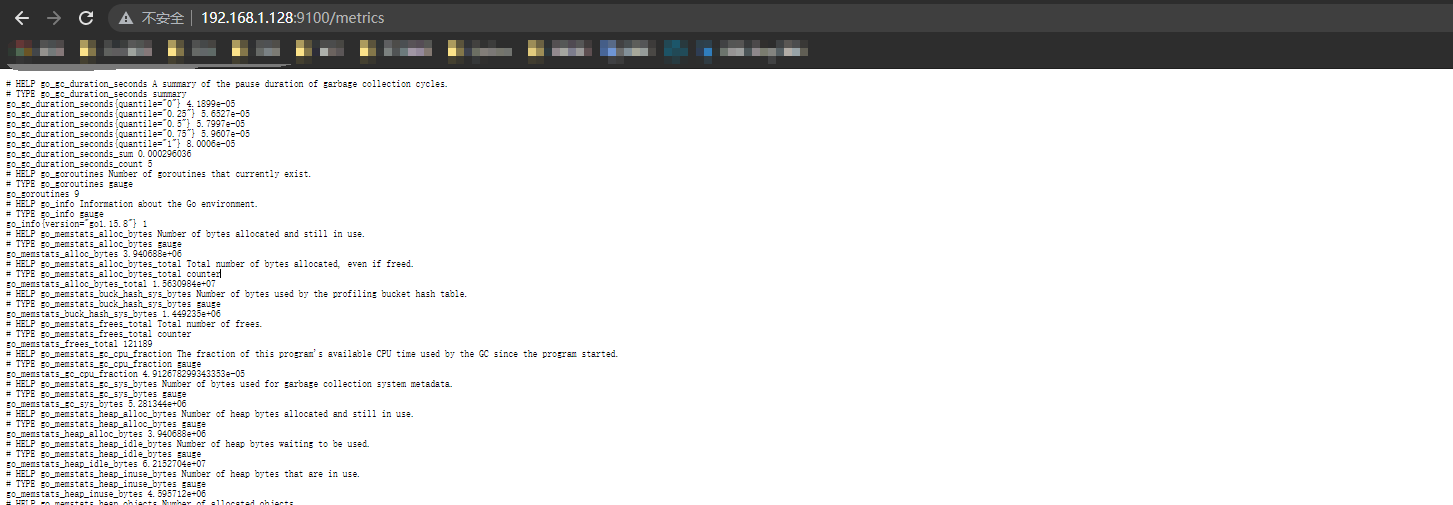
2.2 verify successful installation
Access URL http://IP:9100/metrics
3, Prometheus installation and configuration
3.1 setting profile
Create profile Prometheus yml
mkdir /data/prometheus && vim /data/prometheus/prometheus.yml
The content of the configuration file is as follows: fill in the IP address of the server to be monitored, that is, the IP address of the server on which node exporter is installed
global:
  scrape_interval:     15s # Set the scrape interval to every 15 seconds. Default is every 1 minute.
  evaluation_interval: 15s # Evaluate rules every 15 seconds. The default is every 1 minute.
  # scrape_timeout is set to the global default (10s).
alerting:
  alertmanagers:
  - static_configs:
    - targets:
      # - alertmanager:9093
rule_files:
  # - "first_rules.yml"
  # - "second_rules.yml"
scrape_configs:
  # The job name is added as a label `job=<job_name>` to any timeseries scraped from this config.
  - job_name: 'prometheus'
    # metrics_path defaults to '/metrics'
    # scheme defaults to 'http'.
  - job_name: 'linux'
    static_configs:
    - targets: ['192.168.1.128:9100']
      labels:
        instance: docker-01
    - targets: ['192.168.1.129:9100']
      labels:
        instance: docker-02
3.2 Docker installation Prometheus
docker run -d -p 9090:9090 -v /data/prometheus/prometheus.yml:/etc/prometheus/prometheus.yml prom/prometheus
Verify that the installation was successful
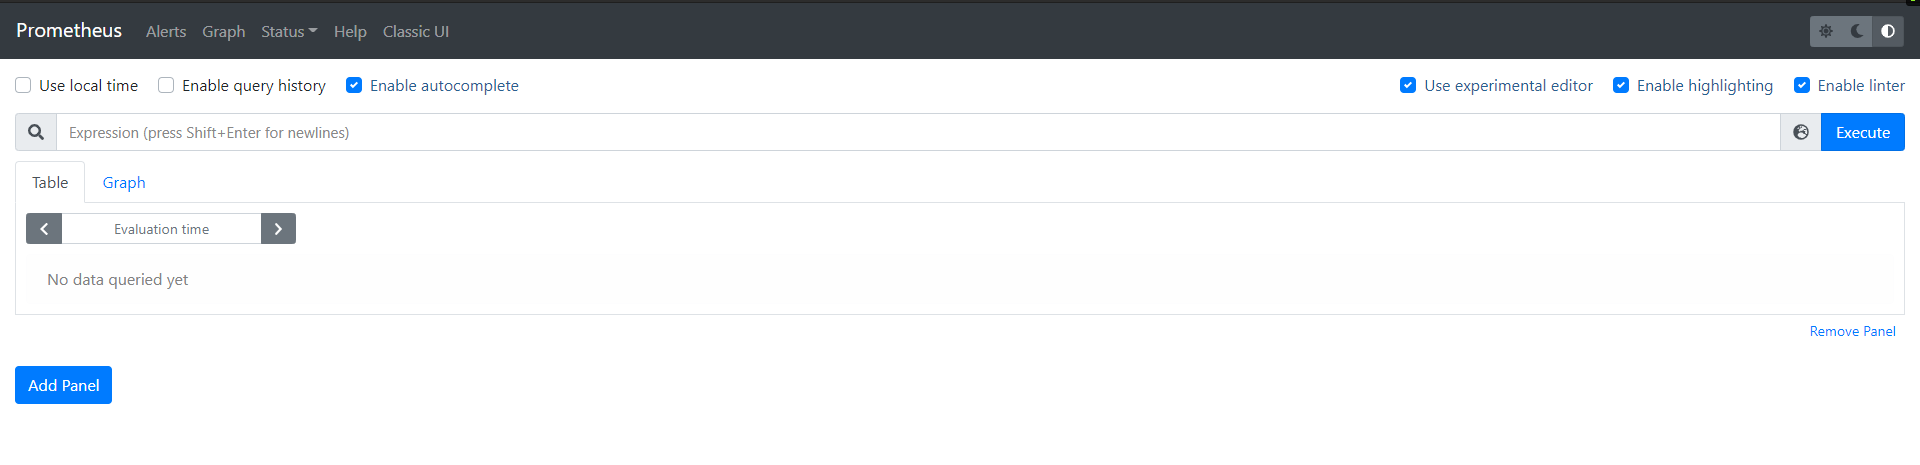
Access URL: http://IP:9090/graph
Access targets: http://IP:9090/targets
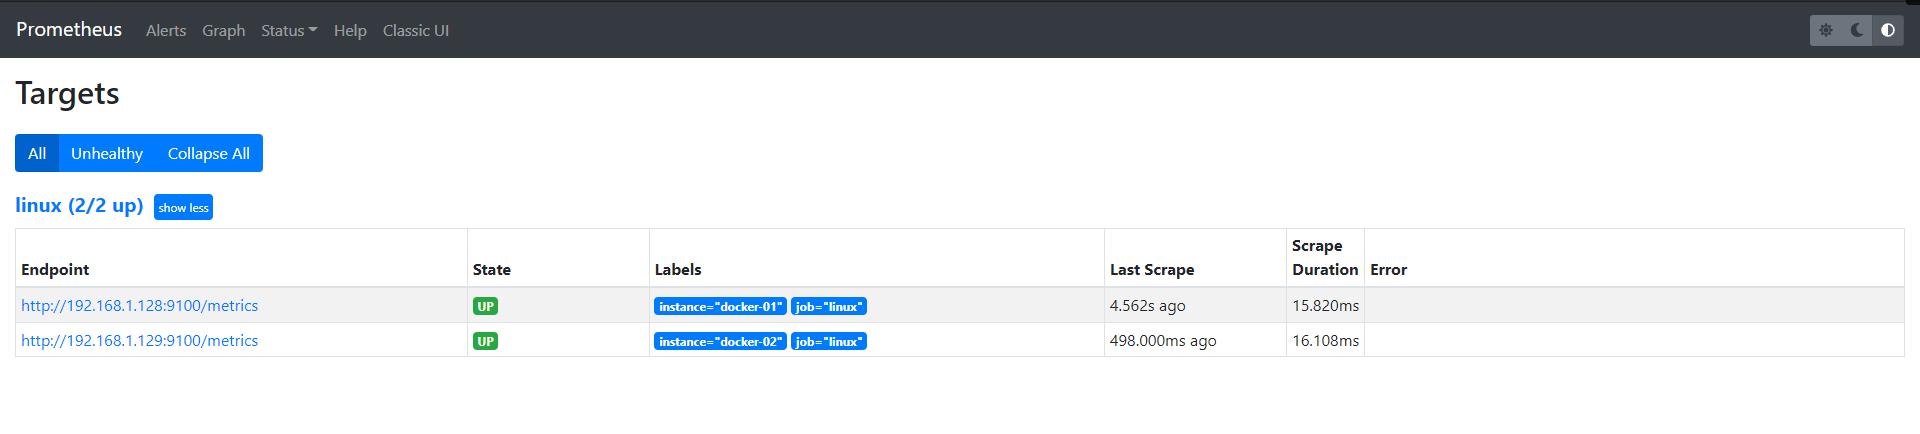
The display of up is normal
4, Grafana installation and configuration
4.1 Docker installation Grafana
docker run -d \
  --name=grafana \
  -p 3000:3000 \
  grafana/grafana
4.2 Granfana access and configuration
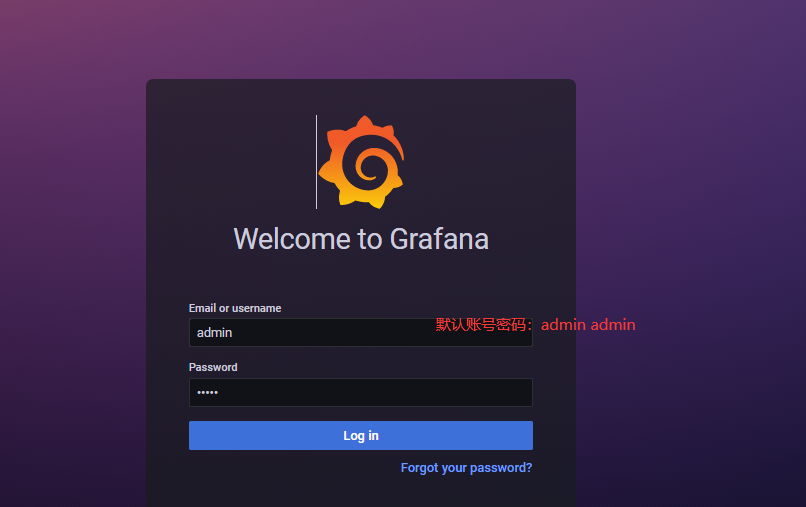
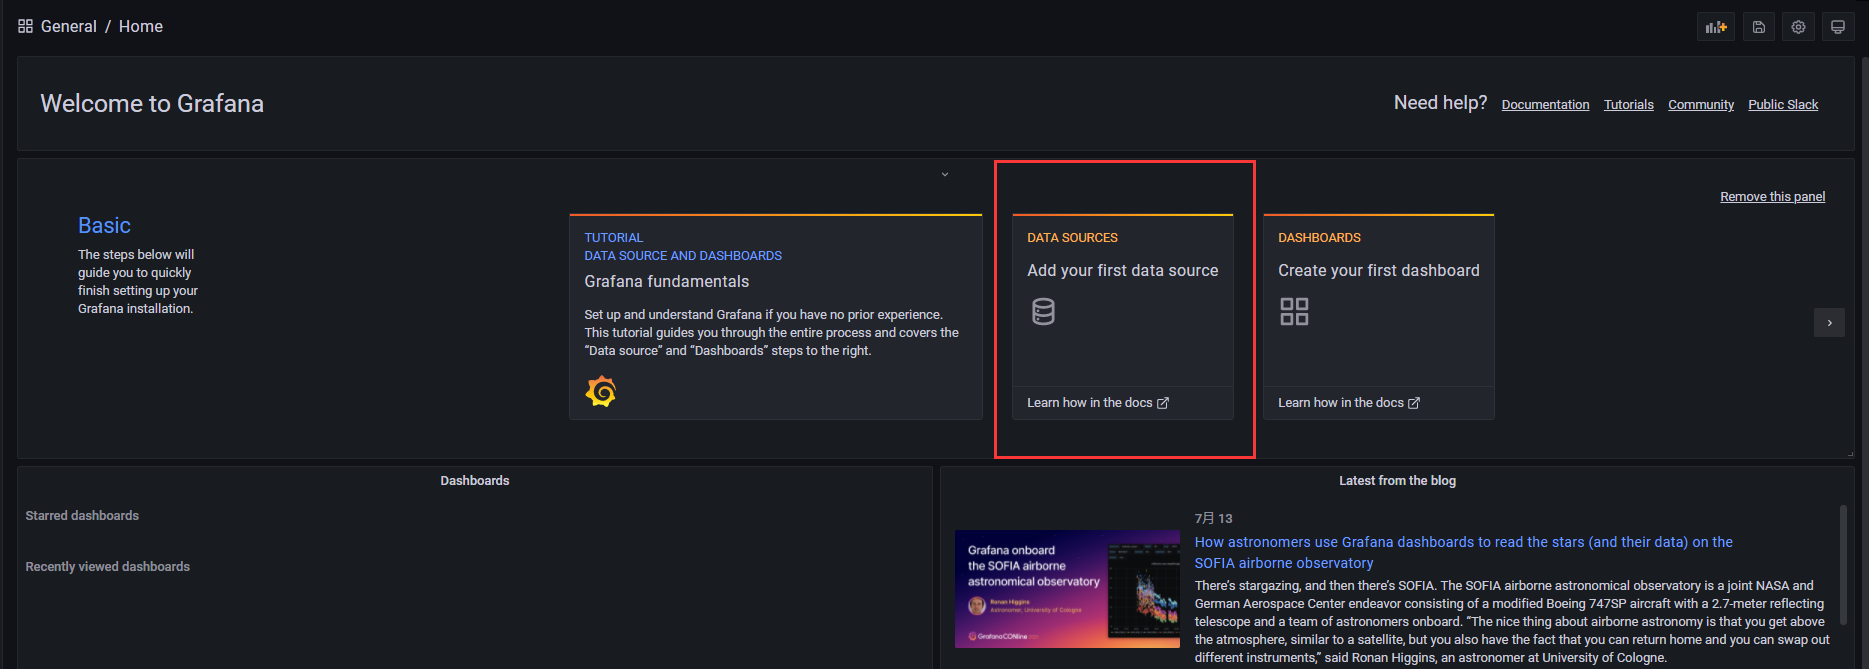
Access URL: http://IP:3000
Default account password: admin/admin set new password
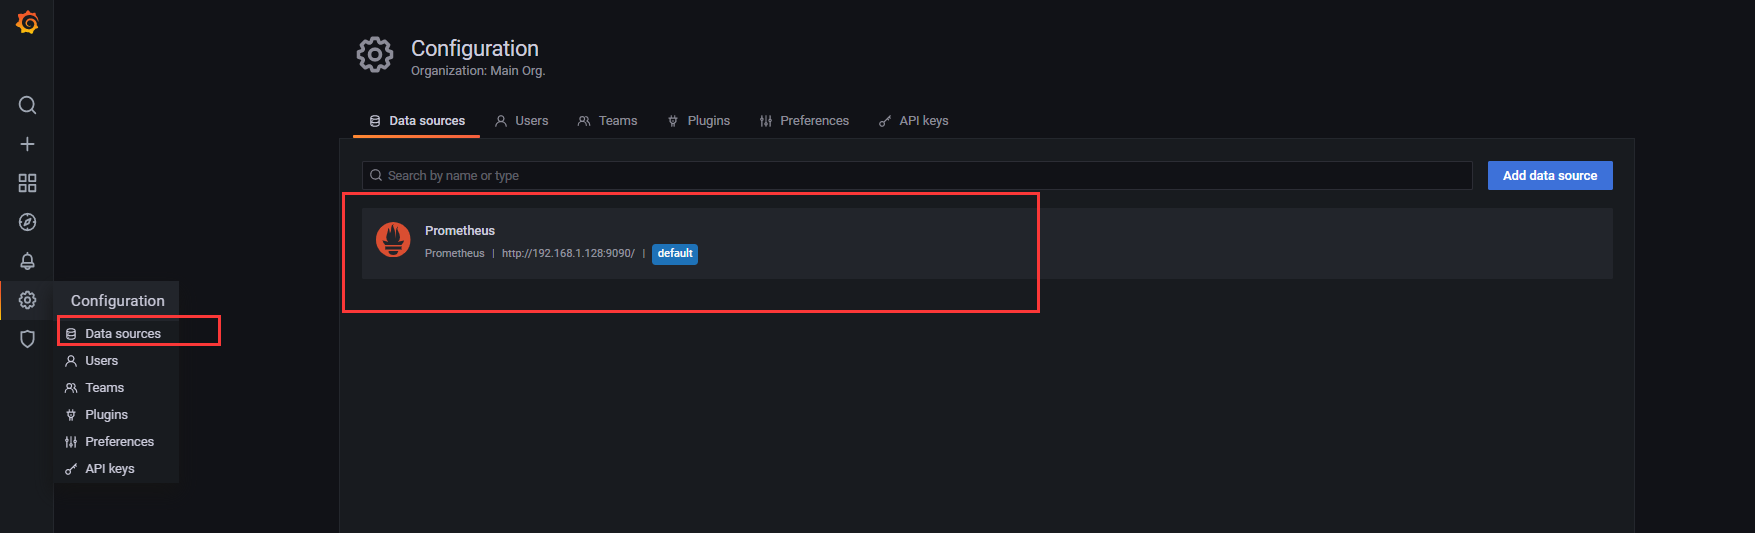
4.3 configuration of Prometheus by grafana
Add a data source and select Prometheus
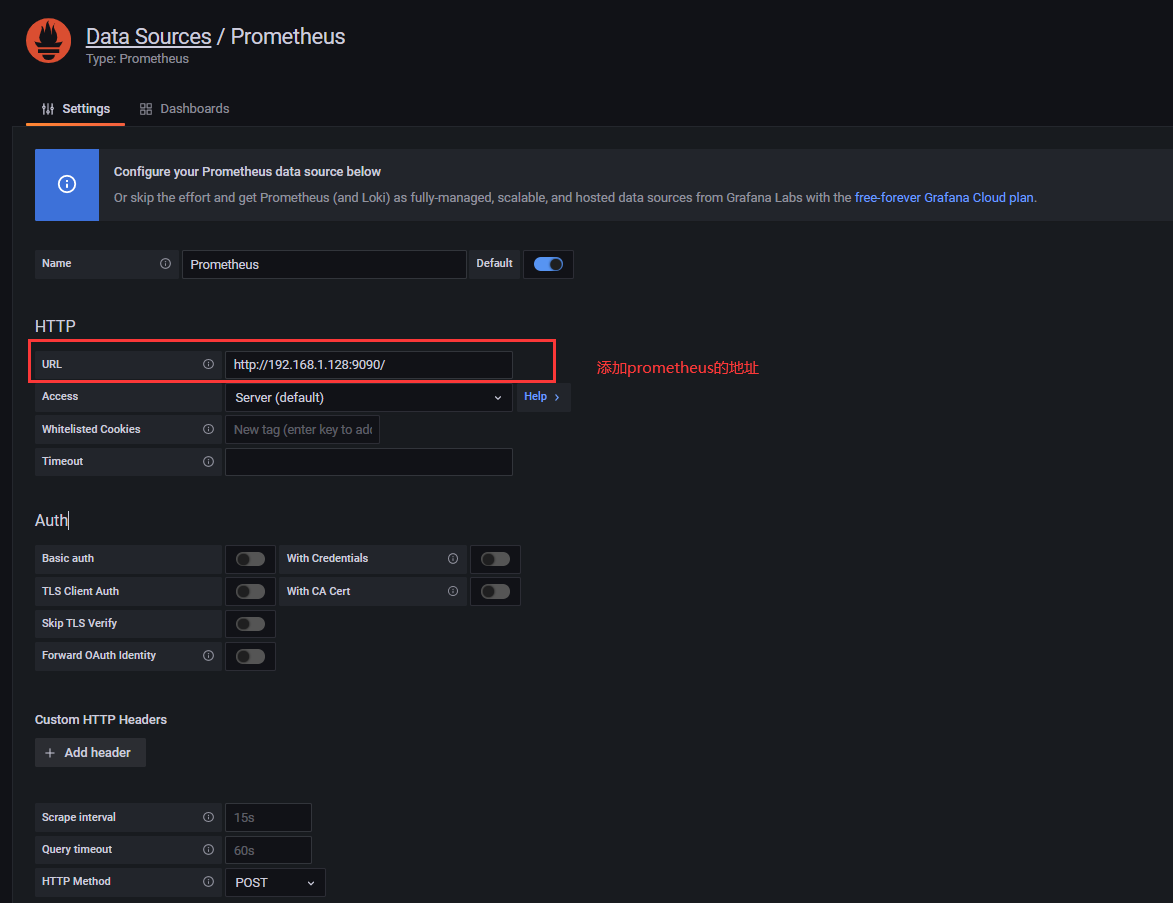
Check whether the configuration is successful
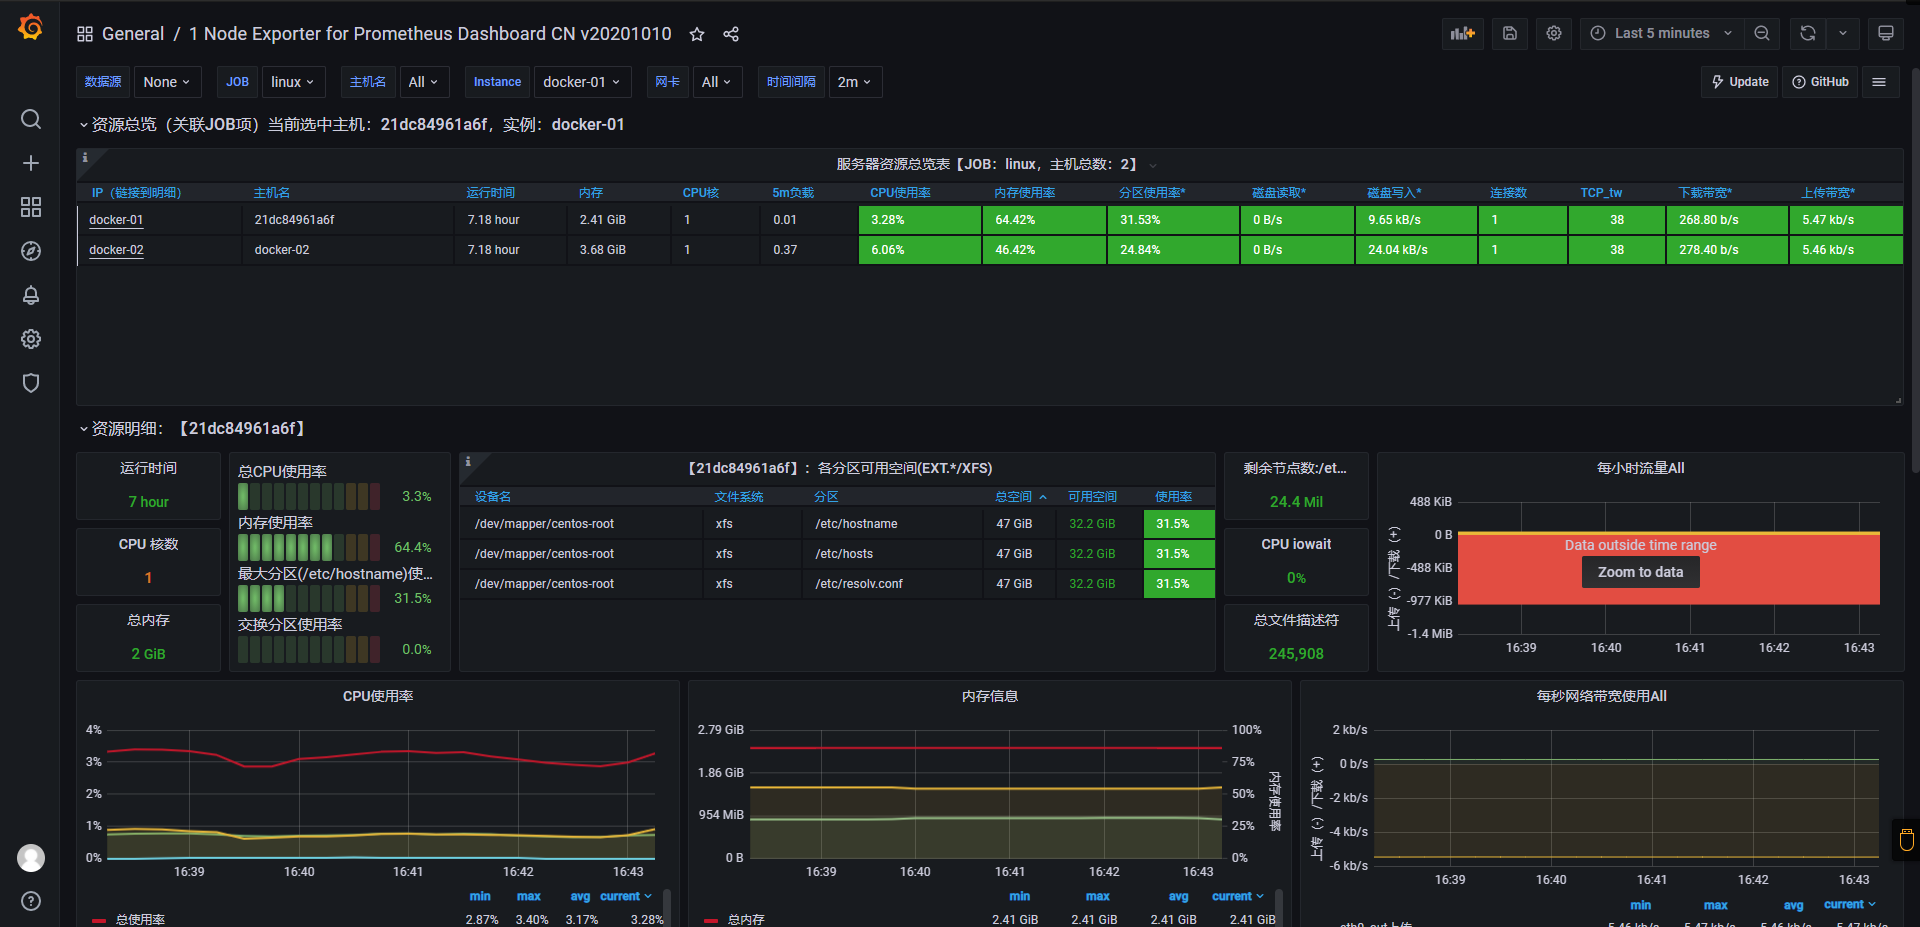
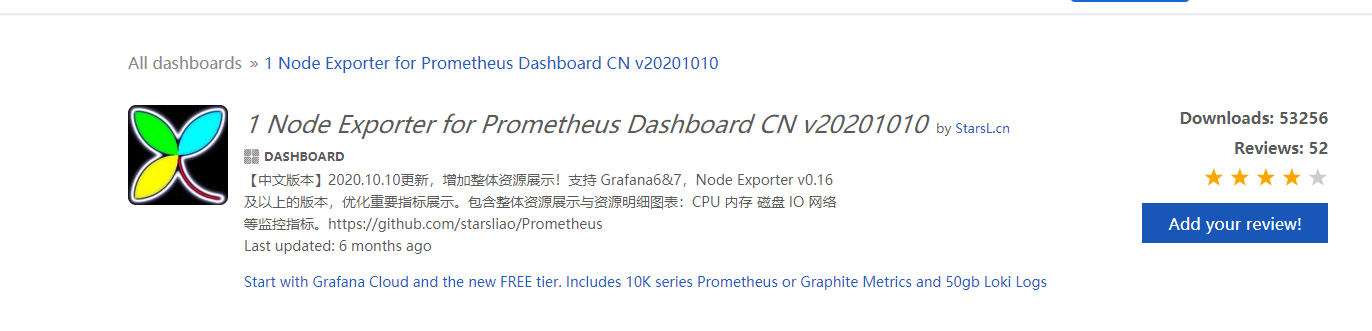
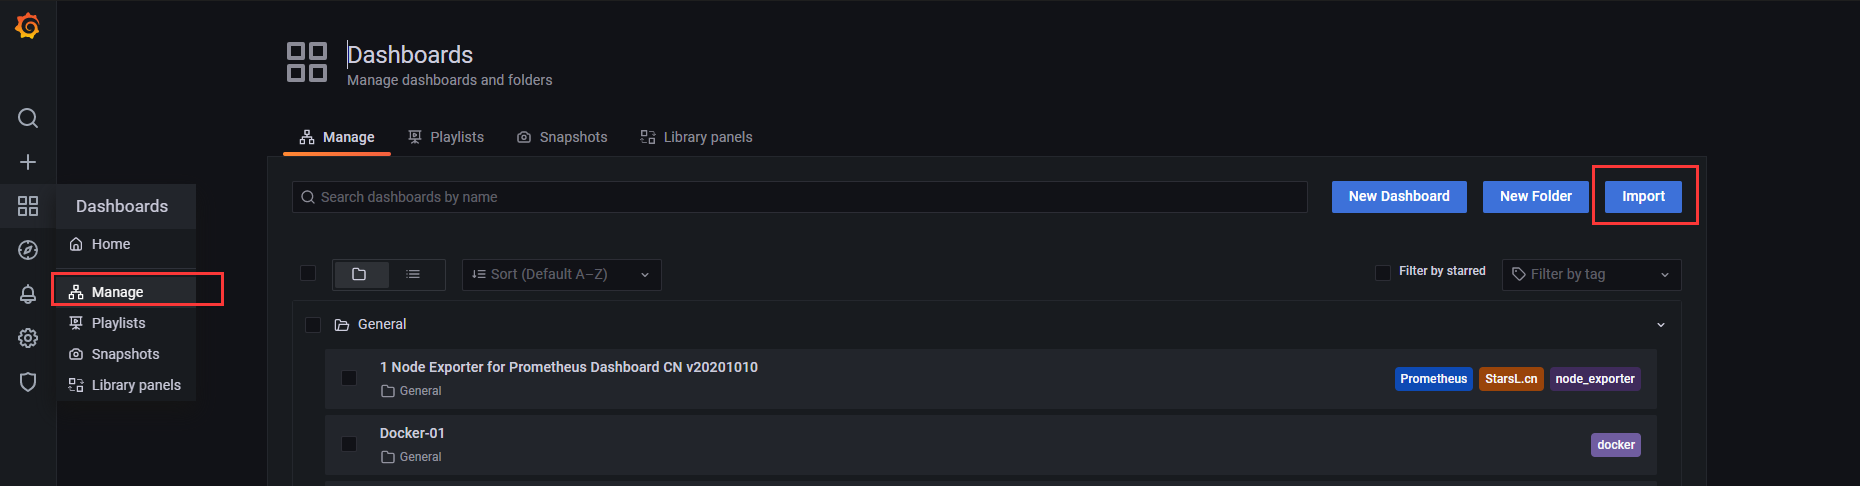
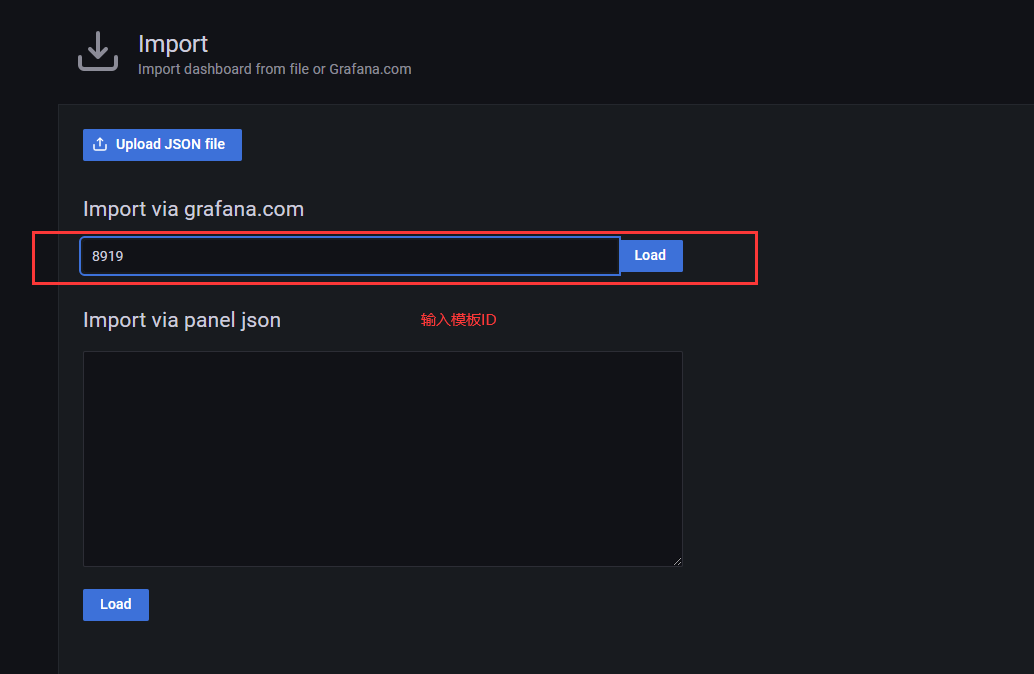
4.4 import template and create dashboard
Import the template file with ID 8919 and the link is: https://grafana.com/grafana/dashboards/8919
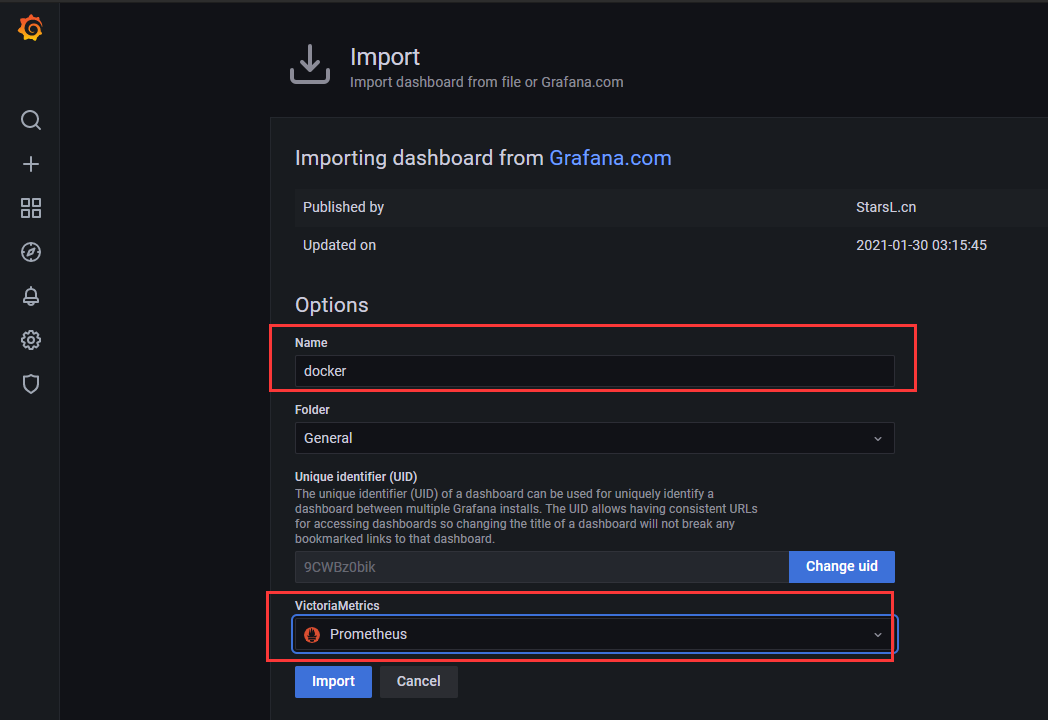
Successfully displayed
